
|
|||||
|
 | |
| |
| |
| |
| |
| |
|
Gene: TUBA1B |
Gene summary for TUBA1B |
| Gene information | Species | Human | Gene symbol | TUBA1B | Gene ID | 10376 |
| Gene name | tubulin alpha 1b | |
| Gene Alias | K-ALPHA-1 | |
| Cytomap | 12q13.12 | |
| Gene Type | protein-coding | GO ID | GO:0000226 | UniProtAcc | P68363 |
Top |
Malignant transformation analysis |
| Identification of the aberrant gene expression in precancerous and cancerous lesions by comparing the gene expression of stem-like cells in diseased tissues with normal stem cells |
| Entrez ID | Symbol | Replicates | Species | Organ | Tissue | Adj P-value | Log2FC | Malignancy |
| 10376 | TUBA1B | P9T-E | Human | Esophagus | ESCC | 3.56e-20 | 1.55e+00 | 0.1131 |
| 10376 | TUBA1B | P10T-E | Human | Esophagus | ESCC | 4.90e-42 | 3.01e+00 | 0.116 |
| 10376 | TUBA1B | P11T-E | Human | Esophagus | ESCC | 1.06e-34 | 2.90e+00 | 0.1426 |
| 10376 | TUBA1B | P12T-E | Human | Esophagus | ESCC | 2.40e-33 | 1.82e+00 | 0.1122 |
| 10376 | TUBA1B | P15T-E | Human | Esophagus | ESCC | 1.84e-35 | 2.16e+00 | 0.1149 |
| 10376 | TUBA1B | P16T-E | Human | Esophagus | ESCC | 3.74e-30 | 2.16e+00 | 0.1153 |
| 10376 | TUBA1B | P17T-E | Human | Esophagus | ESCC | 2.53e-23 | 2.68e+00 | 0.1278 |
| 10376 | TUBA1B | P19T-E | Human | Esophagus | ESCC | 9.13e-21 | 4.06e+00 | 0.1662 |
| 10376 | TUBA1B | P20T-E | Human | Esophagus | ESCC | 5.95e-25 | 1.65e+00 | 0.1124 |
| 10376 | TUBA1B | P21T-E | Human | Esophagus | ESCC | 2.73e-56 | 3.47e+00 | 0.1617 |
| 10376 | TUBA1B | P22T-E | Human | Esophagus | ESCC | 1.66e-29 | 1.83e+00 | 0.1236 |
| 10376 | TUBA1B | P23T-E | Human | Esophagus | ESCC | 8.33e-29 | 2.25e+00 | 0.108 |
| 10376 | TUBA1B | P24T-E | Human | Esophagus | ESCC | 2.14e-53 | 2.77e+00 | 0.1287 |
| 10376 | TUBA1B | P26T-E | Human | Esophagus | ESCC | 2.71e-23 | 2.16e+00 | 0.1276 |
| 10376 | TUBA1B | P27T-E | Human | Esophagus | ESCC | 4.81e-48 | 2.39e+00 | 0.1055 |
| 10376 | TUBA1B | P28T-E | Human | Esophagus | ESCC | 9.91e-49 | 2.51e+00 | 0.1149 |
| 10376 | TUBA1B | P30T-E | Human | Esophagus | ESCC | 6.24e-13 | 2.63e+00 | 0.137 |
| 10376 | TUBA1B | P31T-E | Human | Esophagus | ESCC | 7.10e-56 | 3.02e+00 | 0.1251 |
| 10376 | TUBA1B | P32T-E | Human | Esophagus | ESCC | 8.84e-59 | 3.94e+00 | 0.1666 |
| 10376 | TUBA1B | P36T-E | Human | Esophagus | ESCC | 2.71e-19 | 2.05e+00 | 0.1187 |
| Page: 1 2 3 4 5 6 7 8 9 10 11 12 13 14 |
| Tissue | Expression Dynamics | Abbreviation |
| Breast | 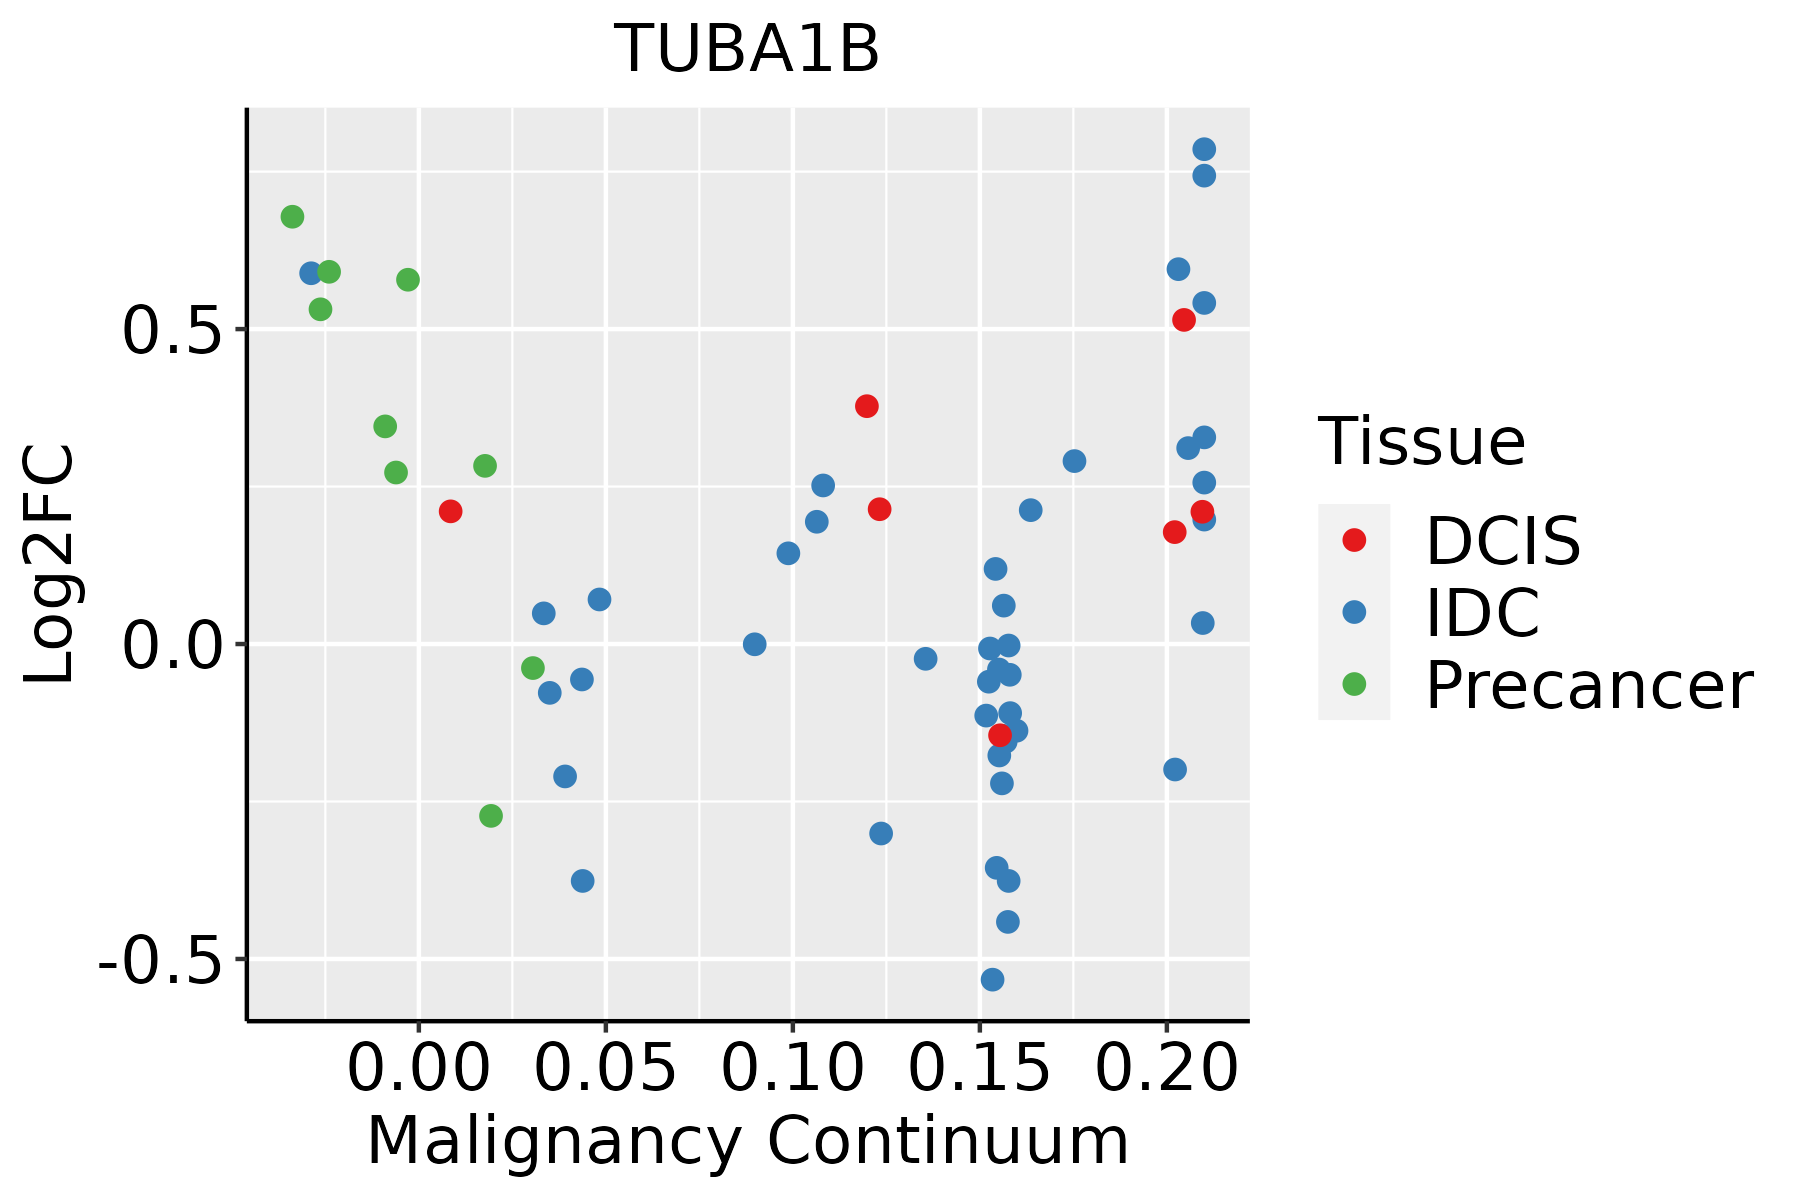 | IDC: Invasive ductal carcinoma |
| DCIS: Ductal carcinoma in situ | ||
| Precancer(BRCA1-mut): Precancerous lesion from BRCA1 mutation carriers | ||
| Cervix |  | CC: Cervix cancer |
| HSIL_HPV: HPV-infected high-grade squamous intraepithelial lesions | ||
| N_HPV: HPV-infected normal cervix | ||
| Endometrium |  | AEH: Atypical endometrial hyperplasia |
| EEC: Endometrioid Cancer | ||
| Esophagus | 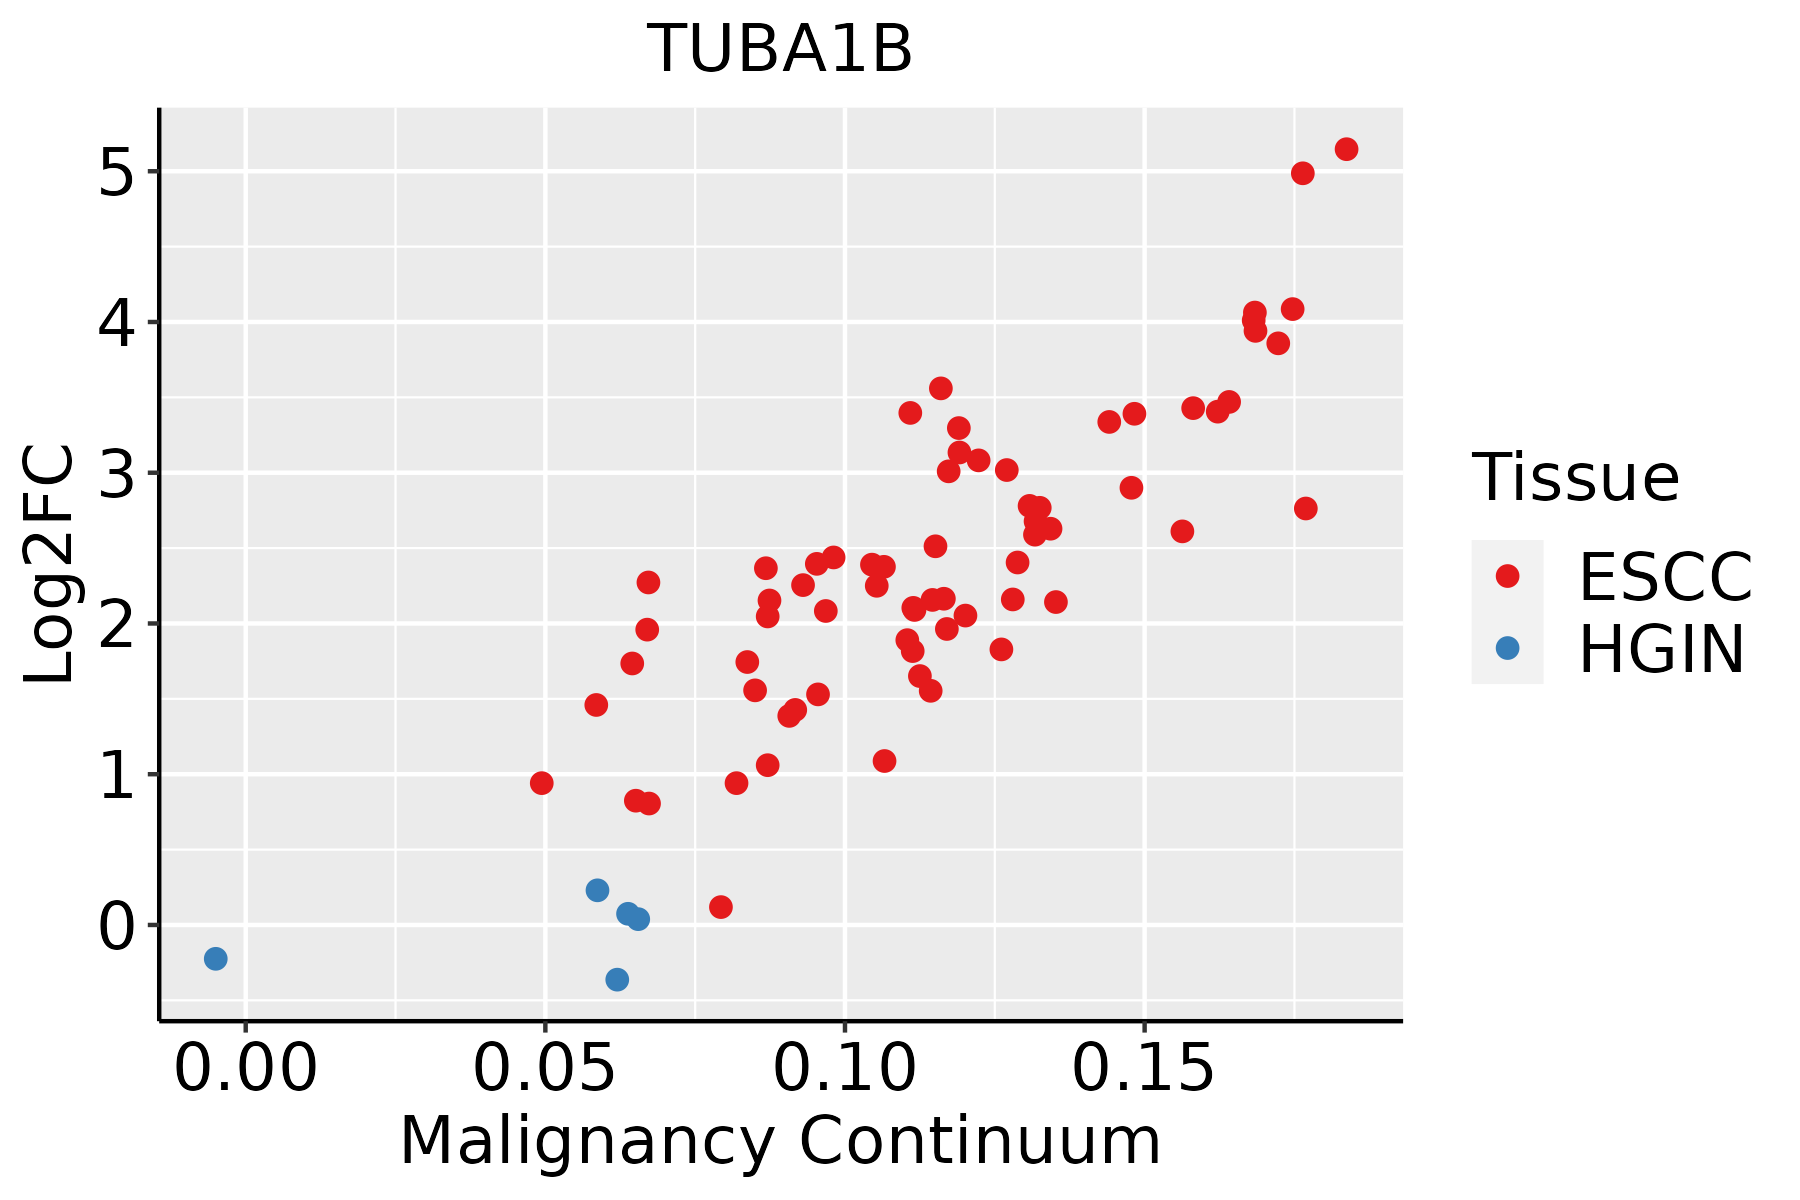 | ESCC: Esophageal squamous cell carcinoma |
| HGIN: High-grade intraepithelial neoplasias | ||
| LGIN: Low-grade intraepithelial neoplasias | ||
| GC | 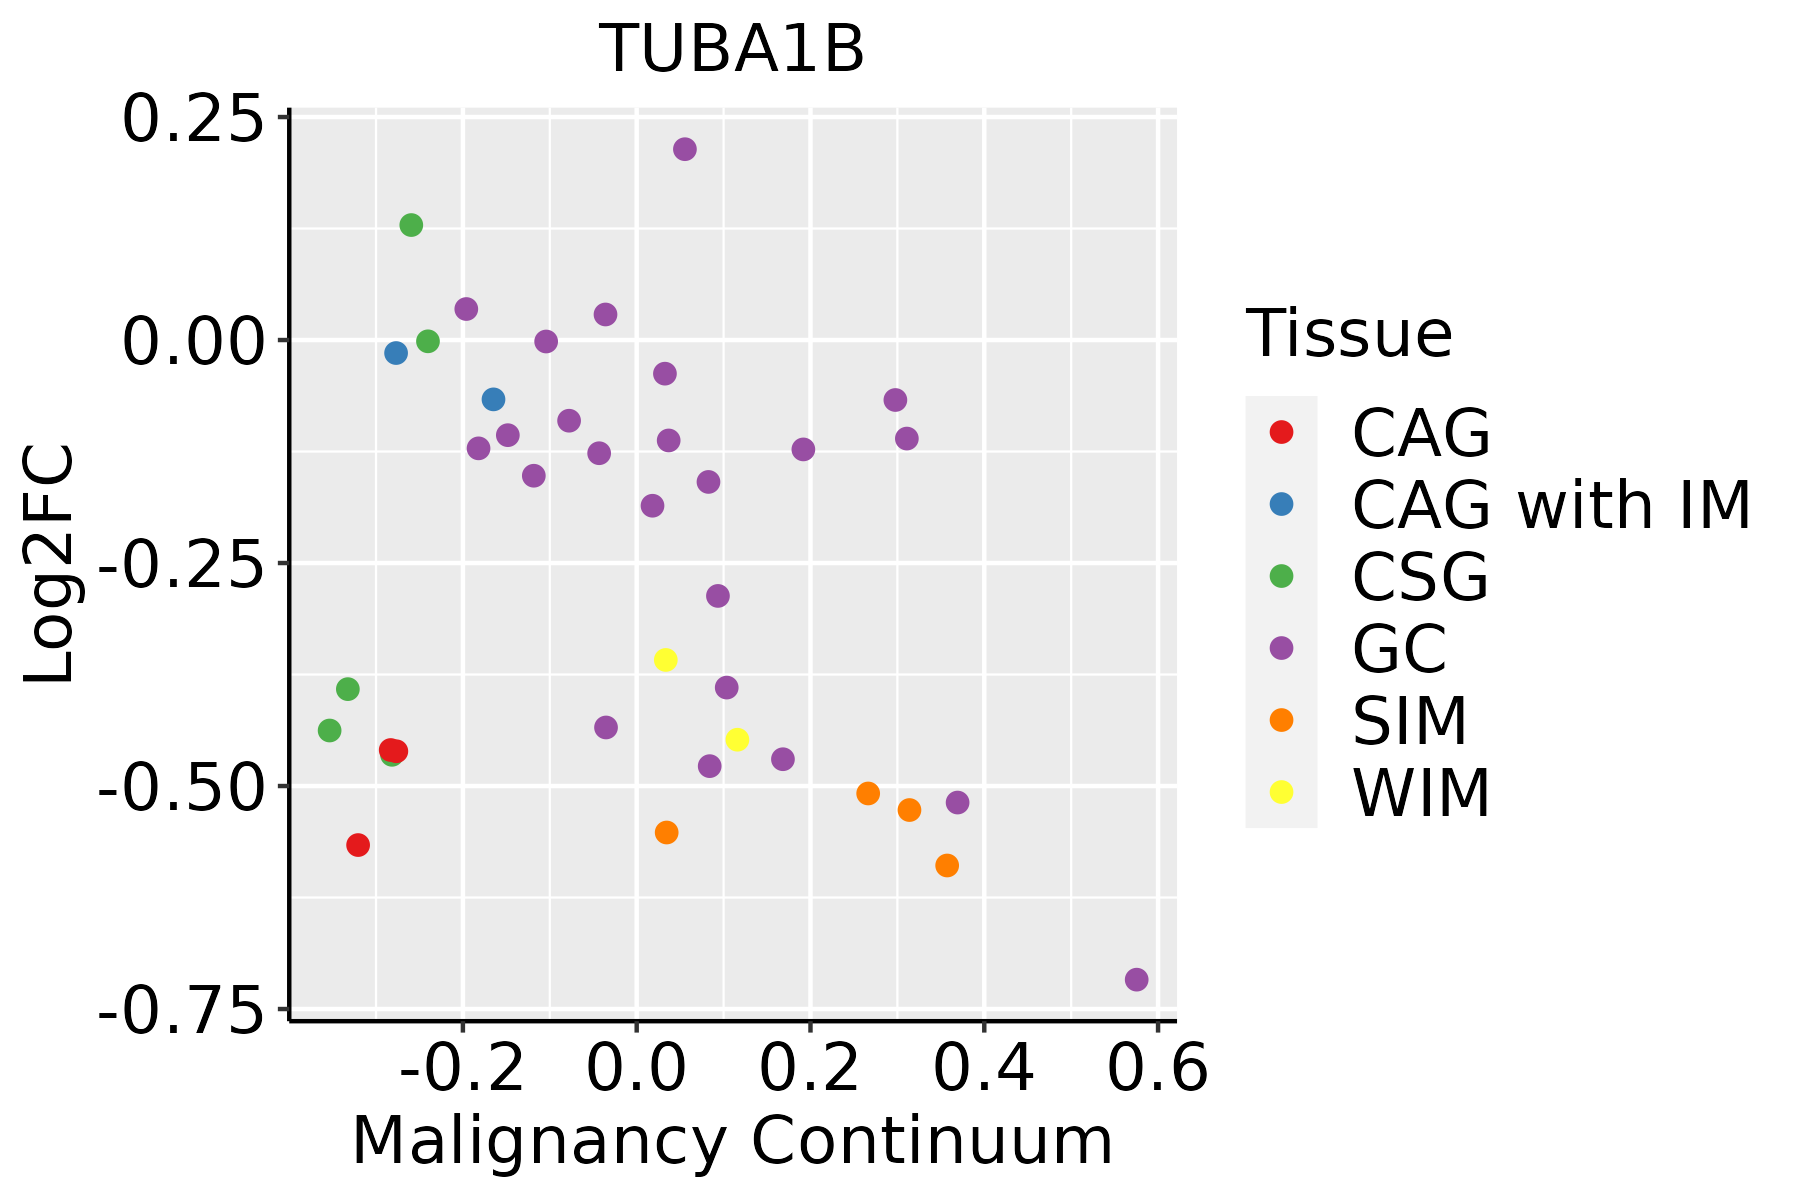 | CAG: Chronic atrophic gastritis |
| CAG with IM: Chronic atrophic gastritis with intestinal metaplasia | ||
| CSG: Chronic superficial gastritis | ||
| GC: Gastric cancer | ||
| SIM: Severe intestinal metaplasia | ||
| WIM: Wild intestinal metaplasia | ||
| Liver |  | HCC: Hepatocellular carcinoma |
| NAFLD: Non-alcoholic fatty liver disease | ||
| Oral Cavity | 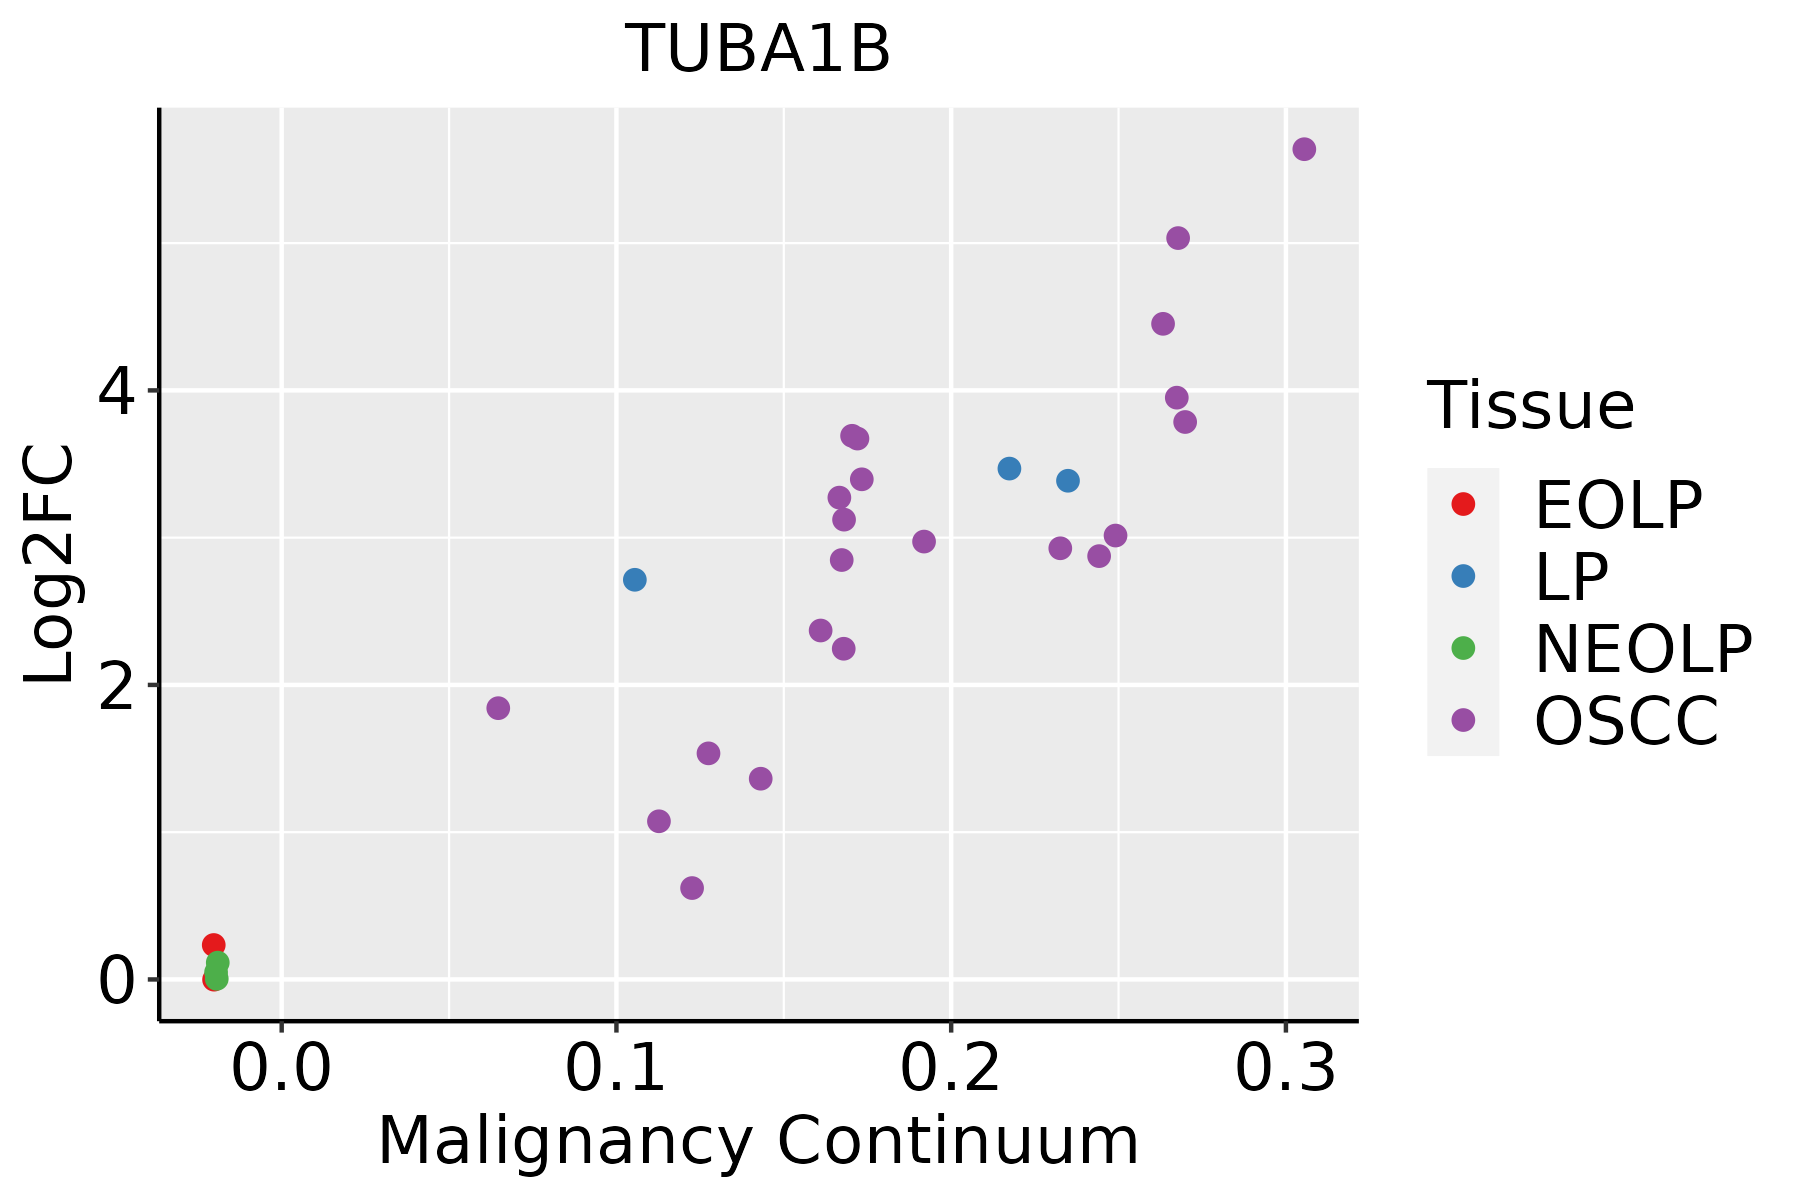 | EOLP: Erosive Oral lichen planus |
| LP: leukoplakia | ||
| NEOLP: Non-erosive oral lichen planus | ||
| OSCC: Oral squamous cell carcinoma | ||
| Prostate | 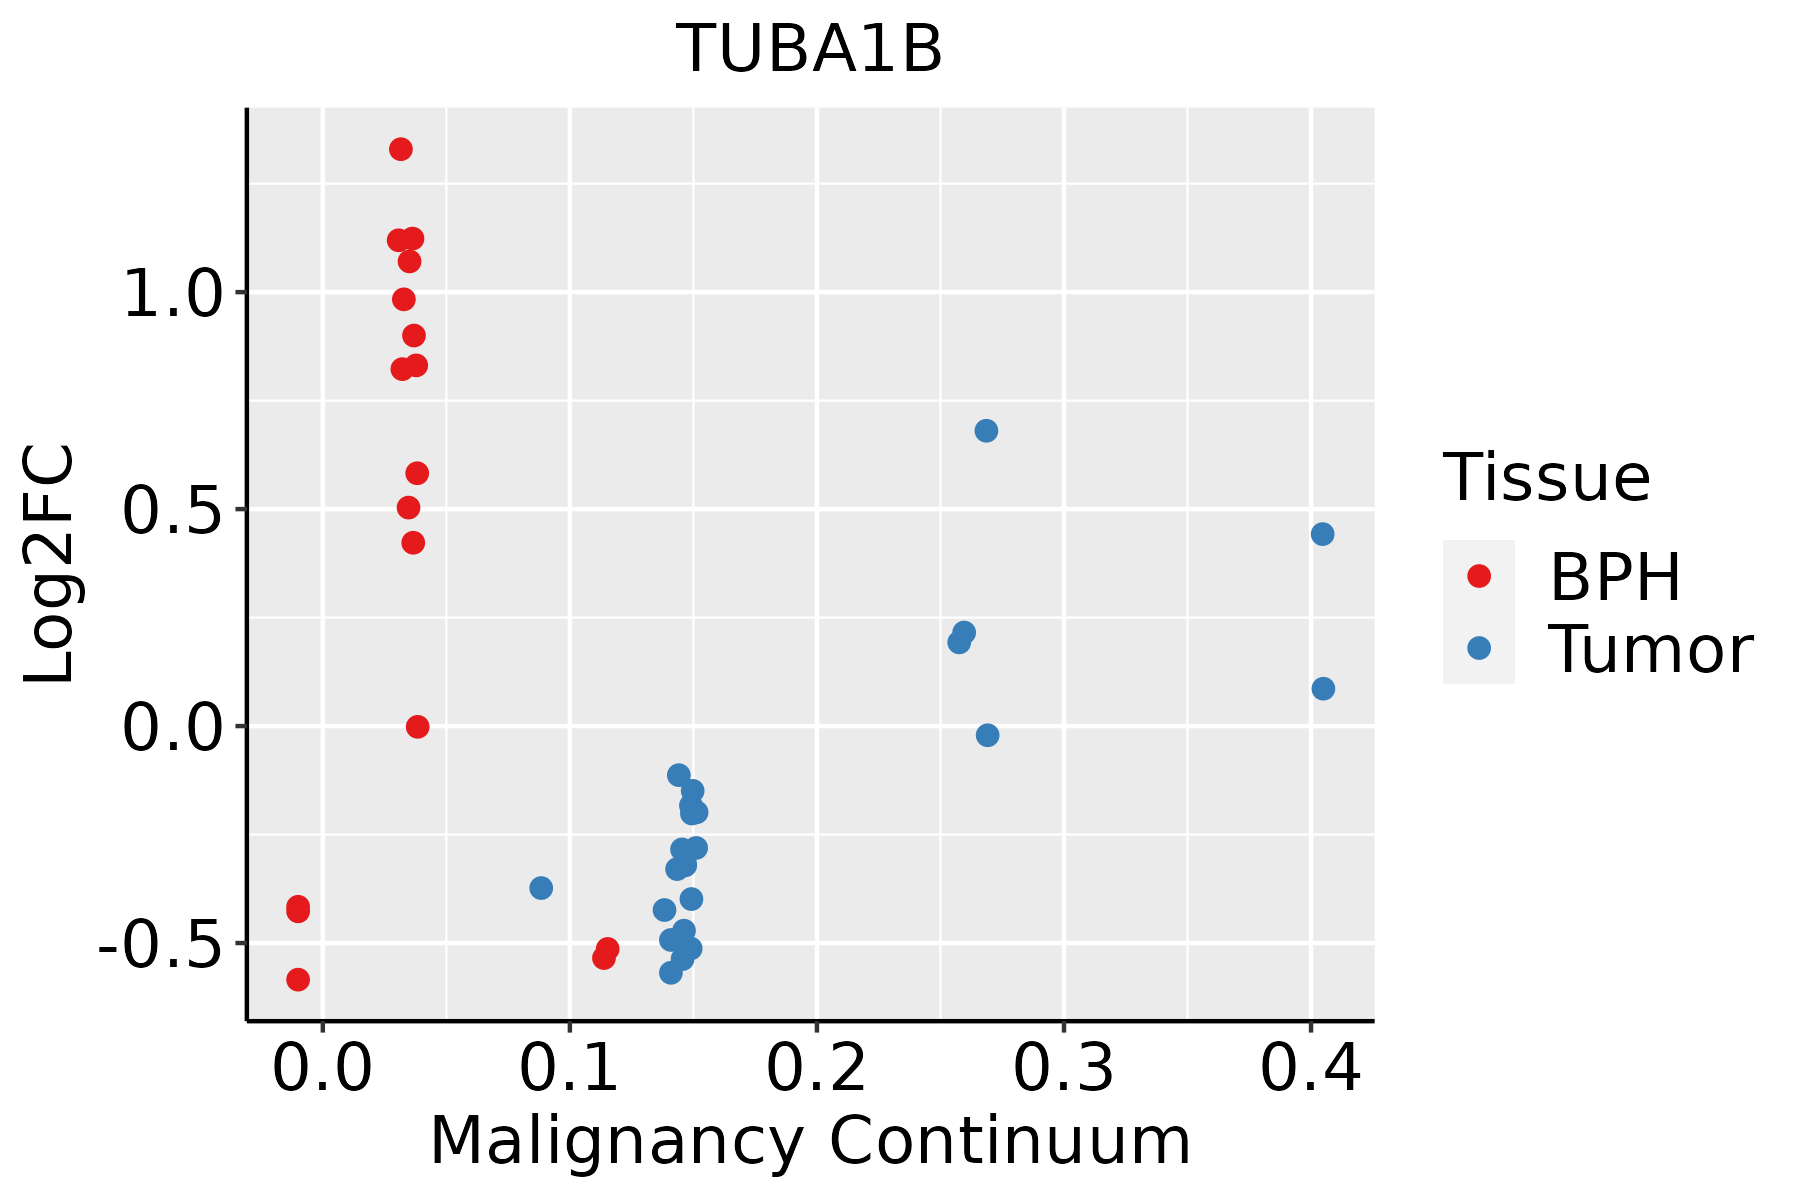 | BPH: Benign Prostatic Hyperplasia |
| Skin |  | AK: Actinic keratosis |
| cSCC: Cutaneous squamous cell carcinoma | ||
| SCCIS:squamous cell carcinoma in situ | ||
| Thyroid |  | ATC: Anaplastic thyroid cancer |
| HT: Hashimoto's thyroiditis | ||
| PTC: Papillary thyroid cancer |
| ∗log2FC in expression of this searched gene in stem-like cells from each diseased tissue sample relative to stem-like cells in normal samples in each tissue plotted against the malignancy continuum. Samples are colored based on if they are from different disease stage. |
Top |
Malignant transformation related pathway analysis |
| Find out the enriched GO biological processes and KEGG pathways involved in transition from healthy to precancer to cancer |
| Tissue | Disease Stage | Enriched GO biological Processes |
| Colorectum | AD |  |
| Colorectum | SER |  |
| Colorectum | MSS |  |
| Colorectum | MSI-H |  |
| Colorectum | FAP |  |
| ∗Top 15 enriched GO BP terms are showed in the bar plot of each disease state in each tissue. Each row represents a significant GO biological process which is colored according to the -log10(p.adjust). |
| Page: 1 2 3 4 5 6 7 8 9 |
| GO ID | Tissue | Disease Stage | Description | Gene Ratio | Bg Ratio | pvalue | p.adjust | Count |
| GO:00307057 | Cervix | CC | cytoskeleton-dependent intracellular transport | 40/2311 | 195/18723 | 7.92e-04 | 6.99e-03 | 40 |
| GO:00713533 | Cervix | HSIL_HPV | cellular response to interleukin-4 | 7/737 | 33/18723 | 2.48e-04 | 4.30e-03 | 7 |
| GO:00706703 | Cervix | HSIL_HPV | response to interleukin-4 | 7/737 | 36/18723 | 4.38e-04 | 6.51e-03 | 7 |
| GO:003070513 | Cervix | N_HPV | cytoskeleton-dependent intracellular transport | 13/534 | 195/18723 | 4.03e-03 | 3.16e-02 | 13 |
| GO:00307058 | Endometrium | AEH | cytoskeleton-dependent intracellular transport | 38/2100 | 195/18723 | 4.72e-04 | 4.91e-03 | 38 |
| GO:003070514 | Endometrium | EEC | cytoskeleton-dependent intracellular transport | 39/2168 | 195/18723 | 4.40e-04 | 4.58e-03 | 39 |
| GO:003070517 | Esophagus | HGIN | cytoskeleton-dependent intracellular transport | 45/2587 | 195/18723 | 3.07e-04 | 5.15e-03 | 45 |
| GO:003070518 | Esophagus | ESCC | cytoskeleton-dependent intracellular transport | 133/8552 | 195/18723 | 1.48e-10 | 4.27e-09 | 133 |
| GO:00713532 | Liver | Cirrhotic | cellular response to interleukin-4 | 17/4634 | 33/18723 | 8.32e-04 | 6.06e-03 | 17 |
| GO:003070511 | Liver | Cirrhotic | cytoskeleton-dependent intracellular transport | 68/4634 | 195/18723 | 9.54e-04 | 6.77e-03 | 68 |
| GO:00706702 | Liver | Cirrhotic | response to interleukin-4 | 17/4634 | 36/18723 | 2.82e-03 | 1.63e-02 | 17 |
| GO:003070521 | Liver | HCC | cytoskeleton-dependent intracellular transport | 111/7958 | 195/18723 | 3.25e-05 | 3.28e-04 | 111 |
| GO:007135311 | Liver | HCC | cellular response to interleukin-4 | 21/7958 | 33/18723 | 1.16e-02 | 4.28e-02 | 21 |
| GO:003070510 | Oral cavity | OSCC | cytoskeleton-dependent intracellular transport | 113/7305 | 195/18723 | 6.03e-08 | 1.09e-06 | 113 |
| GO:00713535 | Oral cavity | OSCC | cellular response to interleukin-4 | 21/7305 | 33/18723 | 3.63e-03 | 1.51e-02 | 21 |
| GO:00706705 | Oral cavity | OSCC | response to interleukin-4 | 21/7305 | 36/18723 | 1.46e-02 | 4.76e-02 | 21 |
| GO:007135313 | Oral cavity | LP | cellular response to interleukin-4 | 18/4623 | 33/18723 | 2.26e-04 | 2.41e-03 | 18 |
| GO:003070516 | Oral cavity | LP | cytoskeleton-dependent intracellular transport | 68/4623 | 195/18723 | 8.92e-04 | 7.64e-03 | 68 |
| GO:007067012 | Oral cavity | LP | response to interleukin-4 | 18/4623 | 36/18723 | 9.03e-04 | 7.72e-03 | 18 |
| GO:00307059 | Prostate | BPH | cytoskeleton-dependent intracellular transport | 68/3107 | 195/18723 | 3.78e-10 | 1.98e-08 | 68 |
| Page: 1 2 |
| Pathway ID | Tissue | Disease Stage | Description | Gene Ratio | Bg Ratio | pvalue | p.adjust | qvalue | Count |
| hsa0501218 | Breast | Precancer | Parkinson disease | 99/684 | 266/8465 | 3.58e-42 | 5.65e-40 | 4.33e-40 | 99 |
| hsa0502016 | Breast | Precancer | Prion disease | 95/684 | 273/8465 | 1.39e-37 | 1.46e-35 | 1.12e-35 | 95 |
| hsa0501616 | Breast | Precancer | Huntington disease | 98/684 | 306/8465 | 2.85e-35 | 2.25e-33 | 1.72e-33 | 98 |
| hsa0501016 | Breast | Precancer | Alzheimer disease | 103/684 | 384/8465 | 1.03e-29 | 4.66e-28 | 3.57e-28 | 103 |
| hsa0501416 | Breast | Precancer | Amyotrophic lateral sclerosis | 98/684 | 364/8465 | 2.13e-28 | 8.41e-27 | 6.44e-27 | 98 |
| hsa0502216 | Breast | Precancer | Pathways of neurodegeneration - multiple diseases | 112/684 | 476/8465 | 6.96e-27 | 2.44e-25 | 1.87e-25 | 112 |
| hsa0513218 | Breast | Precancer | Salmonella infection | 49/684 | 249/8465 | 2.92e-09 | 6.15e-08 | 4.71e-08 | 49 |
| hsa0513018 | Breast | Precancer | Pathogenic Escherichia coli infection | 38/684 | 197/8465 | 3.12e-07 | 5.81e-06 | 4.45e-06 | 38 |
| hsa0453018 | Breast | Precancer | Tight junction | 31/684 | 169/8465 | 1.13e-05 | 1.26e-04 | 9.64e-05 | 31 |
| hsa0414518 | Breast | Precancer | Phagosome | 27/684 | 152/8465 | 7.37e-05 | 6.85e-04 | 5.25e-04 | 27 |
| hsa042108 | Breast | Precancer | Apoptosis | 25/684 | 136/8465 | 7.61e-05 | 6.87e-04 | 5.26e-04 | 25 |
| hsa0501219 | Breast | Precancer | Parkinson disease | 99/684 | 266/8465 | 3.58e-42 | 5.65e-40 | 4.33e-40 | 99 |
| hsa0502017 | Breast | Precancer | Prion disease | 95/684 | 273/8465 | 1.39e-37 | 1.46e-35 | 1.12e-35 | 95 |
| hsa0501617 | Breast | Precancer | Huntington disease | 98/684 | 306/8465 | 2.85e-35 | 2.25e-33 | 1.72e-33 | 98 |
| hsa0501017 | Breast | Precancer | Alzheimer disease | 103/684 | 384/8465 | 1.03e-29 | 4.66e-28 | 3.57e-28 | 103 |
| hsa0501417 | Breast | Precancer | Amyotrophic lateral sclerosis | 98/684 | 364/8465 | 2.13e-28 | 8.41e-27 | 6.44e-27 | 98 |
| hsa0502217 | Breast | Precancer | Pathways of neurodegeneration - multiple diseases | 112/684 | 476/8465 | 6.96e-27 | 2.44e-25 | 1.87e-25 | 112 |
| hsa0513219 | Breast | Precancer | Salmonella infection | 49/684 | 249/8465 | 2.92e-09 | 6.15e-08 | 4.71e-08 | 49 |
| hsa0513019 | Breast | Precancer | Pathogenic Escherichia coli infection | 38/684 | 197/8465 | 3.12e-07 | 5.81e-06 | 4.45e-06 | 38 |
| hsa0453019 | Breast | Precancer | Tight junction | 31/684 | 169/8465 | 1.13e-05 | 1.26e-04 | 9.64e-05 | 31 |
| Page: 1 2 3 4 5 6 7 8 9 10 11 12 13 14 15 16 17 18 19 20 21 22 23 24 |
Top |
Cell-cell communication analysis |
| Identification of potential cell-cell interactions between two cell types and their ligand-receptor pairs for different disease states |
| Ligand | Receptor | LRpair | Pathway | Tissue | Disease Stage |
| Page: 1 |
Top |
Single-cell gene regulatory network inference analysis |
| Find out the significant the regulons (TFs) and the target genes of each regulon across cell types for different disease states |
| TF | Cell Type | Tissue | Disease Stage | Target Gene | RSS | Regulon Activity |
| ∗The dot plots of a searched regulon are shown for all cell subpopulations in each disease state of each tissue based on the regulon specific score inferred using pySCENIC and by calculating the average expression. |
| Page: 1 |
Top |
Somatic mutation of malignant transformation related genes |
| Annotation of somatic variants for genes involved in malignant transformation |
| Hugo Symbol | Variant Class | Variant Classification | dbSNP RS | HGVSc | HGVSp | HGVSp Short | SWISSPROT | BIOTYPE | SIFT | PolyPhen | Tumor Sample Barcode | Tissue | Histology | Sex | Age | Stage | Therapy Types | Drugs | Outcome |
| TUBA1B | SNV | Missense_Mutation | c.1345N>C | p.Glu449Gln | p.E449Q | P68363 | protein_coding | deleterious_low_confidence(0.03) | benign(0.403) | TCGA-A2-A0CX-01 | Breast | breast invasive carcinoma | Female | <65 | I/II | Chemotherapy | adriamycin | SD | |
| TUBA1B | SNV | Missense_Mutation | rs769034868 | c.785A>C | p.Tyr262Ser | p.Y262S | P68363 | protein_coding | deleterious_low_confidence(0.01) | benign(0.052) | TCGA-A2-A1G4-01 | Breast | breast invasive carcinoma | Female | >=65 | III/IV | Chemotherapy | adriamycin | SD |
| TUBA1B | SNV | Missense_Mutation | c.346N>C | p.Asp116His | p.D116H | P68363 | protein_coding | deleterious_low_confidence(0) | possibly_damaging(0.792) | TCGA-AO-A0J6-01 | Breast | breast invasive carcinoma | Female | <65 | I/II | Chemotherapy | doxorubicin | SD | |
| TUBA1B | SNV | Missense_Mutation | rs769034868 | c.785N>C | p.Tyr262Ser | p.Y262S | P68363 | protein_coding | deleterious_low_confidence(0.01) | benign(0.052) | TCGA-BH-A0HO-01 | Breast | breast invasive carcinoma | Female | <65 | I/II | Chemotherapy | cyclophosphamide | SD |
| TUBA1B | SNV | Missense_Mutation | rs769034868 | c.785A>C | p.Tyr262Ser | p.Y262S | P68363 | protein_coding | deleterious_low_confidence(0.01) | benign(0.052) | TCGA-C8-A273-01 | Breast | breast invasive carcinoma | Female | <65 | I/II | Hormone Therapy | tamoxiphen | SD |
| TUBA1B | SNV | Missense_Mutation | c.337N>C | p.Glu113Gln | p.E113Q | P68363 | protein_coding | deleterious_low_confidence(0.04) | benign(0.017) | TCGA-GM-A2DO-01 | Breast | breast invasive carcinoma | Female | <65 | I/II | Hormone Therapy | tamoxiphen | CR | |
| TUBA1B | insertion | Frame_Shift_Ins | novel | c.411_412insACAACTCC | p.Phe138ThrfsTer47 | p.F138Tfs*47 | P68363 | protein_coding | TCGA-A8-A06Q-01 | Breast | breast invasive carcinoma | Female | <65 | III/IV | Unknown | Unknown | SD | ||
| TUBA1B | SNV | Missense_Mutation | c.1348G>C | p.Glu450Gln | p.E450Q | P68363 | protein_coding | deleterious_low_confidence(0.05) | benign(0.003) | TCGA-FU-A3YQ-01 | Cervix | cervical & endocervical cancer | Female | <65 | I/II | Unknown | Unknown | SD | |
| TUBA1B | SNV | Missense_Mutation | c.922N>T | p.Arg308Cys | p.R308C | P68363 | protein_coding | deleterious_low_confidence(0) | probably_damaging(0.952) | TCGA-A6-6780-01 | Colorectum | colon adenocarcinoma | Male | >=65 | I/II | Unknown | Unknown | SD | |
| TUBA1B | SNV | Missense_Mutation | novel | c.367N>T | p.Arg123Cys | p.R123C | P68363 | protein_coding | deleterious_low_confidence(0) | possibly_damaging(0.794) | TCGA-AA-3984-01 | Colorectum | colon adenocarcinoma | Female | <65 | I/II | Unknown | Unknown | SD |
| Page: 1 2 3 4 |
Top |
Related drugs of malignant transformation related genes |
| Identification of chemicals and drugs interact with genes involved in malignant transfromation |
| (DGIdb 4.0) |
| Entrez ID | Symbol | Category | Interaction Types | Drug Claim Name | Drug Name | PMIDs |
| 10376 | TUBA1B | DRUGGABLE GENOME | inhibitor | CHEMBL538943 | VINORELBINE TARTRATE | |
| 10376 | TUBA1B | DRUGGABLE GENOME | PACLITAXEL | PACLITAXEL | 23631389,25369367,25768699,24457094,22595423,23313639,17887662,23387901,19758808,23725535,24953821 | |
| 10376 | TUBA1B | DRUGGABLE GENOME | MAYTANSINOL | MAYTANSINOL | 563462 | |
| 10376 | TUBA1B | DRUGGABLE GENOME | inhibitor | CHEMBL1201748 | CABAZITAXEL | |
| 10376 | TUBA1B | DRUGGABLE GENOME | inhibitor | CHEMBL289351 | FOSBRETABULIN DISODIUM | |
| 10376 | TUBA1B | DRUGGABLE GENOME | VORINOSTAT | VORINOSTAT | 20491440 | |
| 10376 | TUBA1B | DRUGGABLE GENOME | inhibitor | CHEMBL3545252 | DOCETAXEL | |
| 10376 | TUBA1B | DRUGGABLE GENOME | COLCHICINE | COLCHICINE | 23750455,25805446,24502232,25061803,25937236,24773591,25938266 | |
| 10376 | TUBA1B | DRUGGABLE GENOME | COMBRETASTATIN A4 | COMBRETASTATIN A4 | 23631389,16913727,22543234,25584687,24669888,17765552,25192811 | |
| 10376 | TUBA1B | DRUGGABLE GENOME | CHEMBL2105643 | FOSBRETABULIN TROMETHAMINE |
| Page: 1 2 3 4 5 |

Copyright 2023-Present -The University of Texas Health Science Center at Houston |