
|
|||||
|
 | |
| |
| |
| |
| |
| |
|
Gene: TTTY14 |
Gene summary for TTTY14 |
| Gene information | Species | Human | Gene symbol | TTTY14 | Gene ID | 83869 |
| Gene name | testis-specific transcript, Y-linked 14 | |
| Gene Alias | CYorf14 | |
| Cytomap | Yq11.222 | |
| Gene Type | ncRNA | GO ID | NA | UniProtAcc | NA |
Top |
Malignant transformation analysis |
| Identification of the aberrant gene expression in precancerous and cancerous lesions by comparing the gene expression of stem-like cells in diseased tissues with normal stem cells |
| Entrez ID | Symbol | Replicates | Species | Organ | Tissue | Adj P-value | Log2FC | Malignancy |
| 83869 | TTTY14 | Pat06-B | Human | Stomach | GC | 9.14e-43 | 5.73e-01 | -0.1961 |
| 83869 | TTTY14 | Pat07-B | Human | Stomach | GC | 2.56e-09 | 4.76e-01 | 0.0935 |
| 83869 | TTTY14 | Pat12-B | Human | Stomach | GC | 5.87e-36 | 6.78e-01 | 0.0325 |
| 83869 | TTTY14 | Pat13-B | Human | Stomach | GC | 1.68e-03 | 2.02e-01 | 0.0555 |
| 83869 | TTTY14 | Pat15-B | Human | Stomach | GC | 2.43e-43 | 8.64e-01 | -0.0778 |
| 83869 | TTTY14 | Pat16-B | Human | Stomach | GC | 2.56e-10 | 2.89e-01 | 0.1918 |
| 83869 | TTTY14 | Pat18-B | Human | Stomach | GC | 2.48e-21 | 4.50e-01 | -0.0432 |
| 83869 | TTTY14 | Pat19-B | Human | Stomach | GC | 5.37e-04 | 2.58e-01 | 0.0826 |
| 83869 | TTTY14 | Pat22-B | Human | Stomach | GC | 1.55e-24 | 3.57e-01 | -0.1042 |
| 83869 | TTTY14 | Pat28-A | Human | Stomach | CSG | 3.27e-26 | 6.09e-01 | -0.2594 |
| 83869 | TTTY14 | Adj_PTCwithHT_8 | Human | Thyroid | HT | 2.99e-13 | 6.89e-01 | 0.0267 |
| 83869 | TTTY14 | PTCwithHT_8 | Human | Thyroid | HT | 7.43e-16 | 6.43e-01 | 0.0351 |
| 83869 | TTTY14 | PTCwithoutHT_2 | Human | Thyroid | PTC | 5.43e-04 | 3.36e-01 | 0.0419 |
| 83869 | TTTY14 | PTCwithoutHT_7 | Human | Thyroid | PTC | 2.12e-02 | 4.45e-01 | 0.0381 |
| 83869 | TTTY14 | male-WTA | Human | Thyroid | PTC | 4.82e-02 | 8.66e-02 | 0.1037 |
| 83869 | TTTY14 | PTC03 | Human | Thyroid | PTC | 3.54e-03 | 1.72e-01 | 0.1784 |
| 83869 | TTTY14 | PTC06 | Human | Thyroid | PTC | 1.18e-11 | 2.98e-01 | 0.2057 |
| Page: 1 2 3 4 5 |
| Tissue | Expression Dynamics | Abbreviation |
| Colorectum (GSE201348) |  | FAP: Familial adenomatous polyposis |
| CRC: Colorectal cancer | ||
| Colorectum (HTA11) |  | AD: Adenomas |
| SER: Sessile serrated lesions | ||
| MSI-H: Microsatellite-high colorectal cancer | ||
| MSS: Microsatellite stable colorectal cancer | ||
| Endometrium |  | AEH: Atypical endometrial hyperplasia |
| EEC: Endometrioid Cancer | ||
| GC | 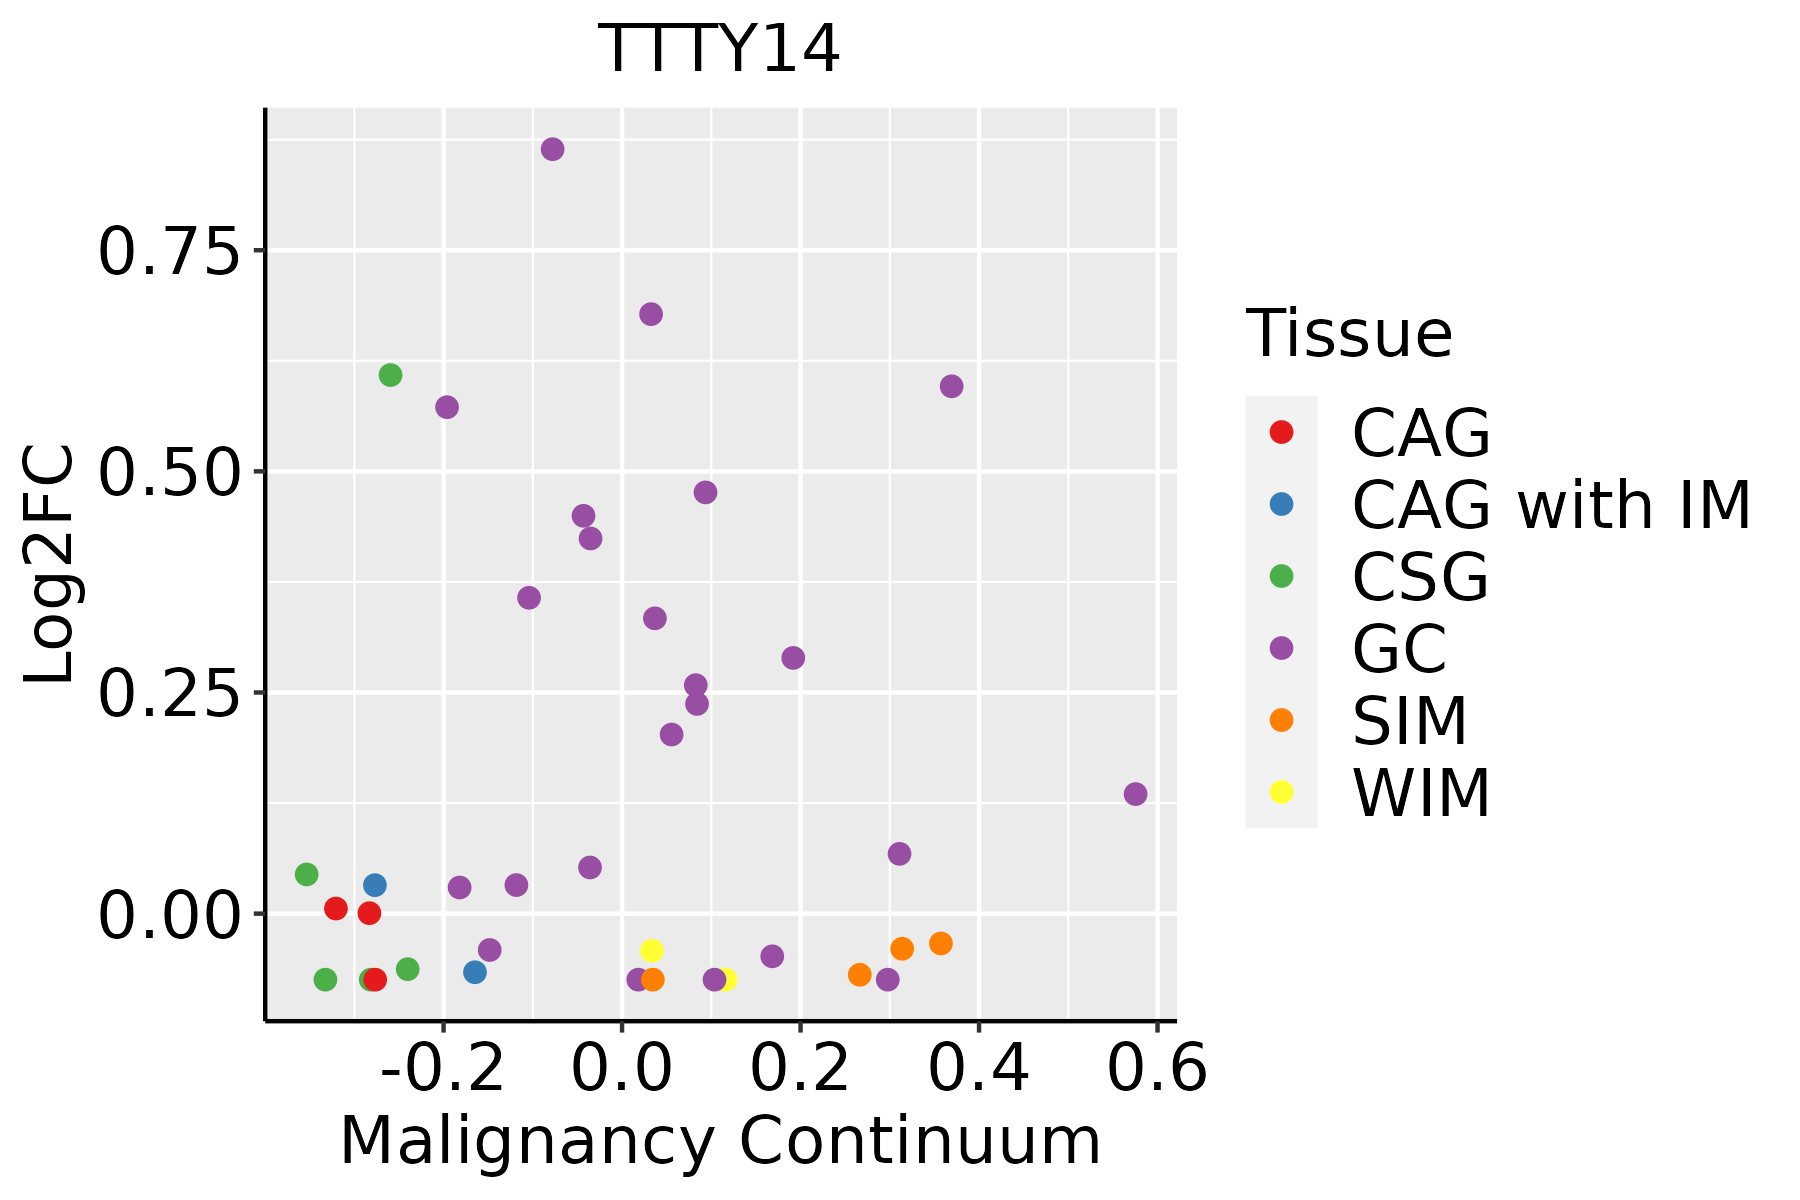 | CAG: Chronic atrophic gastritis |
| CAG with IM: Chronic atrophic gastritis with intestinal metaplasia | ||
| CSG: Chronic superficial gastritis | ||
| GC: Gastric cancer | ||
| SIM: Severe intestinal metaplasia | ||
| WIM: Wild intestinal metaplasia | ||
| Lung | 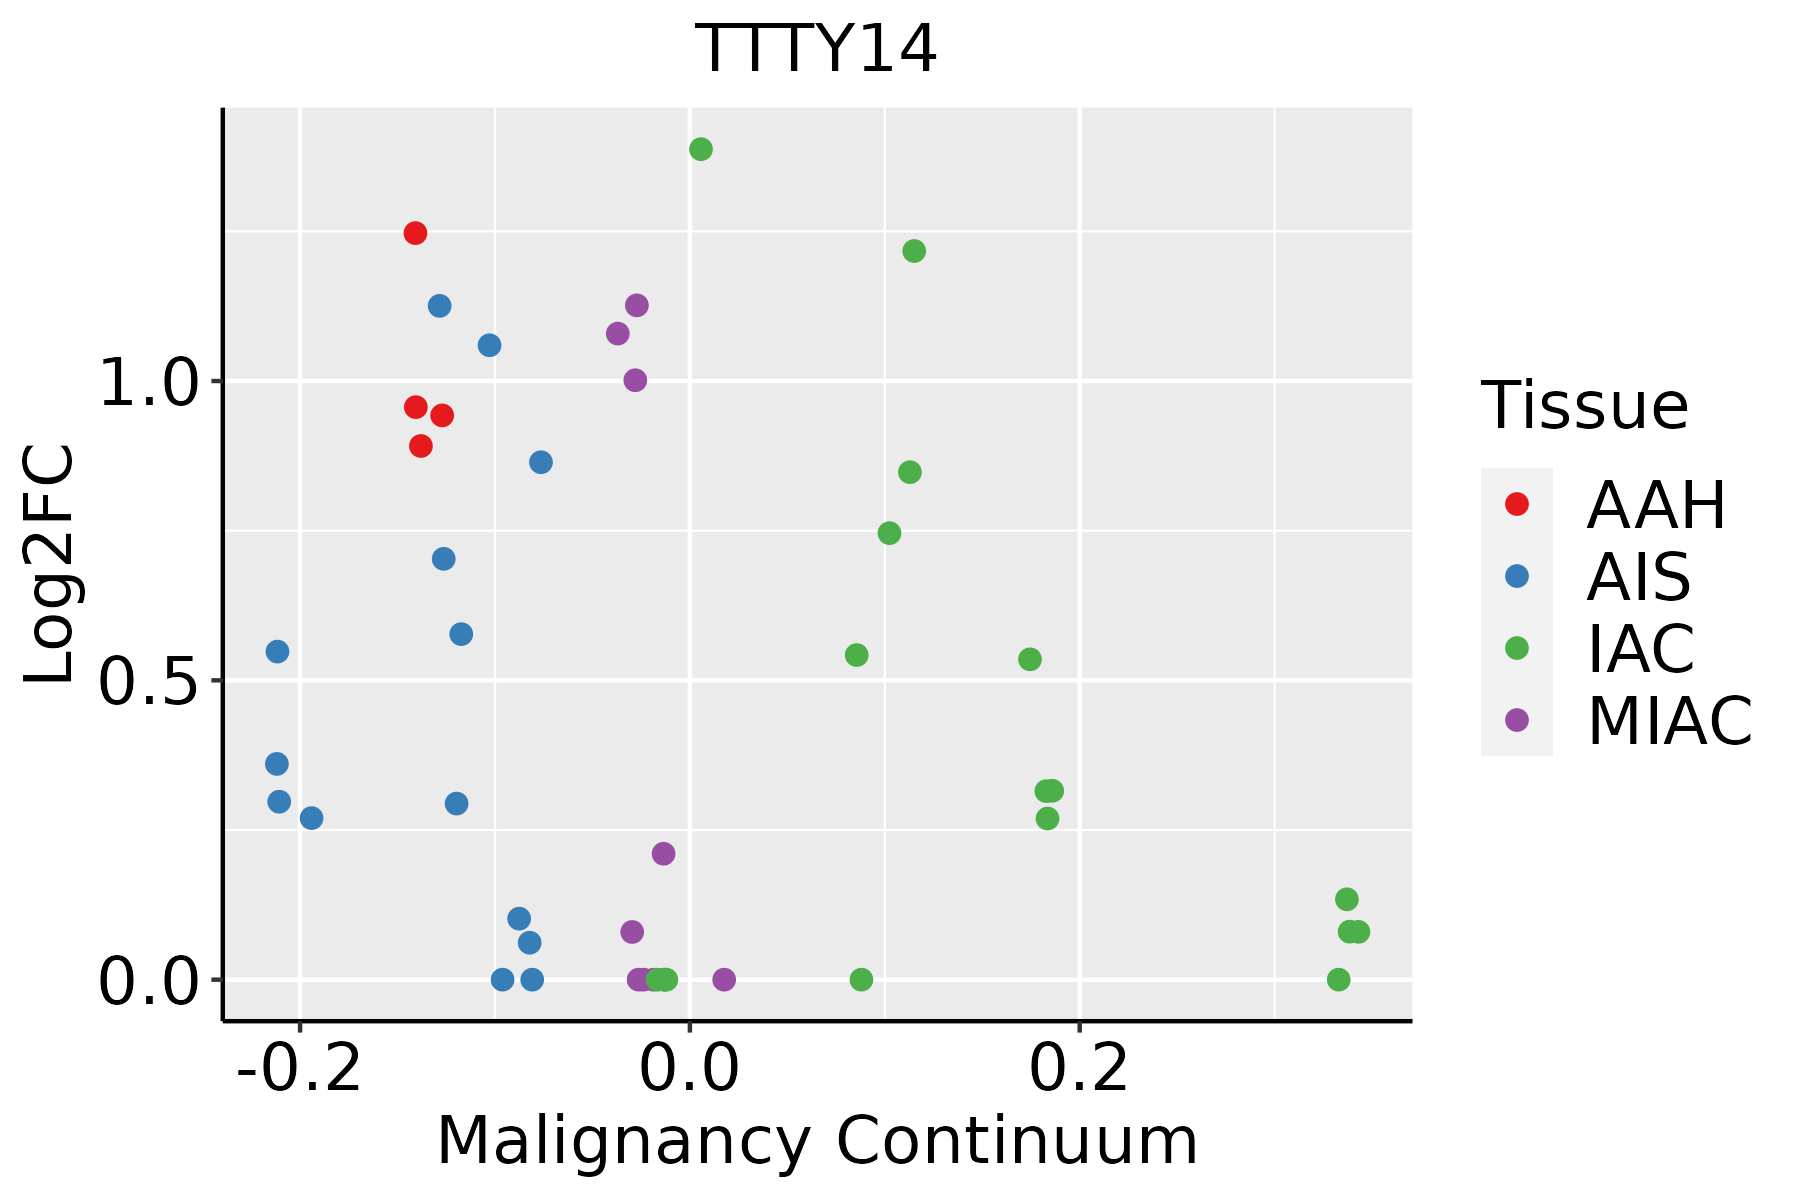 | AAH: Atypical adenomatous hyperplasia |
| AIS: Adenocarcinoma in situ | ||
| IAC: Invasive lung adenocarcinoma | ||
| MIA: Minimally invasive adenocarcinoma | ||
| Prostate |  | BPH: Benign Prostatic Hyperplasia |
| Thyroid | 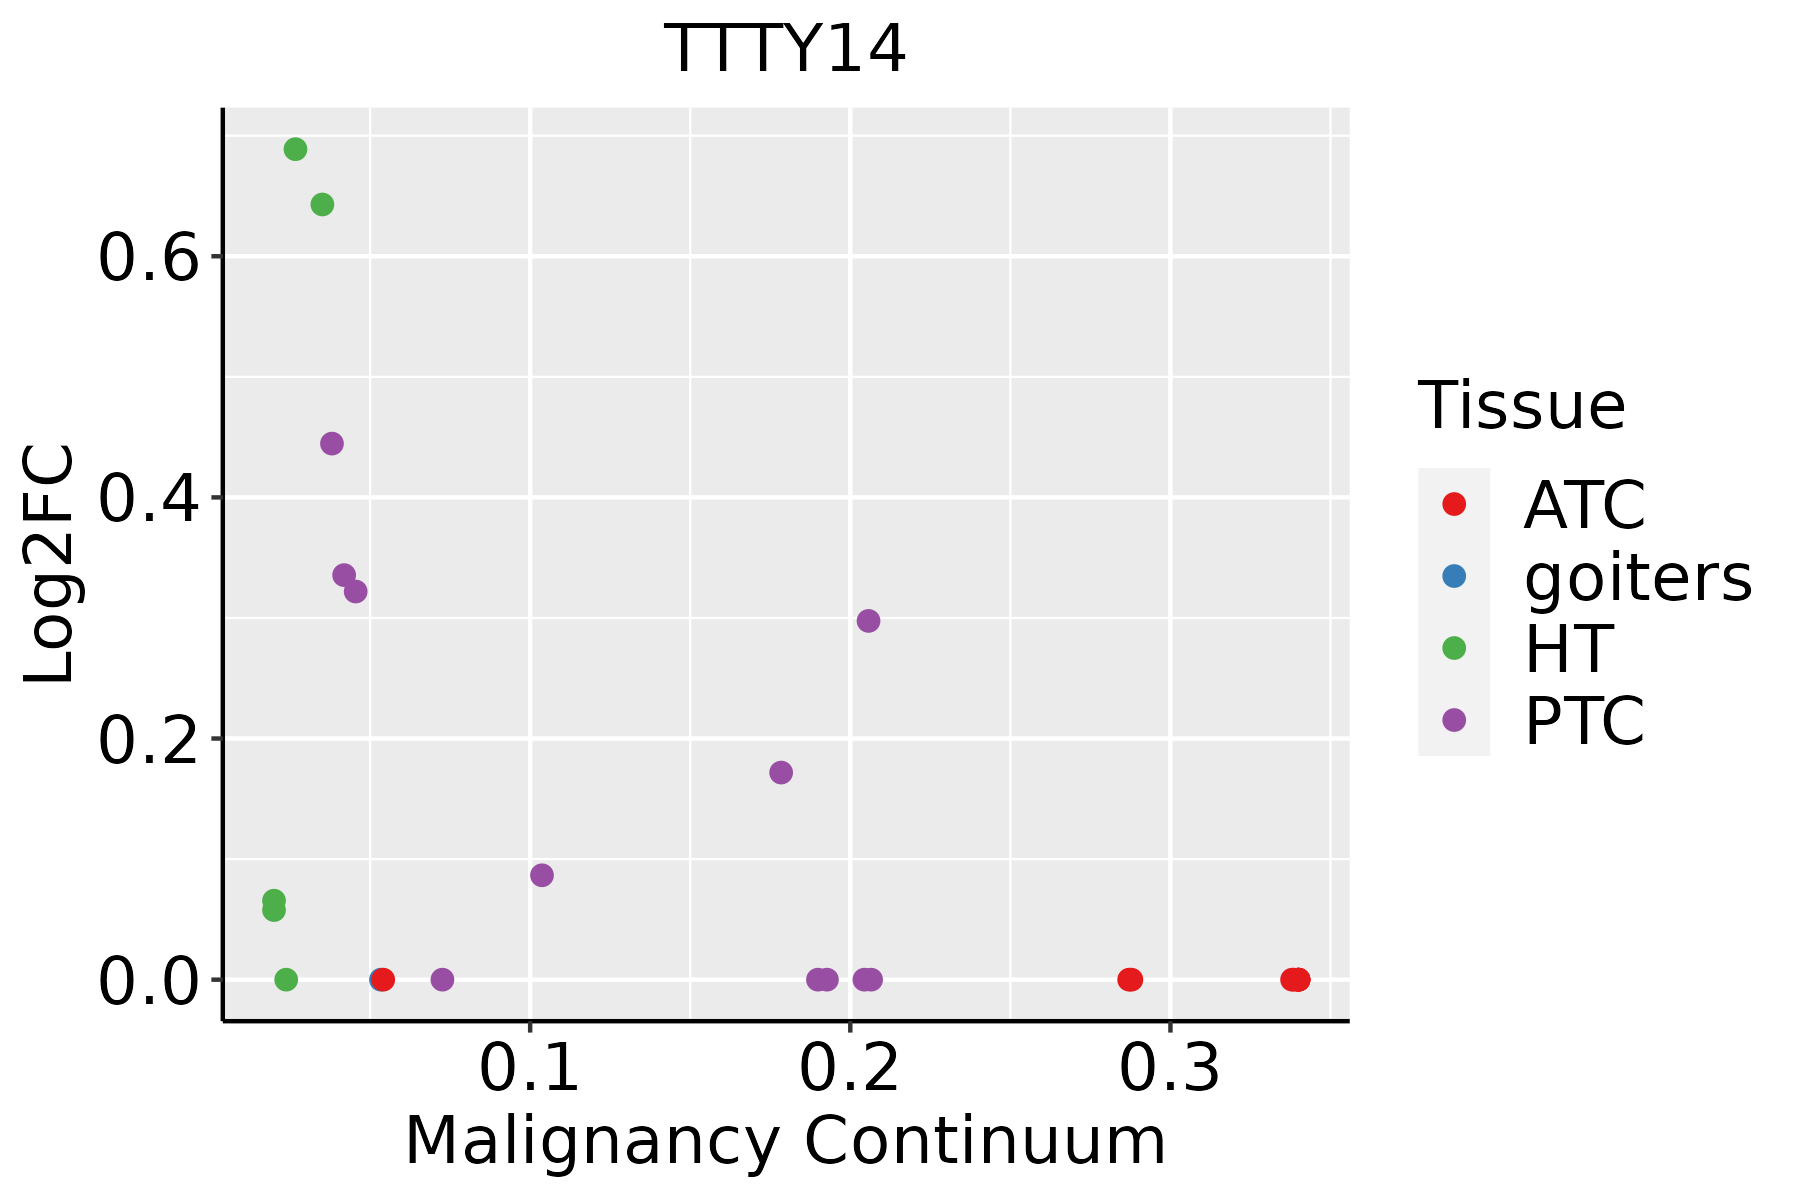 | ATC: Anaplastic thyroid cancer |
| HT: Hashimoto's thyroiditis | ||
| PTC: Papillary thyroid cancer |
| ∗log2FC in expression of this searched gene in stem-like cells from each diseased tissue sample relative to stem-like cells in normal samples in each tissue plotted against the malignancy continuum. Samples are colored based on if they are from different disease stage. |
Top |
Malignant transformation related pathway analysis |
| Find out the enriched GO biological processes and KEGG pathways involved in transition from healthy to precancer to cancer |
| Tissue | Disease Stage | Enriched GO biological Processes |
| Colorectum | AD |  |
| Colorectum | SER |  |
| Colorectum | MSS |  |
| Colorectum | MSI-H |  |
| Colorectum | FAP |  |
| ∗Top 15 enriched GO BP terms are showed in the bar plot of each disease state in each tissue. Each row represents a significant GO biological process which is colored according to the -log10(p.adjust). |
| Page: 1 2 3 4 5 6 7 8 9 |
| GO ID | Tissue | Disease Stage | Description | Gene Ratio | Bg Ratio | pvalue | p.adjust | Count |
| Page: 1 |
| Pathway ID | Tissue | Disease Stage | Description | Gene Ratio | Bg Ratio | pvalue | p.adjust | qvalue | Count |
| Page: 1 |
Top |
Cell-cell communication analysis |
| Identification of potential cell-cell interactions between two cell types and their ligand-receptor pairs for different disease states |
| Ligand | Receptor | LRpair | Pathway | Tissue | Disease Stage |
| Page: 1 |
Top |
Single-cell gene regulatory network inference analysis |
| Find out the significant the regulons (TFs) and the target genes of each regulon across cell types for different disease states |
| TF | Cell Type | Tissue | Disease Stage | Target Gene | RSS | Regulon Activity |
| ∗The dot plots of a searched regulon are shown for all cell subpopulations in each disease state of each tissue based on the regulon specific score inferred using pySCENIC and by calculating the average expression. |
| Page: 1 |
Top |
Somatic mutation of malignant transformation related genes |
| Annotation of somatic variants for genes involved in malignant transformation |
| Hugo Symbol | Variant Class | Variant Classification | dbSNP RS | HGVSc | HGVSp | HGVSp Short | SWISSPROT | BIOTYPE | SIFT | PolyPhen | Tumor Sample Barcode | Tissue | Histology | Sex | Age | Stage | Therapy Types | Drugs | Outcome |
| Page: 1 |
Top |
Related drugs of malignant transformation related genes |
| Identification of chemicals and drugs interact with genes involved in malignant transfromation |
| (DGIdb 4.0) |
| Entrez ID | Symbol | Category | Interaction Types | Drug Claim Name | Drug Name | PMIDs |
| Page: 1 |

Copyright 2023-Present -The University of Texas Health Science Center at Houston |