
|
|||||
|
 | |
| |
| |
| |
| |
| |
|
Gene: TTC28 |
Gene summary for TTC28 |
| Gene information | Species | Human | Gene symbol | TTC28 | Gene ID | 23331 |
| Gene name | tetratricopeptide repeat domain 28 | |
| Gene Alias | TPRBK | |
| Cytomap | 22q12.1 | |
| Gene Type | protein-coding | GO ID | GO:0000278 | UniProtAcc | Q96AY4 |
Top |
Malignant transformation analysis |
| Identification of the aberrant gene expression in precancerous and cancerous lesions by comparing the gene expression of stem-like cells in diseased tissues with normal stem cells |
| Entrez ID | Symbol | Replicates | Species | Organ | Tissue | Adj P-value | Log2FC | Malignancy |
| 23331 | TTC28 | RNA-P6T2-P6T2-2 | Human | Lung | IAC | 1.86e-37 | 1.03e+00 | -0.0132 |
| 23331 | TTC28 | RNA-P6T2-P6T2-3 | Human | Lung | IAC | 1.66e-41 | 1.06e+00 | -0.013 |
| 23331 | TTC28 | RNA-P6T2-P6T2-4 | Human | Lung | IAC | 5.63e-33 | 9.81e-01 | -0.0121 |
| 23331 | TTC28 | RNA-P7T1-P7T1-1 | Human | Lung | AIS | 1.12e-09 | 8.37e-01 | -0.0961 |
| 23331 | TTC28 | RNA-P7T1-P7T1-2 | Human | Lung | AIS | 2.45e-08 | 7.60e-01 | -0.0876 |
| 23331 | TTC28 | RNA-P7T1-P7T1-3 | Human | Lung | AIS | 4.04e-09 | 8.90e-01 | -0.0822 |
| 23331 | TTC28 | RNA-P7T1-P7T1-4 | Human | Lung | AIS | 3.16e-10 | 7.77e-01 | -0.0809 |
| 23331 | TTC28 | EOLP-1 | Human | Oral cavity | EOLP | 1.23e-21 | 6.21e-01 | -0.0202 |
| 23331 | TTC28 | EOLP-2 | Human | Oral cavity | EOLP | 4.68e-08 | 4.28e-01 | -0.0203 |
| 23331 | TTC28 | NEOLP-1 | Human | Oral cavity | NEOLP | 1.44e-19 | 7.25e-01 | -0.0194 |
| 23331 | TTC28 | NEOLP-2 | Human | Oral cavity | NEOLP | 4.20e-18 | 5.78e-01 | -0.0196 |
| 23331 | TTC28 | NEOLP-3 | Human | Oral cavity | NEOLP | 3.02e-16 | 5.02e-01 | -0.0191 |
| 23331 | TTC28 | HTA12-15-2 | Human | Pancreas | PDAC | 4.09e-08 | 5.42e-01 | 0.2315 |
| 23331 | TTC28 | HTA12-16-2 | Human | Pancreas | PDAC | 1.71e-02 | 7.20e-01 | 0.0535 |
| 23331 | TTC28 | HTA12-18-3 | Human | Pancreas | PDAC | 4.07e-03 | 4.92e-01 | 0.0716 |
| 23331 | TTC28 | HTA12-23-1 | Human | Pancreas | PDAC | 2.93e-09 | 8.32e-01 | 0.3405 |
| 23331 | TTC28 | HTA12-25-1 | Human | Pancreas | PDAC | 1.03e-14 | 8.20e-01 | 0.313 |
| 23331 | TTC28 | HTA12-26-1 | Human | Pancreas | PDAC | 5.15e-30 | 1.01e+00 | 0.3728 |
| 23331 | TTC28 | HTA12-29-1 | Human | Pancreas | PDAC | 2.65e-61 | 1.11e+00 | 0.3722 |
| 23331 | TTC28 | HTA12-32-1 | Human | Pancreas | PDAC | 4.65e-02 | 6.19e-01 | 0.3624 |
| Page: 1 2 3 4 5 6 |
| Tissue | Expression Dynamics | Abbreviation |
| Cervix | 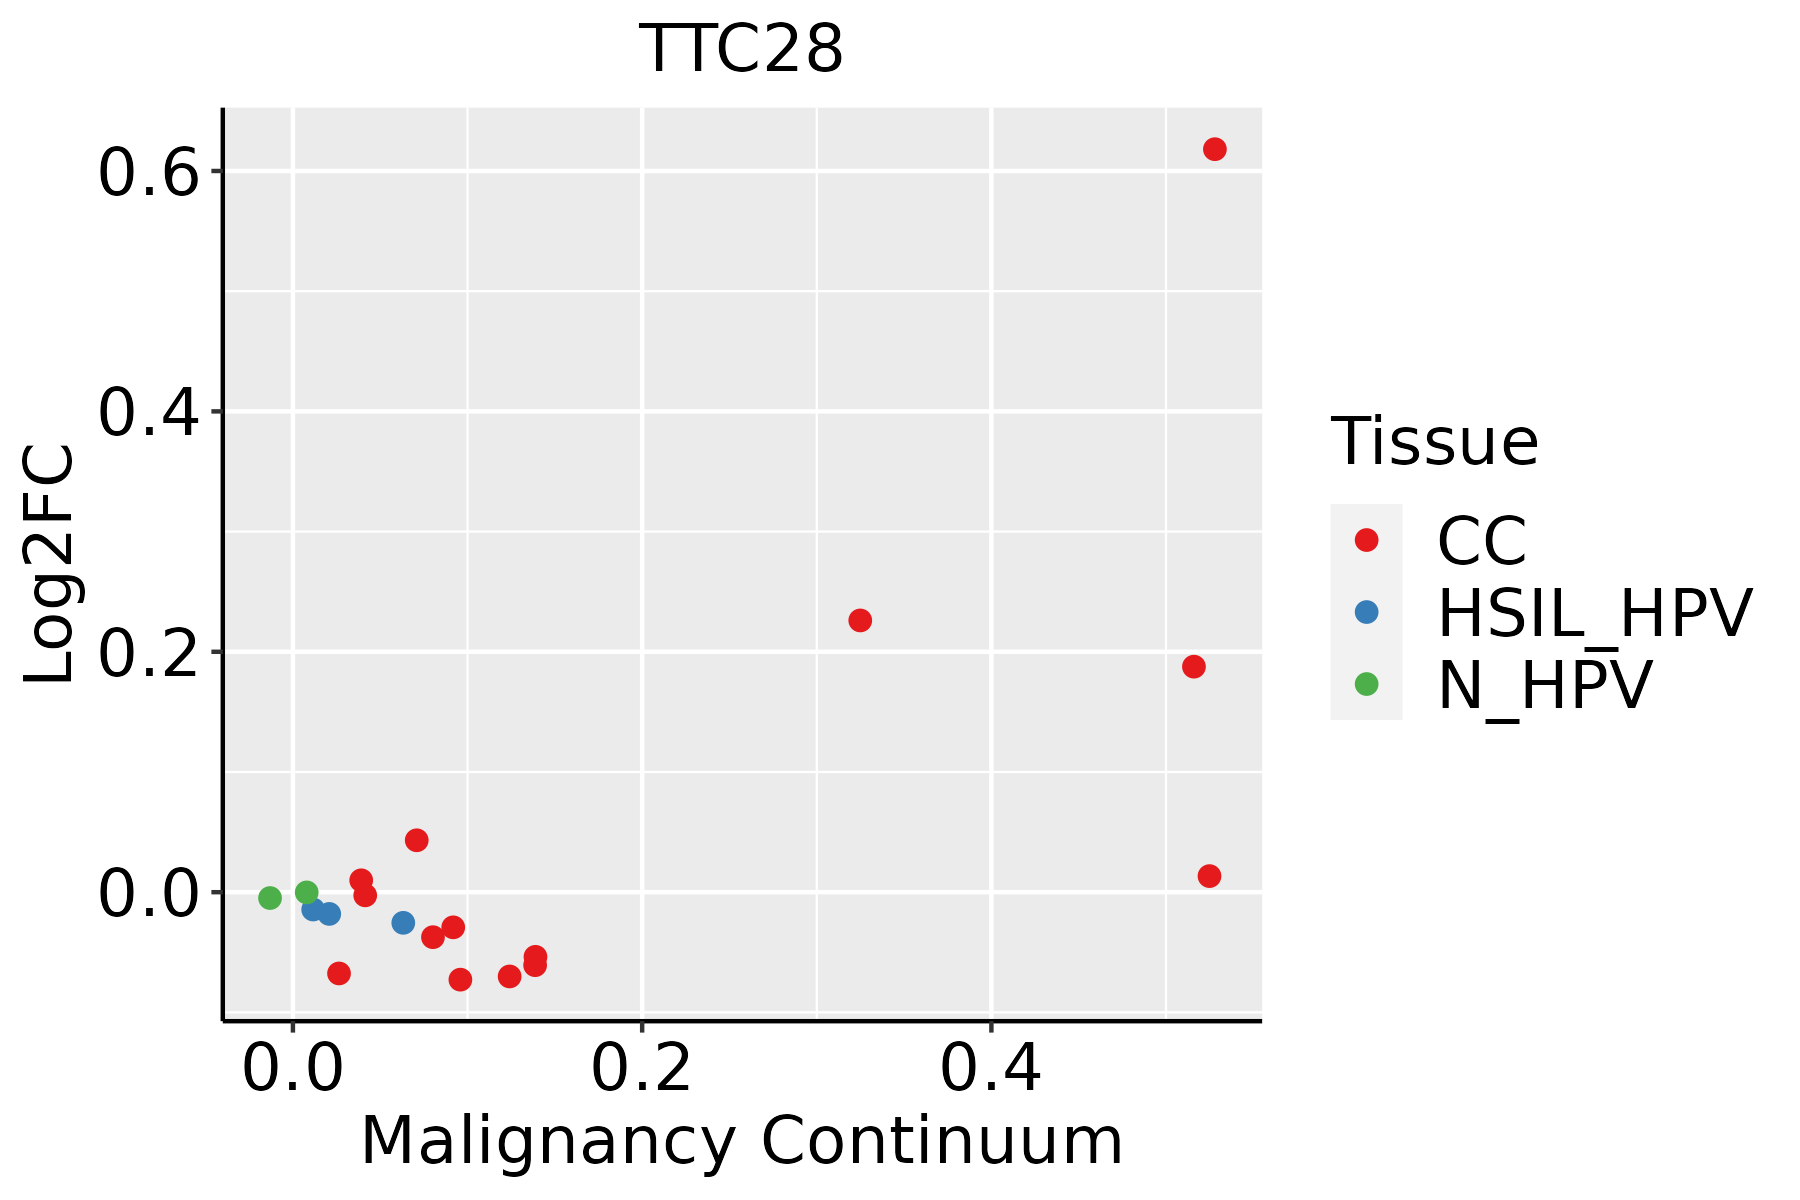 | CC: Cervix cancer |
| HSIL_HPV: HPV-infected high-grade squamous intraepithelial lesions | ||
| N_HPV: HPV-infected normal cervix | ||
| Endometrium | 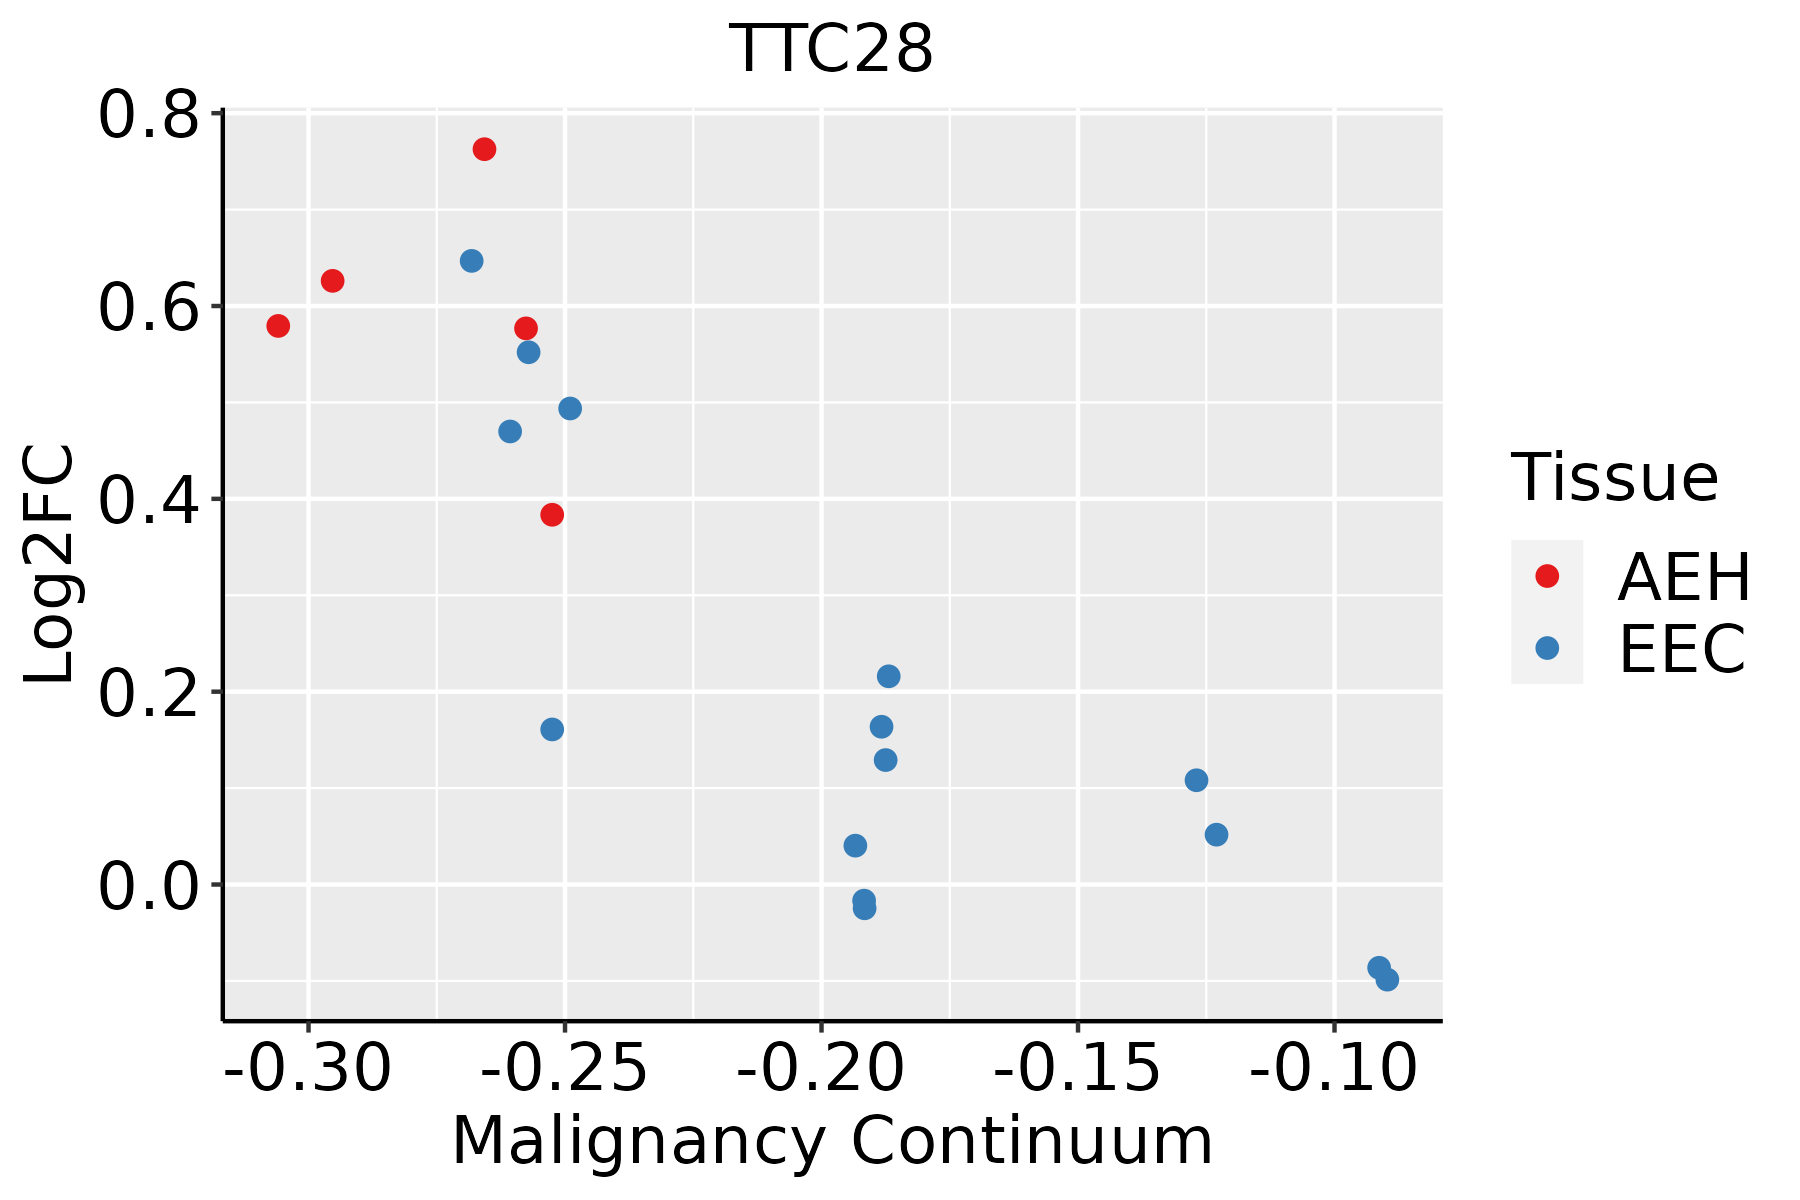 | AEH: Atypical endometrial hyperplasia |
| EEC: Endometrioid Cancer | ||
| Esophagus | 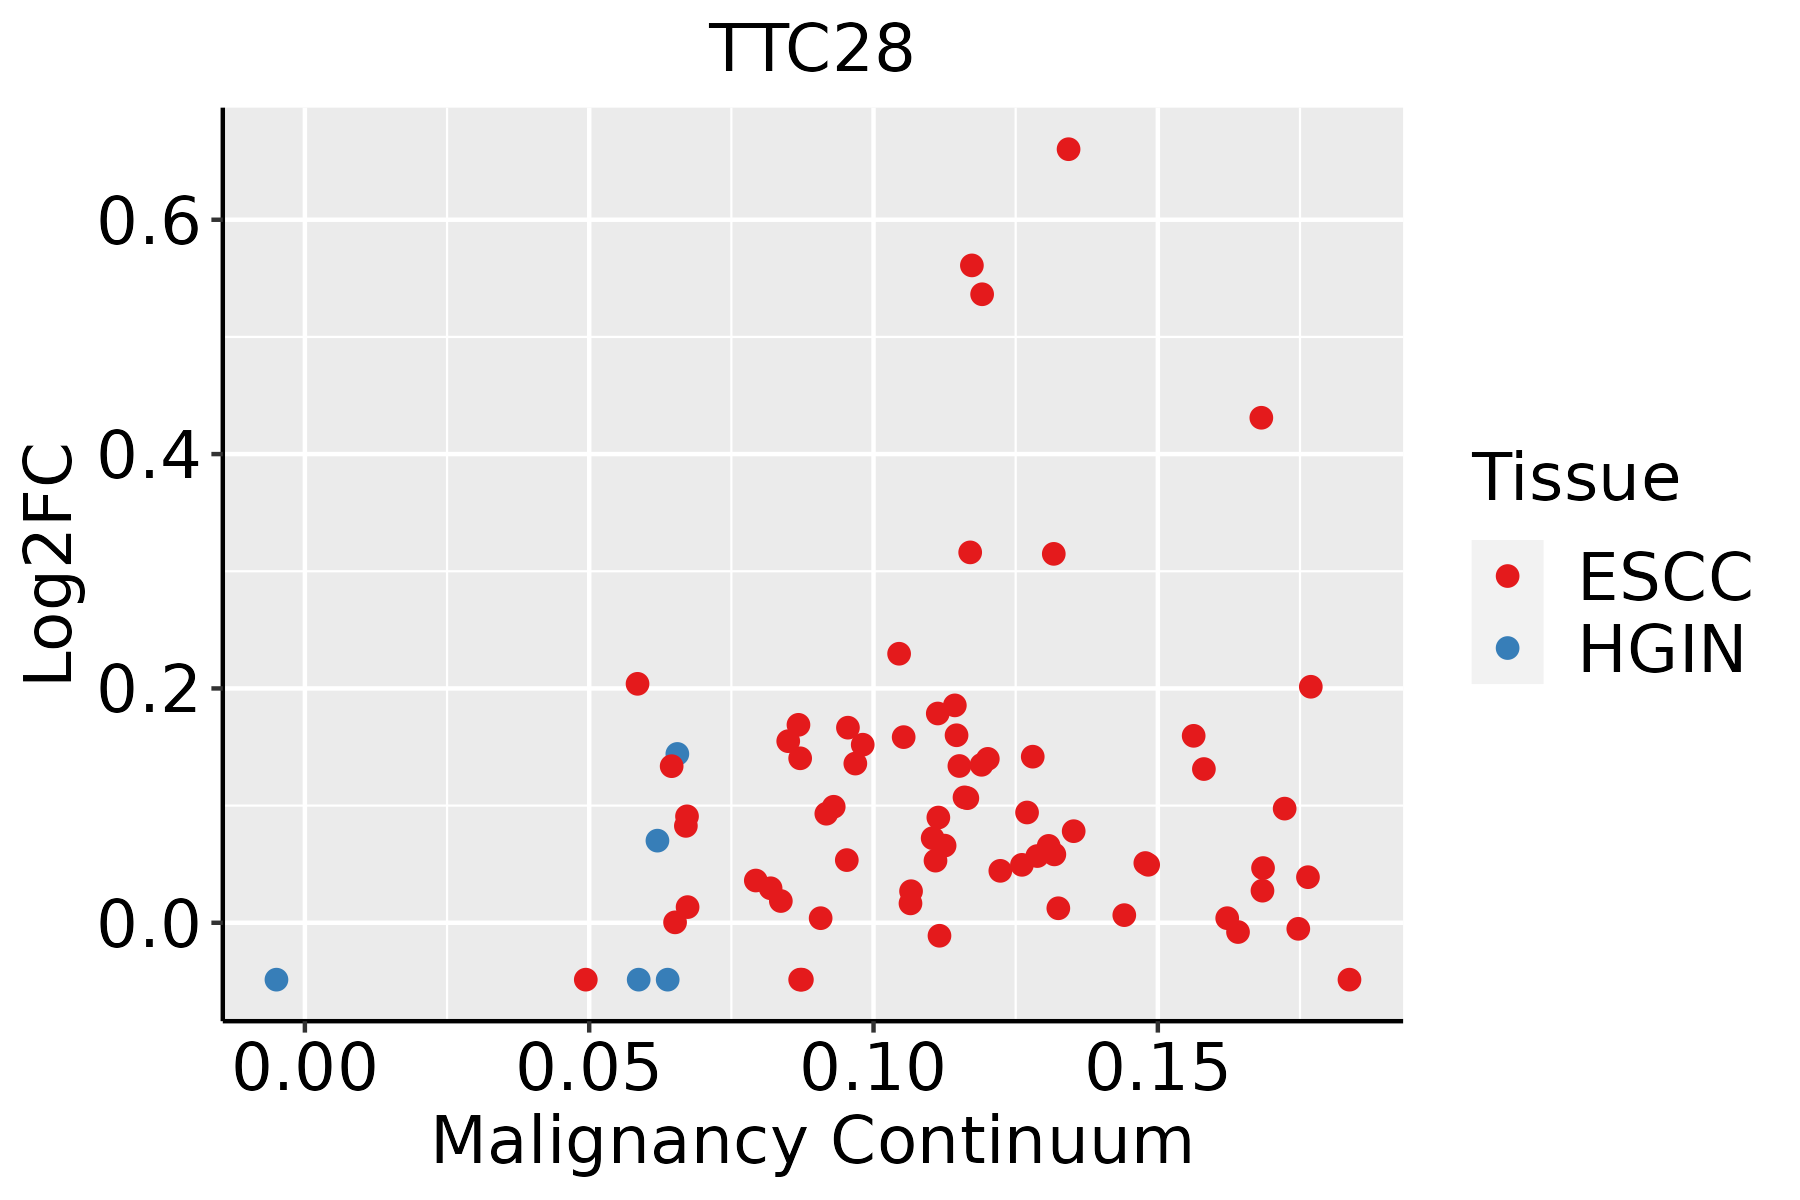 | ESCC: Esophageal squamous cell carcinoma |
| HGIN: High-grade intraepithelial neoplasias | ||
| LGIN: Low-grade intraepithelial neoplasias | ||
| Liver |  | HCC: Hepatocellular carcinoma |
| NAFLD: Non-alcoholic fatty liver disease | ||
| Lung | 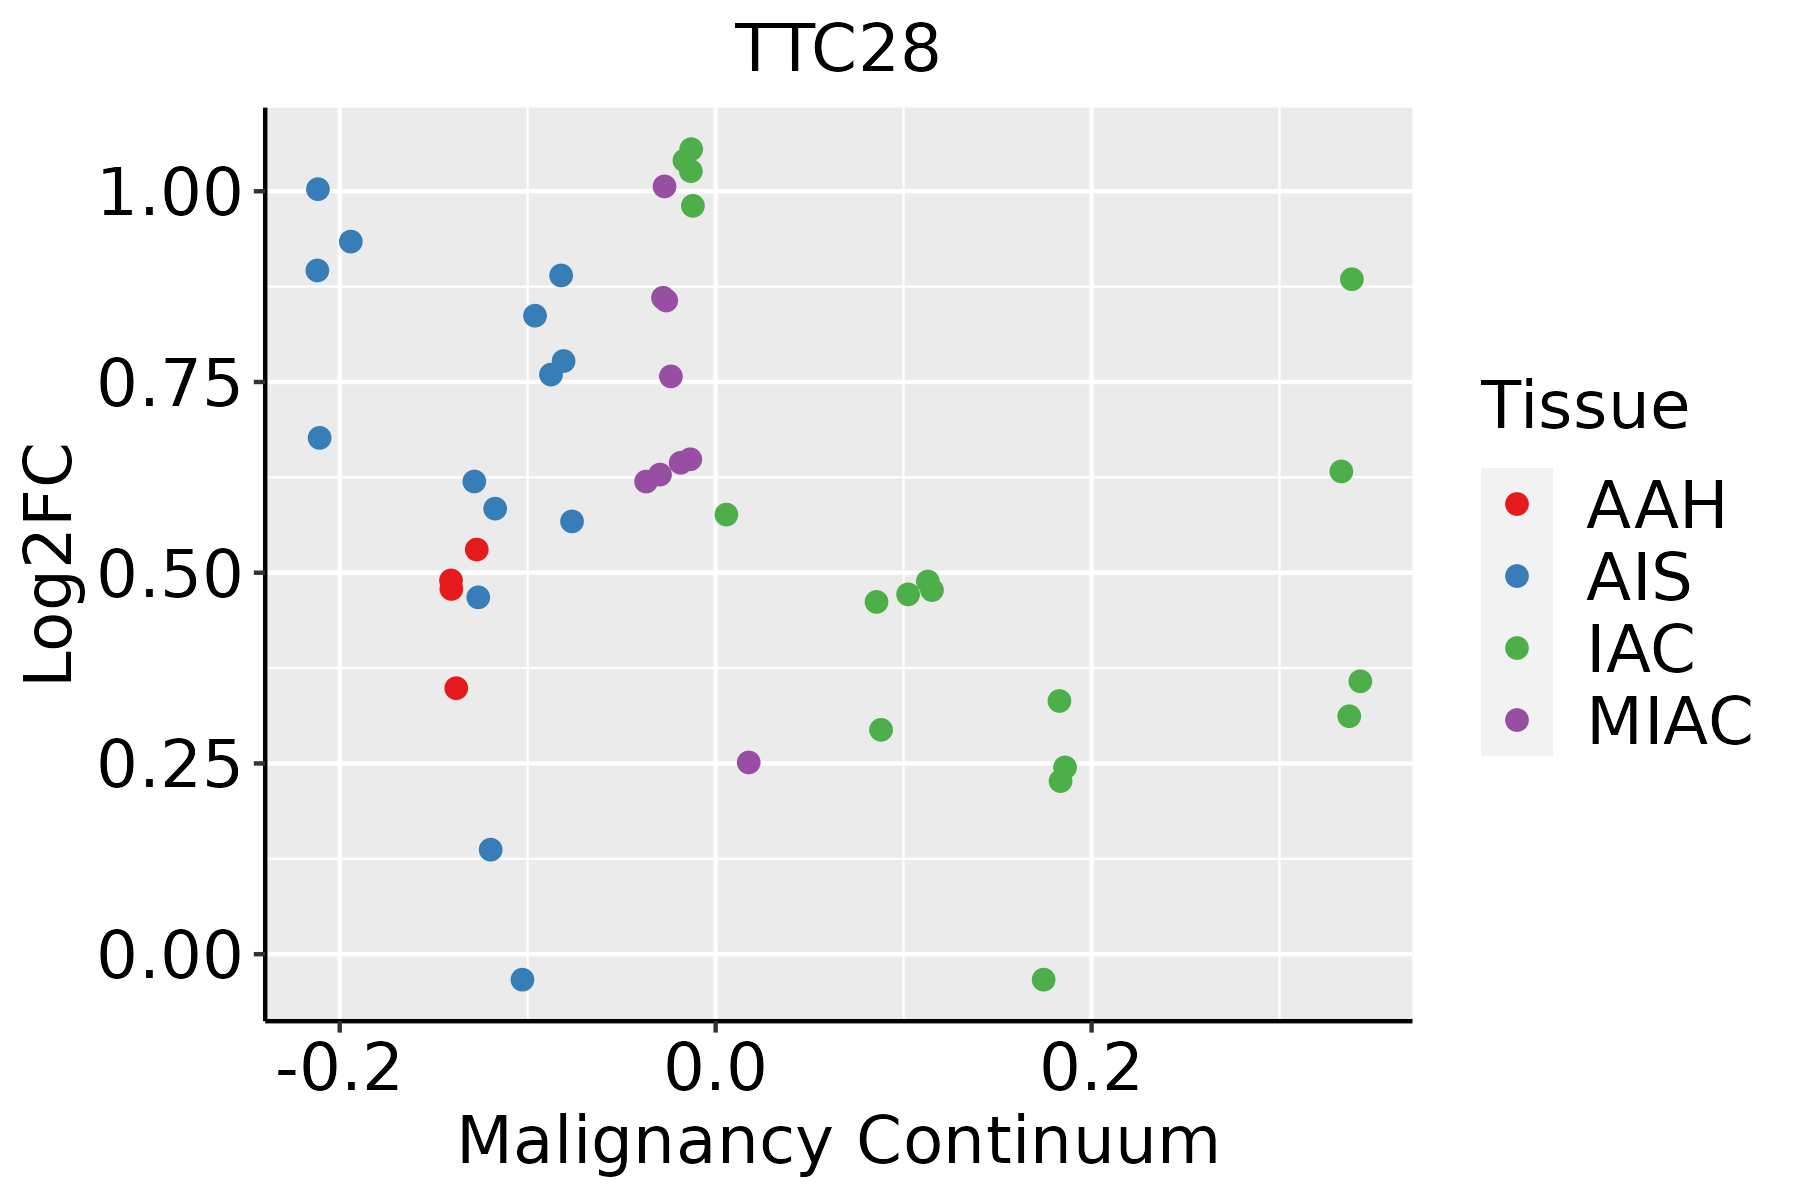 | AAH: Atypical adenomatous hyperplasia |
| AIS: Adenocarcinoma in situ | ||
| IAC: Invasive lung adenocarcinoma | ||
| MIA: Minimally invasive adenocarcinoma | ||
| Oral Cavity | 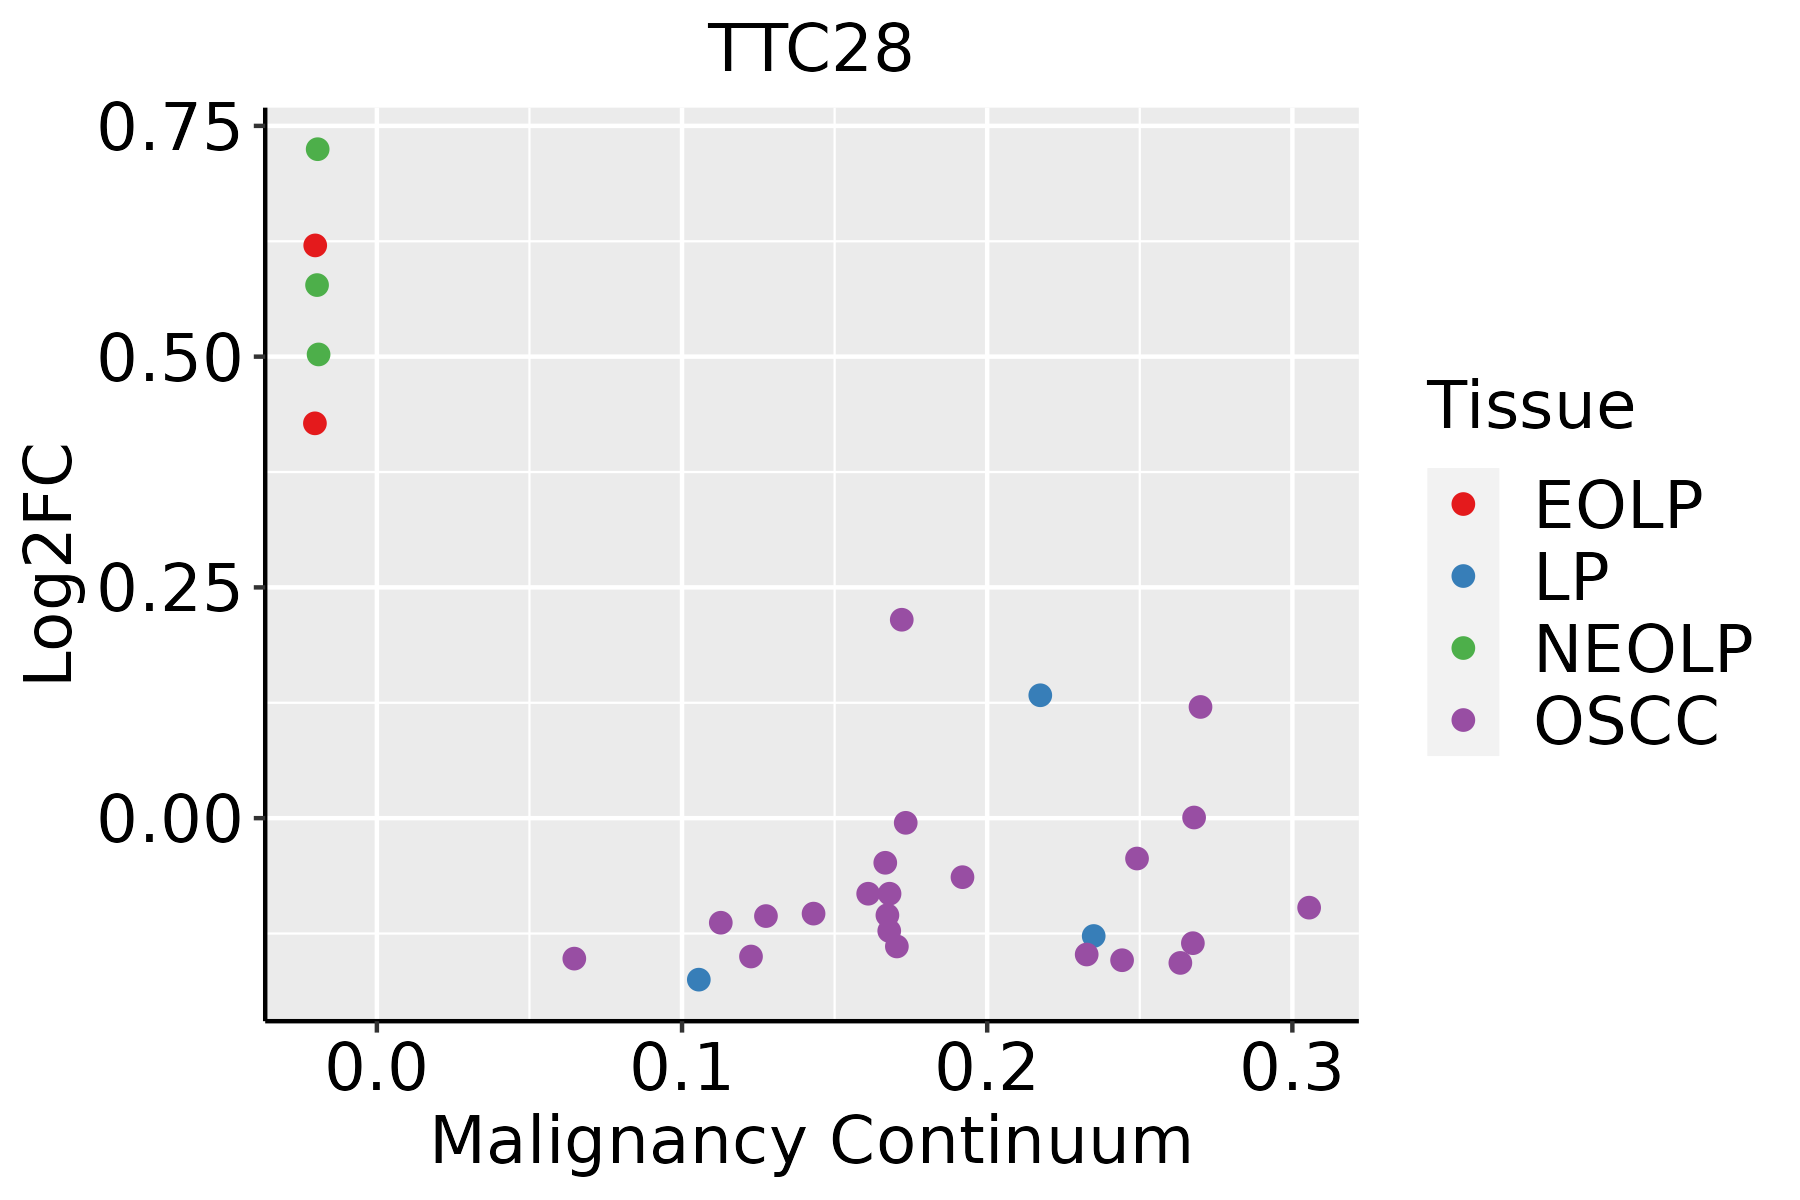 | EOLP: Erosive Oral lichen planus |
| LP: leukoplakia | ||
| NEOLP: Non-erosive oral lichen planus | ||
| OSCC: Oral squamous cell carcinoma | ||
| Prostate | 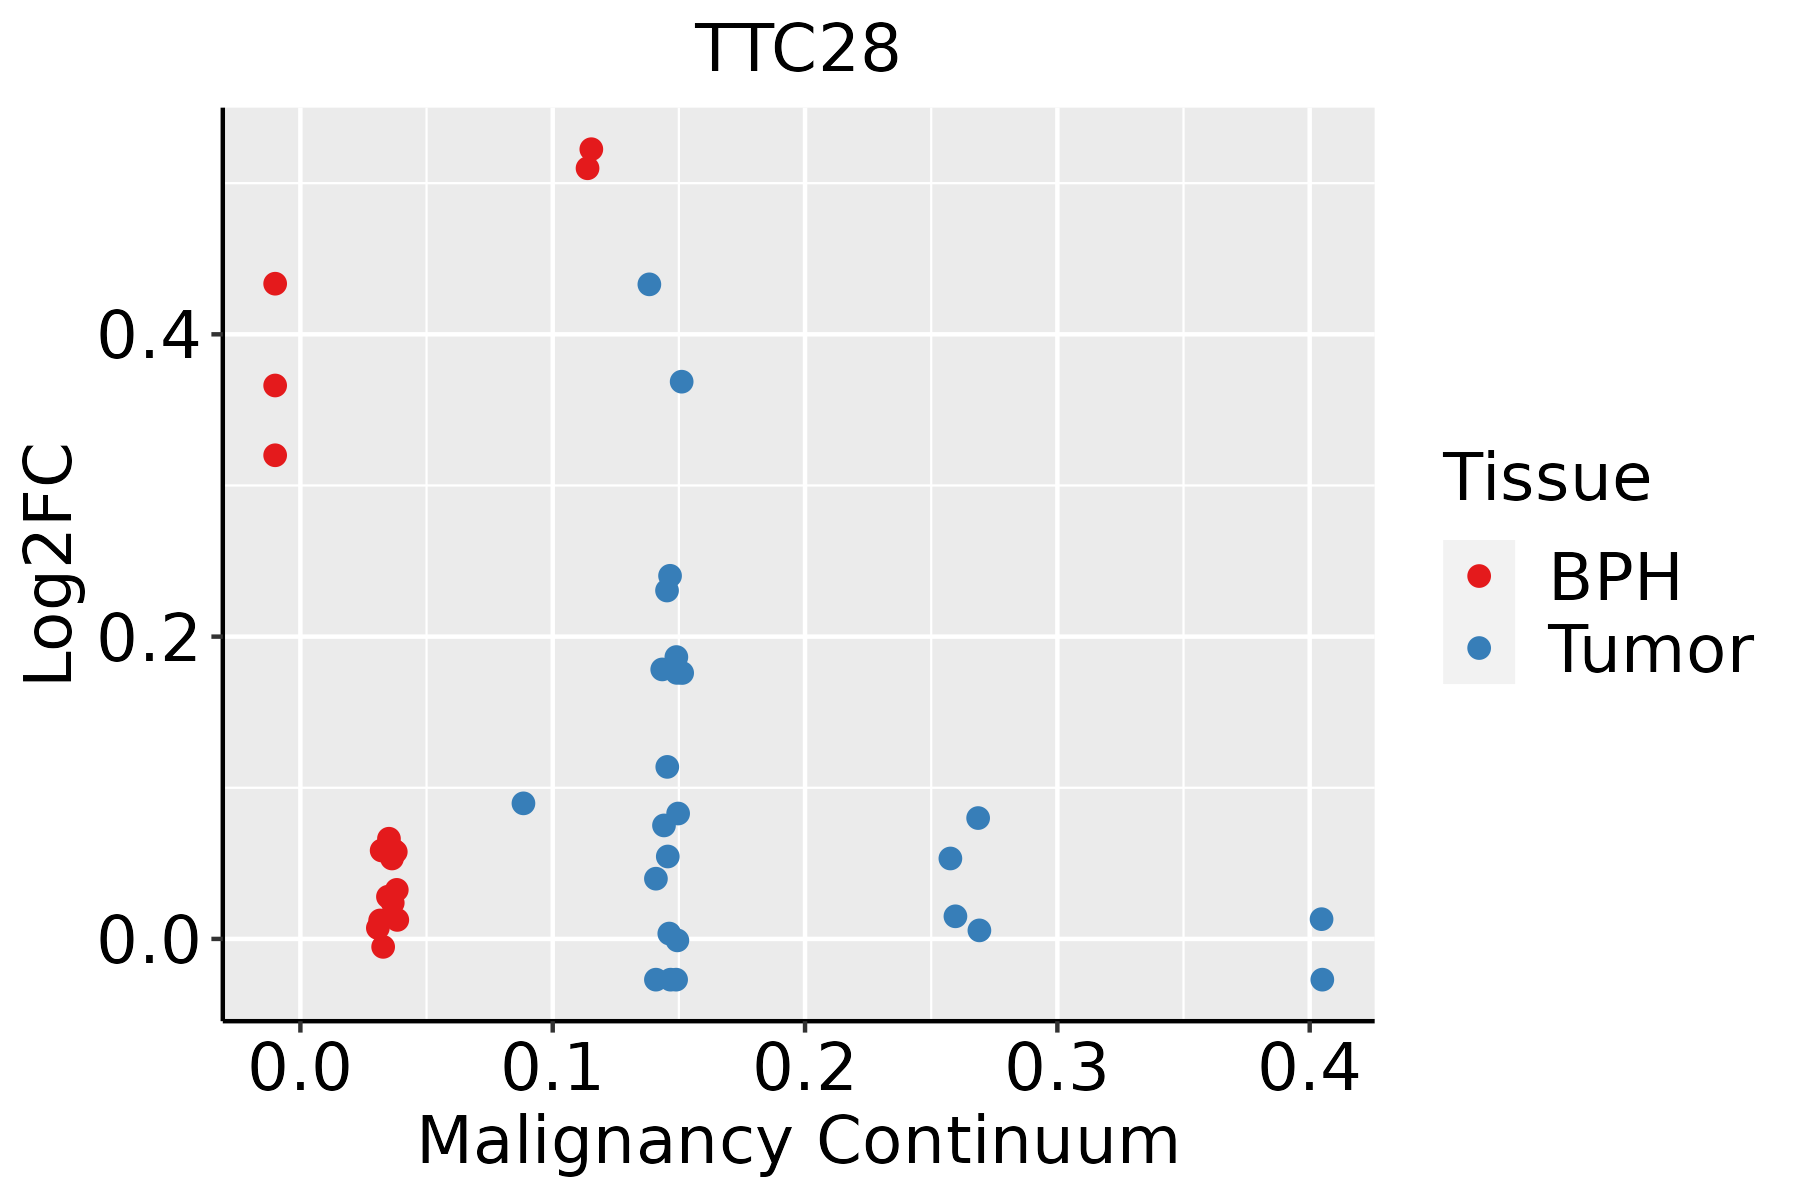 | BPH: Benign Prostatic Hyperplasia |
| ∗log2FC in expression of this searched gene in stem-like cells from each diseased tissue sample relative to stem-like cells in normal samples in each tissue plotted against the malignancy continuum. Samples are colored based on if they are from different disease stage. |
Top |
Malignant transformation related pathway analysis |
| Find out the enriched GO biological processes and KEGG pathways involved in transition from healthy to precancer to cancer |
| Tissue | Disease Stage | Enriched GO biological Processes |
| Colorectum | AD |  |
| Colorectum | SER |  |
| Colorectum | MSS |  |
| Colorectum | MSI-H |  |
| Colorectum | FAP |  |
| ∗Top 15 enriched GO BP terms are showed in the bar plot of each disease state in each tissue. Each row represents a significant GO biological process which is colored according to the -log10(p.adjust). |
| Page: 1 2 3 4 5 6 7 8 9 |
| GO ID | Tissue | Disease Stage | Description | Gene Ratio | Bg Ratio | pvalue | p.adjust | Count |
| GO:00073466 | Cervix | CC | regulation of mitotic cell cycle | 88/2311 | 457/18723 | 1.26e-05 | 2.60e-04 | 88 |
| GO:00073467 | Endometrium | EEC | regulation of mitotic cell cycle | 70/2168 | 457/18723 | 8.76e-03 | 4.74e-02 | 70 |
| GO:000734615 | Esophagus | ESCC | regulation of mitotic cell cycle | 293/8552 | 457/18723 | 8.00e-16 | 5.64e-14 | 293 |
| GO:00073463 | Liver | Cirrhotic | regulation of mitotic cell cycle | 154/4634 | 457/18723 | 8.73e-06 | 1.29e-04 | 154 |
| GO:000734611 | Liver | HCC | regulation of mitotic cell cycle | 255/7958 | 457/18723 | 4.96e-09 | 1.30e-07 | 255 |
| GO:00073464 | Lung | IAC | regulation of mitotic cell cycle | 78/2061 | 457/18723 | 5.37e-05 | 1.21e-03 | 78 |
| GO:000734621 | Oral cavity | EOLP | regulation of mitotic cell cycle | 82/2218 | 457/18723 | 7.50e-05 | 9.14e-04 | 82 |
| GO:000734631 | Oral cavity | NEOLP | regulation of mitotic cell cycle | 69/2005 | 457/18723 | 2.07e-03 | 1.38e-02 | 69 |
| GO:00073468 | Prostate | BPH | regulation of mitotic cell cycle | 115/3107 | 457/18723 | 1.52e-06 | 2.62e-05 | 115 |
| Page: 1 |
| Pathway ID | Tissue | Disease Stage | Description | Gene Ratio | Bg Ratio | pvalue | p.adjust | qvalue | Count |
| Page: 1 |
Top |
Cell-cell communication analysis |
| Identification of potential cell-cell interactions between two cell types and their ligand-receptor pairs for different disease states |
| Ligand | Receptor | LRpair | Pathway | Tissue | Disease Stage |
| Page: 1 |
Top |
Single-cell gene regulatory network inference analysis |
| Find out the significant the regulons (TFs) and the target genes of each regulon across cell types for different disease states |
| TF | Cell Type | Tissue | Disease Stage | Target Gene | RSS | Regulon Activity |
| ∗The dot plots of a searched regulon are shown for all cell subpopulations in each disease state of each tissue based on the regulon specific score inferred using pySCENIC and by calculating the average expression. |
| Page: 1 |
Top |
Somatic mutation of malignant transformation related genes |
| Annotation of somatic variants for genes involved in malignant transformation |
| Hugo Symbol | Variant Class | Variant Classification | dbSNP RS | HGVSc | HGVSp | HGVSp Short | SWISSPROT | BIOTYPE | SIFT | PolyPhen | Tumor Sample Barcode | Tissue | Histology | Sex | Age | Stage | Therapy Types | Drugs | Outcome |
| TTC28 | SNV | Missense_Mutation | novel | c.4602N>A | p.Met1534Ile | p.M1534I | Q96AY4 | protein_coding | tolerated(0.08) | benign(0.076) | TCGA-5L-AAT1-01 | Breast | breast invasive carcinoma | Female | <65 | III/IV | Hormone Therapy | letrozol | SD |
| TTC28 | SNV | Missense_Mutation | novel | c.7388N>T | p.Ser2463Phe | p.S2463F | Q96AY4 | protein_coding | deleterious_low_confidence(0) | benign(0.08) | TCGA-A2-A3XX-01 | Breast | breast invasive carcinoma | Female | <65 | I/II | Chemotherapy | cyclophosphamide | CR |
| TTC28 | SNV | Missense_Mutation | c.6044N>A | p.Gly2015Glu | p.G2015E | Q96AY4 | protein_coding | tolerated_low_confidence(0.92) | benign(0.011) | TCGA-AC-A23H-01 | Breast | breast invasive carcinoma | Female | >=65 | I/II | Unknown | Unknown | PD | |
| TTC28 | SNV | Missense_Mutation | c.5644N>G | p.Gln1882Glu | p.Q1882E | Q96AY4 | protein_coding | tolerated(0.57) | benign(0.003) | TCGA-AC-A23H-01 | Breast | breast invasive carcinoma | Female | >=65 | I/II | Unknown | Unknown | PD | |
| TTC28 | SNV | Missense_Mutation | c.4160N>T | p.Ser1387Leu | p.S1387L | Q96AY4 | protein_coding | tolerated(0.14) | benign(0.023) | TCGA-AC-A23H-01 | Breast | breast invasive carcinoma | Female | >=65 | I/II | Unknown | Unknown | PD | |
| TTC28 | SNV | Missense_Mutation | c.3162N>C | p.Glu1054Asp | p.E1054D | Q96AY4 | protein_coding | tolerated(0.14) | possibly_damaging(0.627) | TCGA-AC-A23H-01 | Breast | breast invasive carcinoma | Female | >=65 | I/II | Unknown | Unknown | PD | |
| TTC28 | SNV | Missense_Mutation | rs763920308 | c.1598C>A | p.Ala533Glu | p.A533E | Q96AY4 | protein_coding | deleterious(0) | probably_damaging(0.999) | TCGA-AC-A3TM-01 | Breast | breast invasive carcinoma | Female | <65 | III/IV | Chemotherapy | cytoxan | CR |
| TTC28 | SNV | Missense_Mutation | rs529615602 | c.2623N>A | p.Asp875Asn | p.D875N | Q96AY4 | protein_coding | deleterious(0.04) | possibly_damaging(0.692) | TCGA-AN-A0FW-01 | Breast | breast invasive carcinoma | Female | >=65 | III/IV | Unknown | Unknown | SD |
| TTC28 | SNV | Missense_Mutation | c.199N>A | p.Gln67Lys | p.Q67K | Q96AY4 | protein_coding | tolerated(0.3) | benign(0.113) | TCGA-AO-A124-01 | Breast | breast invasive carcinoma | Female | <65 | I/II | Chemotherapy | doxorubicin | SD | |
| TTC28 | SNV | Missense_Mutation | novel | c.5126N>G | p.Met1709Arg | p.M1709R | Q96AY4 | protein_coding | deleterious(0) | benign(0.134) | TCGA-BH-A0BD-01 | Breast | breast invasive carcinoma | Female | <65 | I/II | Chemotherapy | doxorubicin | SD |
| Page: 1 2 3 4 5 6 7 8 9 10 11 12 13 14 15 16 17 |
Top |
Related drugs of malignant transformation related genes |
| Identification of chemicals and drugs interact with genes involved in malignant transfromation |
| (DGIdb 4.0) |
| Entrez ID | Symbol | Category | Interaction Types | Drug Claim Name | Drug Name | PMIDs |
| Page: 1 |

Copyright 2023-Present -The University of Texas Health Science Center at Houston |