
|
|||||
|
 | |
| |
| |
| |
| |
| |
|
Gene: TMEM185B |
Gene summary for TMEM185B |
| Gene information | Species | Human | Gene symbol | TMEM185B | Gene ID | 79134 |
| Gene name | transmembrane protein 185B | |
| Gene Alias | FAM11B | |
| Cytomap | 2q14.2 | |
| Gene Type | protein-coding | GO ID | GO:0005575 | UniProtAcc | Q9H7F4 |
Top |
Malignant transformation analysis |
| Identification of the aberrant gene expression in precancerous and cancerous lesions by comparing the gene expression of stem-like cells in diseased tissues with normal stem cells |
| Entrez ID | Symbol | Replicates | Species | Organ | Tissue | Adj P-value | Log2FC | Malignancy |
| 79134 | TMEM185B | SYSMH2 | Human | Oral cavity | OSCC | 4.60e-07 | 2.00e-01 | 0.2326 |
| 79134 | TMEM185B | SYSMH3 | Human | Oral cavity | OSCC | 1.44e-11 | 2.36e-01 | 0.2442 |
| 79134 | TMEM185B | SYSMH5 | Human | Oral cavity | OSCC | 1.03e-04 | 1.52e-01 | 0.0647 |
| 79134 | TMEM185B | P1_cSCC | Human | Skin | cSCC | 2.33e-08 | 3.43e-01 | 0.0292 |
| 79134 | TMEM185B | P2_cSCC | Human | Skin | cSCC | 1.01e-04 | 2.06e-01 | -0.024 |
| 79134 | TMEM185B | P4_cSCC | Human | Skin | cSCC | 3.68e-06 | 2.57e-01 | -0.00290000000000005 |
| 79134 | TMEM185B | P10_cSCC | Human | Skin | cSCC | 3.71e-08 | 2.67e-01 | 0.1017 |
| Page: 1 2 3 4 5 |
| Tissue | Expression Dynamics | Abbreviation |
| Esophagus | 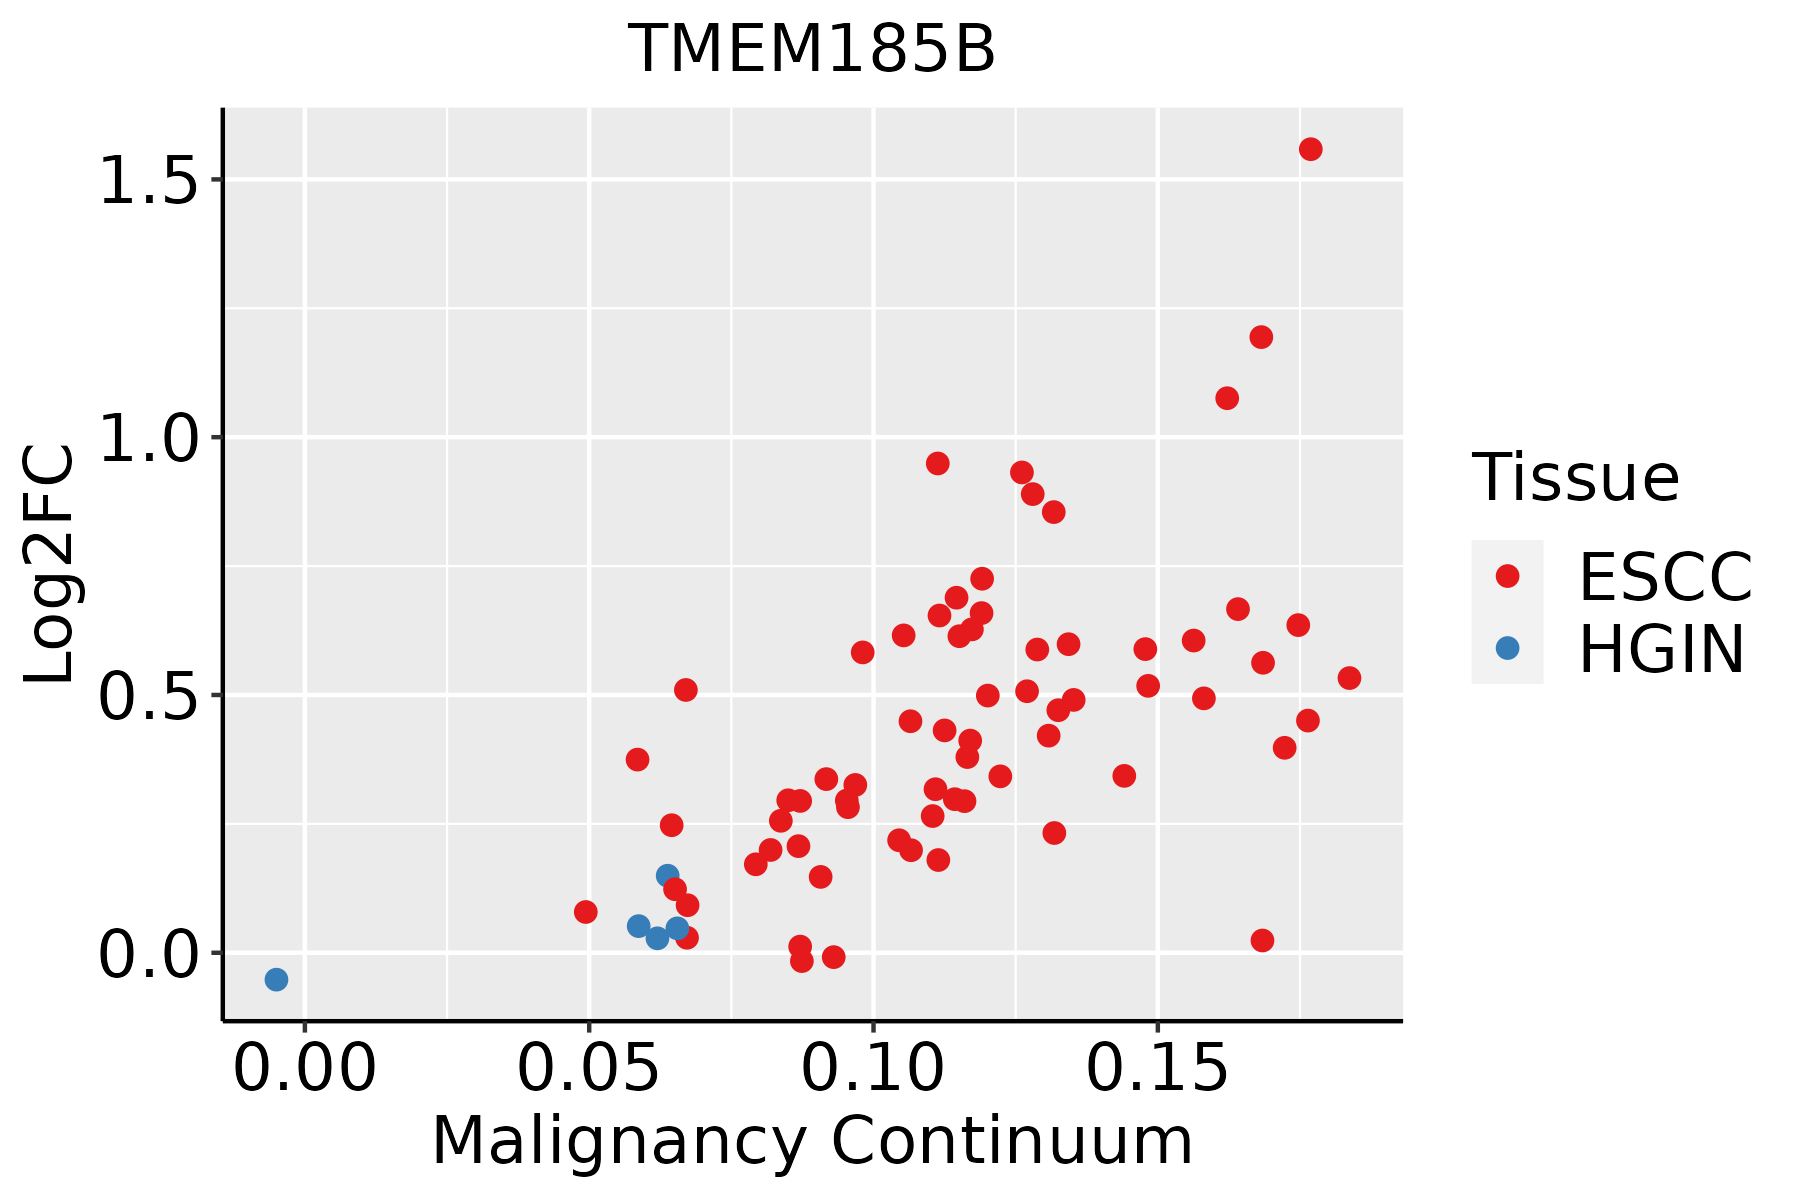 | ESCC: Esophageal squamous cell carcinoma |
| HGIN: High-grade intraepithelial neoplasias | ||
| LGIN: Low-grade intraepithelial neoplasias | ||
| Liver | 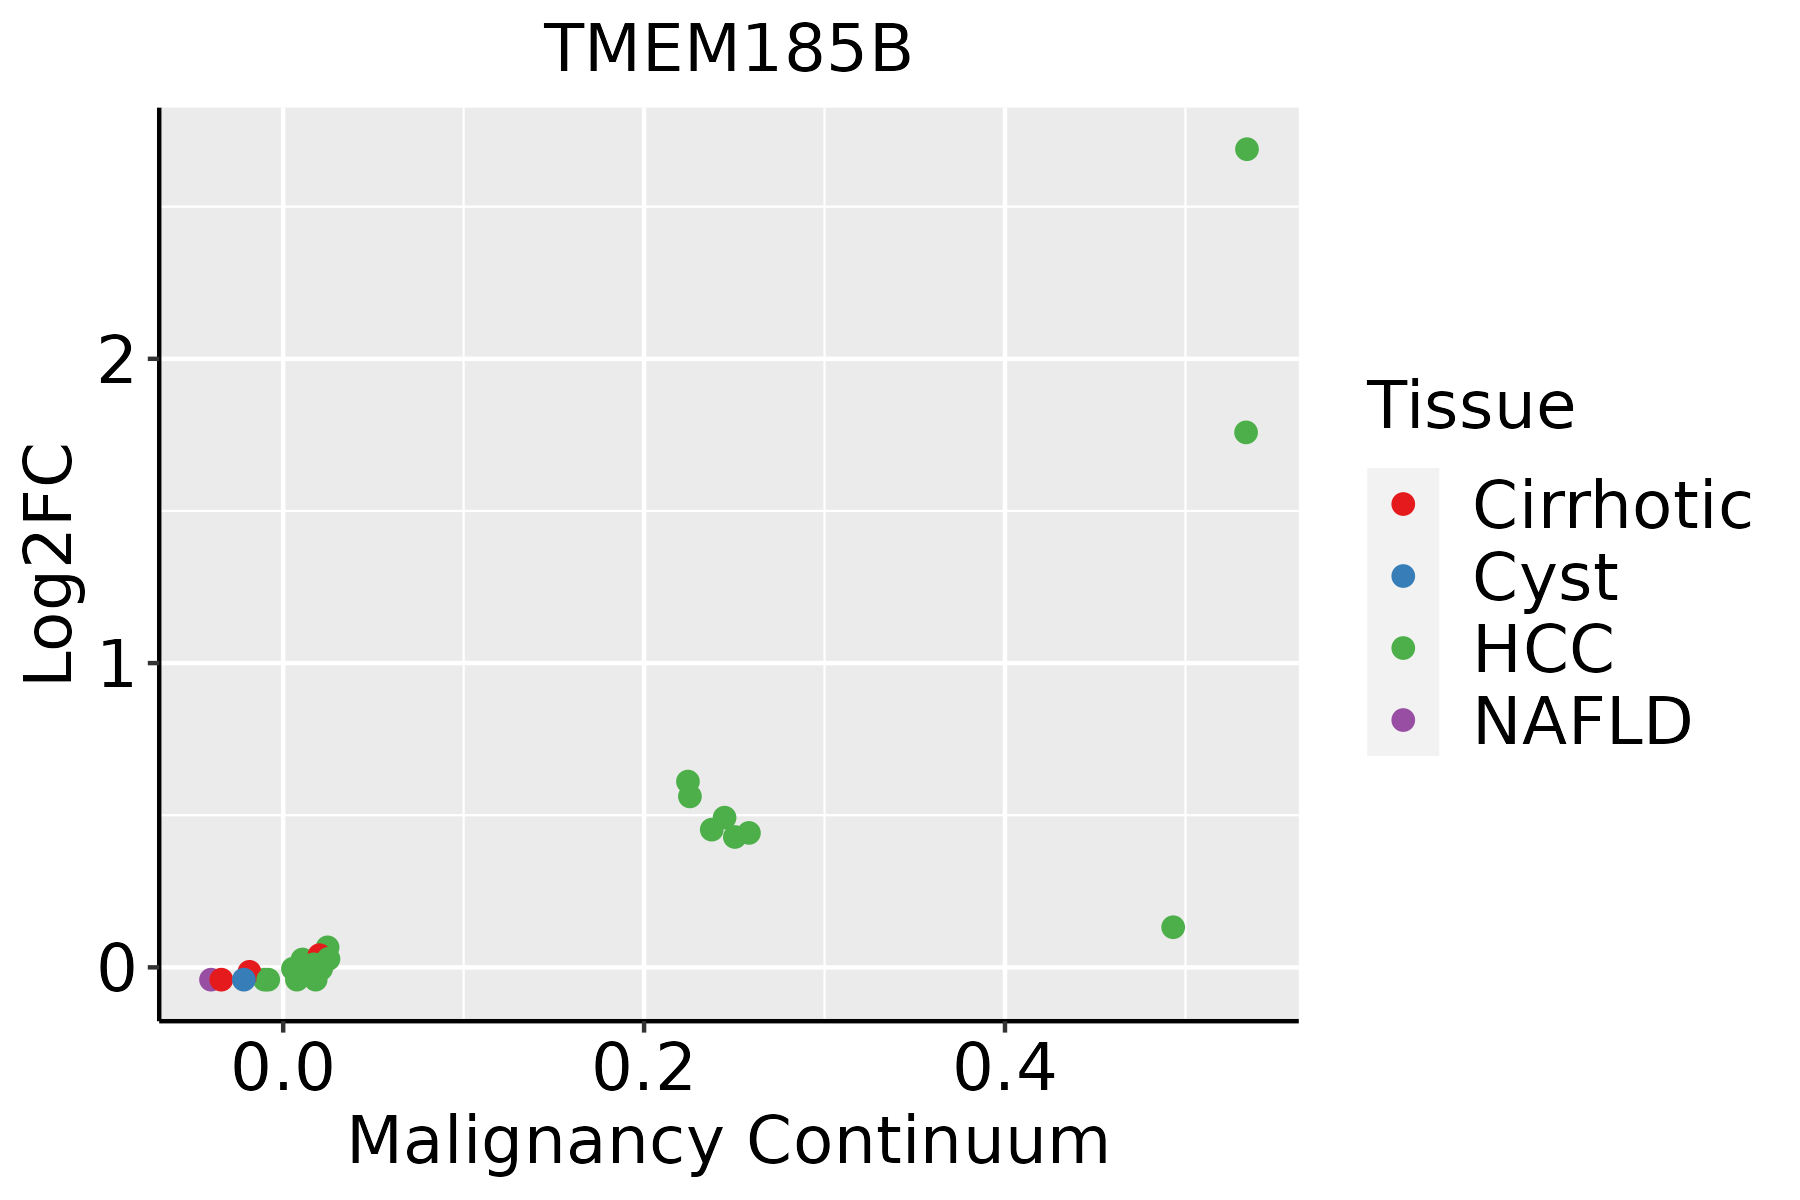 | HCC: Hepatocellular carcinoma |
| NAFLD: Non-alcoholic fatty liver disease | ||
| Oral Cavity |  | EOLP: Erosive Oral lichen planus |
| LP: leukoplakia | ||
| NEOLP: Non-erosive oral lichen planus | ||
| OSCC: Oral squamous cell carcinoma | ||
| Skin | 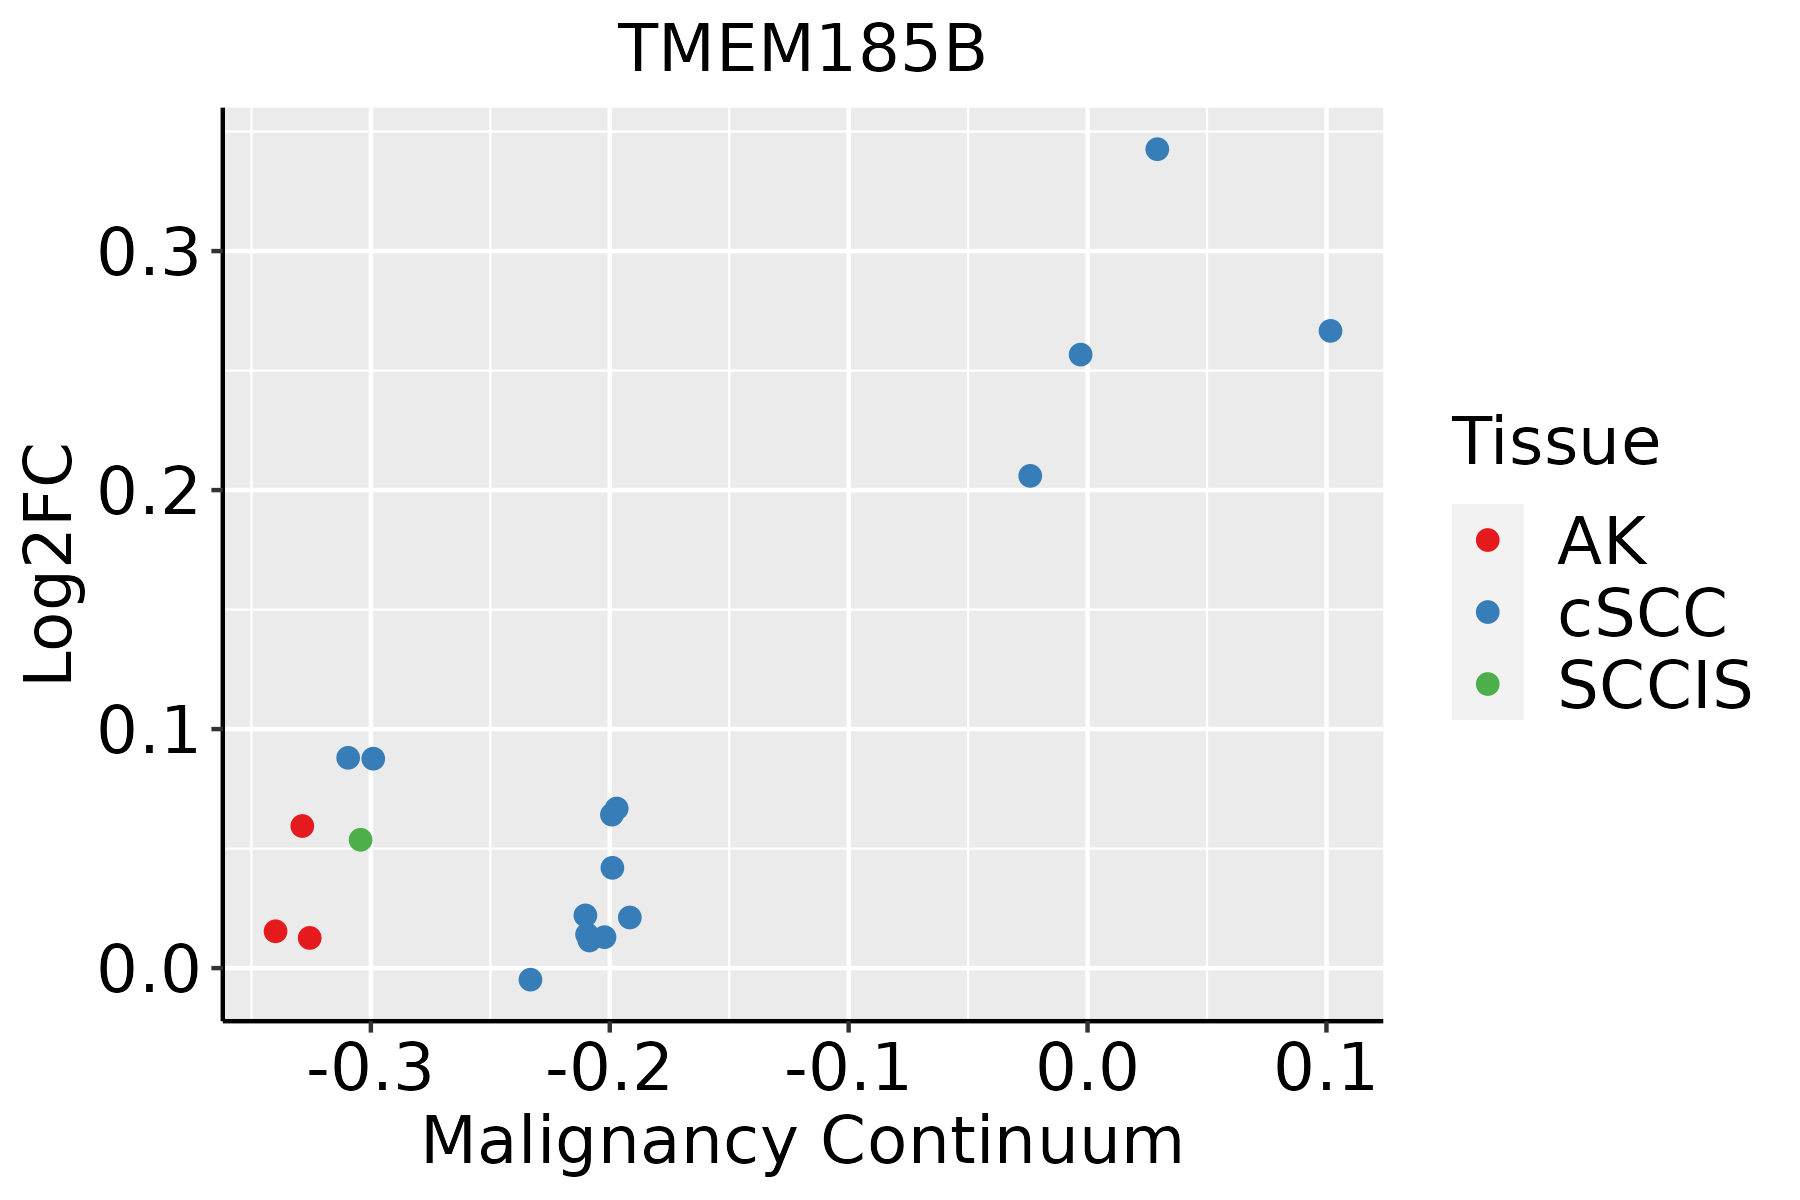 | AK: Actinic keratosis |
| cSCC: Cutaneous squamous cell carcinoma | ||
| SCCIS:squamous cell carcinoma in situ |
| ∗log2FC in expression of this searched gene in stem-like cells from each diseased tissue sample relative to stem-like cells in normal samples in each tissue plotted against the malignancy continuum. Samples are colored based on if they are from different disease stage. |
Top |
Malignant transformation related pathway analysis |
| Find out the enriched GO biological processes and KEGG pathways involved in transition from healthy to precancer to cancer |
| Tissue | Disease Stage | Enriched GO biological Processes |
| Colorectum | AD |  |
| Colorectum | SER |  |
| Colorectum | MSS |  |
| Colorectum | MSI-H |  |
| Colorectum | FAP |  |
| ∗Top 15 enriched GO BP terms are showed in the bar plot of each disease state in each tissue. Each row represents a significant GO biological process which is colored according to the -log10(p.adjust). |
| Page: 1 2 3 4 5 6 7 8 9 |
| GO ID | Tissue | Disease Stage | Description | Gene Ratio | Bg Ratio | pvalue | p.adjust | Count |
| Page: 1 |
| Pathway ID | Tissue | Disease Stage | Description | Gene Ratio | Bg Ratio | pvalue | p.adjust | qvalue | Count |
| Page: 1 |
Top |
Cell-cell communication analysis |
| Identification of potential cell-cell interactions between two cell types and their ligand-receptor pairs for different disease states |
| Ligand | Receptor | LRpair | Pathway | Tissue | Disease Stage |
| Page: 1 |
Top |
Single-cell gene regulatory network inference analysis |
| Find out the significant the regulons (TFs) and the target genes of each regulon across cell types for different disease states |
| TF | Cell Type | Tissue | Disease Stage | Target Gene | RSS | Regulon Activity |
| ∗The dot plots of a searched regulon are shown for all cell subpopulations in each disease state of each tissue based on the regulon specific score inferred using pySCENIC and by calculating the average expression. |
| Page: 1 |
Top |
Somatic mutation of malignant transformation related genes |
| Annotation of somatic variants for genes involved in malignant transformation |
| Hugo Symbol | Variant Class | Variant Classification | dbSNP RS | HGVSc | HGVSp | HGVSp Short | SWISSPROT | BIOTYPE | SIFT | PolyPhen | Tumor Sample Barcode | Tissue | Histology | Sex | Age | Stage | Therapy Types | Drugs | Outcome |
| TMEM185B | SNV | Missense_Mutation | novel | c.214N>G | p.Arg72Gly | p.R72G | Q9H7F4 | protein_coding | deleterious(0) | probably_damaging(0.988) | TCGA-JW-A5VL-01 | Cervix | cervical & endocervical cancer | Female | <65 | I/II | Unknown | Unknown | SD |
| TMEM185B | deletion | Frame_Shift_Del | c.1022delN | p.Pro341LeufsTer4 | p.P341Lfs*4 | Q9H7F4 | protein_coding | TCGA-MA-AA42-01 | Cervix | cervical & endocervical cancer | Female | >=65 | I/II | Unknown | Unknown | SD | |||
| TMEM185B | SNV | Missense_Mutation | c.904G>A | p.Glu302Lys | p.E302K | Q9H7F4 | protein_coding | tolerated(0.27) | benign(0.058) | TCGA-A6-6141-01 | Colorectum | colon adenocarcinoma | Male | <65 | I/II | Chemotherapy | 5-fu | SD | |
| TMEM185B | deletion | Frame_Shift_Del | c.1022delN | p.Pro341LeufsTer4 | p.P341Lfs*4 | Q9H7F4 | protein_coding | TCGA-CK-5913-01 | Colorectum | colon adenocarcinoma | Female | <65 | I/II | Unknown | Unknown | SD | |||
| TMEM185B | deletion | Frame_Shift_Del | c.1022delC | p.Pro341LeufsTer4 | p.P341Lfs*4 | Q9H7F4 | protein_coding | TCGA-CK-5916-01 | Colorectum | colon adenocarcinoma | Female | >=65 | I/II | Unknown | Unknown | PD | |||
| TMEM185B | deletion | Frame_Shift_Del | c.1022delC | p.Pro341LeufsTer4 | p.P341Lfs*4 | Q9H7F4 | protein_coding | TCGA-CM-6171-01 | Colorectum | colon adenocarcinoma | Female | >=65 | I/II | Unknown | Unknown | SD | |||
| TMEM185B | SNV | Missense_Mutation | novel | c.134N>T | p.Ala45Val | p.A45V | Q9H7F4 | protein_coding | tolerated(1) | benign(0.009) | TCGA-AP-A1DK-01 | Endometrium | uterine corpus endometrioid carcinoma | Female | <65 | I/II | Unknown | Unknown | SD |
| TMEM185B | SNV | Missense_Mutation | novel | c.800N>A | p.Gly267Asp | p.G267D | Q9H7F4 | protein_coding | deleterious(0) | probably_damaging(0.985) | TCGA-AX-A1C4-01 | Endometrium | uterine corpus endometrioid carcinoma | Female | <65 | I/II | Unknown | Unknown | SD |
| TMEM185B | SNV | Missense_Mutation | novel | c.620N>A | p.Arg207Gln | p.R207Q | Q9H7F4 | protein_coding | tolerated(0.05) | probably_damaging(1) | TCGA-AX-A1C9-01 | Endometrium | uterine corpus endometrioid carcinoma | Female | >=65 | I/II | Unknown | Unknown | SD |
| TMEM185B | SNV | Missense_Mutation | novel | c.592C>T | p.Arg198Trp | p.R198W | Q9H7F4 | protein_coding | deleterious(0.04) | probably_damaging(1) | TCGA-AX-A2HA-01 | Endometrium | uterine corpus endometrioid carcinoma | Female | <65 | I/II | Unknown | Unknown | SD |
| Page: 1 2 3 4 |
Top |
Related drugs of malignant transformation related genes |
| Identification of chemicals and drugs interact with genes involved in malignant transfromation |
| (DGIdb 4.0) |
| Entrez ID | Symbol | Category | Interaction Types | Drug Claim Name | Drug Name | PMIDs |
| Page: 1 |

Copyright 2023-Present -The University of Texas Health Science Center at Houston |