
|
|||||
|
 | |
| |
| |
| |
| |
| |
|
Gene: TMEM135 |
Gene summary for TMEM135 |
| Gene information | Species | Human | Gene symbol | TMEM135 | Gene ID | 65084 |
| Gene name | transmembrane protein 135 | |
| Gene Alias | PMP52 | |
| Cytomap | 11q14.2 | |
| Gene Type | protein-coding | GO ID | GO:0000266 | UniProtAcc | Q86UB9 |
Top |
Malignant transformation analysis |
| Identification of the aberrant gene expression in precancerous and cancerous lesions by comparing the gene expression of stem-like cells in diseased tissues with normal stem cells |
| Entrez ID | Symbol | Replicates | Species | Organ | Tissue | Adj P-value | Log2FC | Malignancy |
| 65084 | TMEM135 | P79T-E | Human | Esophagus | ESCC | 6.87e-10 | 1.84e-01 | 0.1154 |
| 65084 | TMEM135 | P80T-E | Human | Esophagus | ESCC | 1.41e-04 | 1.61e-01 | 0.155 |
| 65084 | TMEM135 | P82T-E | Human | Esophagus | ESCC | 3.22e-06 | 2.45e-01 | 0.1072 |
| 65084 | TMEM135 | P83T-E | Human | Esophagus | ESCC | 1.65e-14 | 2.96e-01 | 0.1738 |
| 65084 | TMEM135 | P107T-E | Human | Esophagus | ESCC | 9.25e-21 | 4.89e-01 | 0.171 |
| 65084 | TMEM135 | P128T-E | Human | Esophagus | ESCC | 4.28e-20 | 6.64e-01 | 0.1241 |
| 65084 | TMEM135 | P130T-E | Human | Esophagus | ESCC | 9.38e-05 | 9.37e-02 | 0.1676 |
| 65084 | TMEM135 | RNA-P25T1-P25T1-1 | Human | Lung | AIS | 1.12e-10 | 5.81e-01 | -0.2116 |
| 65084 | TMEM135 | RNA-P25T1-P25T1-4 | Human | Lung | AIS | 3.37e-14 | 7.46e-01 | -0.2119 |
| 65084 | TMEM135 | RNA-P6T2-P6T2-1 | Human | Lung | IAC | 1.43e-14 | 4.72e-01 | -0.0166 |
| 65084 | TMEM135 | RNA-P6T2-P6T2-2 | Human | Lung | IAC | 9.21e-15 | 4.54e-01 | -0.0132 |
| 65084 | TMEM135 | RNA-P6T2-P6T2-3 | Human | Lung | IAC | 5.36e-15 | 4.25e-01 | -0.013 |
| 65084 | TMEM135 | RNA-P6T2-P6T2-4 | Human | Lung | IAC | 2.47e-12 | 4.59e-01 | -0.0121 |
| 65084 | TMEM135 | RNA-P7T1-P7T1-1 | Human | Lung | AIS | 1.03e-02 | 4.87e-01 | -0.0961 |
| 65084 | TMEM135 | RNA-P7T1-P7T1-2 | Human | Lung | AIS | 3.37e-02 | 4.14e-01 | -0.0876 |
| 65084 | TMEM135 | RNA-P7T1-P7T1-4 | Human | Lung | AIS | 2.37e-05 | 4.60e-01 | -0.0809 |
| 65084 | TMEM135 | HTA12-23-1 | Human | Pancreas | PDAC | 2.34e-03 | 6.40e-01 | 0.3405 |
| 65084 | TMEM135 | HTA12-25-1 | Human | Pancreas | PDAC | 1.40e-03 | 4.85e-01 | 0.313 |
| 65084 | TMEM135 | HTA12-26-1 | Human | Pancreas | PDAC | 2.43e-11 | 6.33e-01 | 0.3728 |
| 65084 | TMEM135 | HTA12-29-1 | Human | Pancreas | PDAC | 6.38e-31 | 7.61e-01 | 0.3722 |
| Page: 1 2 3 4 5 |
| Tissue | Expression Dynamics | Abbreviation |
| Colorectum (GSE201348) |  | FAP: Familial adenomatous polyposis |
| CRC: Colorectal cancer | ||
| Colorectum (HTA11) |  | AD: Adenomas |
| SER: Sessile serrated lesions | ||
| MSI-H: Microsatellite-high colorectal cancer | ||
| MSS: Microsatellite stable colorectal cancer | ||
| Lung | 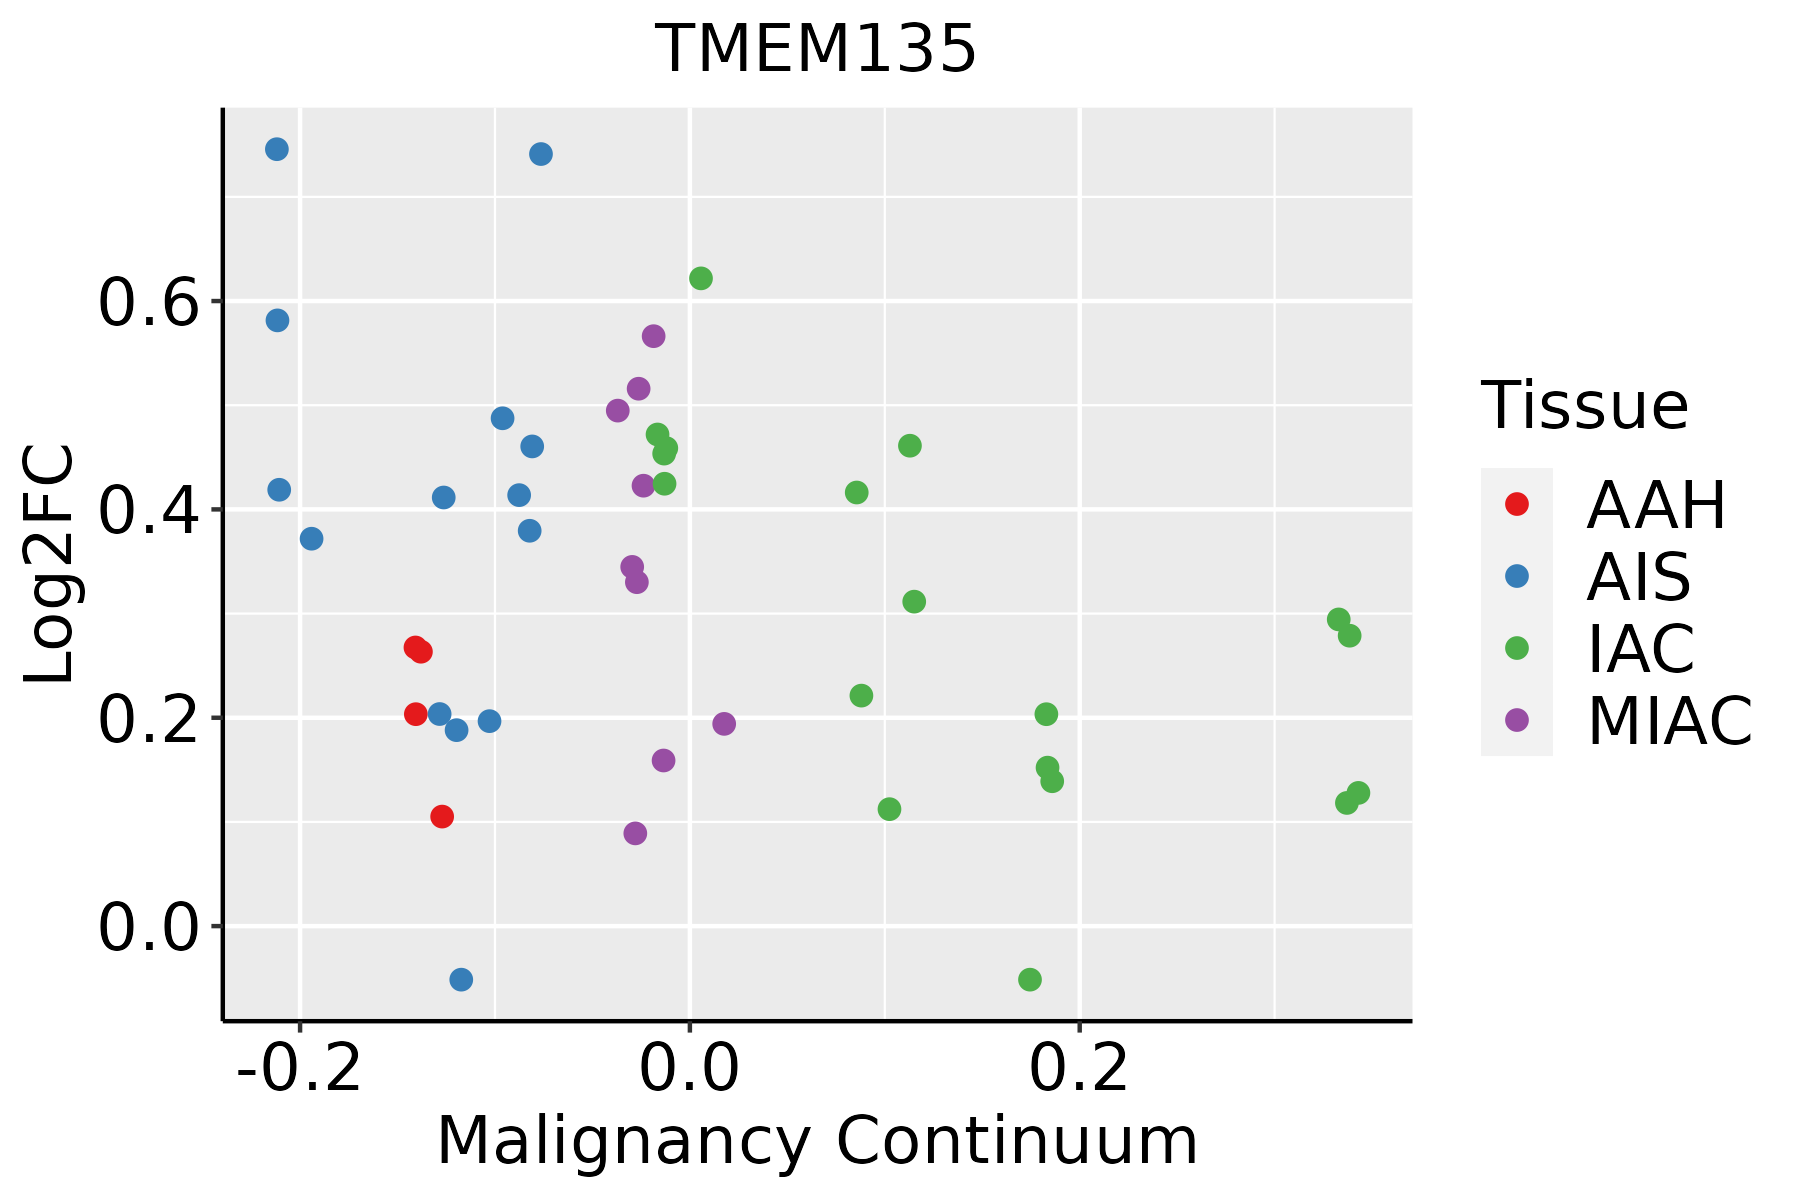 | AAH: Atypical adenomatous hyperplasia |
| AIS: Adenocarcinoma in situ | ||
| IAC: Invasive lung adenocarcinoma | ||
| MIA: Minimally invasive adenocarcinoma |
| ∗log2FC in expression of this searched gene in stem-like cells from each diseased tissue sample relative to stem-like cells in normal samples in each tissue plotted against the malignancy continuum. Samples are colored based on if they are from different disease stage. |
Top |
Malignant transformation related pathway analysis |
| Find out the enriched GO biological processes and KEGG pathways involved in transition from healthy to precancer to cancer |
| Tissue | Disease Stage | Enriched GO biological Processes |
| Colorectum | AD |  |
| Colorectum | SER |  |
| Colorectum | MSS |  |
| Colorectum | MSI-H |  |
| Colorectum | FAP |  |
| ∗Top 15 enriched GO BP terms are showed in the bar plot of each disease state in each tissue. Each row represents a significant GO biological process which is colored according to the -log10(p.adjust). |
| Page: 1 2 3 4 5 6 7 8 9 |
| GO ID | Tissue | Disease Stage | Description | Gene Ratio | Bg Ratio | pvalue | p.adjust | Count |
| GO:0010821 | Colorectum | AD | regulation of mitochondrion organization | 57/3918 | 144/18723 | 2.43e-07 | 9.92e-06 | 57 |
| GO:0031667 | Colorectum | AD | response to nutrient levels | 138/3918 | 474/18723 | 1.22e-05 | 2.68e-04 | 138 |
| GO:0009409 | Colorectum | AD | response to cold | 22/3918 | 49/18723 | 1.40e-04 | 1.98e-03 | 22 |
| GO:00108212 | Colorectum | MSS | regulation of mitochondrion organization | 53/3467 | 144/18723 | 1.67e-07 | 7.55e-06 | 53 |
| GO:00316672 | Colorectum | MSS | response to nutrient levels | 125/3467 | 474/18723 | 1.24e-05 | 2.88e-04 | 125 |
| GO:00094092 | Colorectum | MSS | response to cold | 19/3467 | 49/18723 | 7.20e-04 | 7.70e-03 | 19 |
| GO:00316673 | Colorectum | FAP | response to nutrient levels | 95/2622 | 474/18723 | 1.59e-04 | 2.43e-03 | 95 |
| GO:00108213 | Colorectum | FAP | regulation of mitochondrion organization | 35/2622 | 144/18723 | 6.44e-04 | 7.05e-03 | 35 |
| GO:00094093 | Colorectum | FAP | response to cold | 14/2622 | 49/18723 | 5.95e-03 | 3.75e-02 | 14 |
| GO:00316678 | Lung | IAC | response to nutrient levels | 76/2061 | 474/18723 | 4.87e-04 | 7.08e-03 | 76 |
| GO:003166713 | Lung | AIS | response to nutrient levels | 64/1849 | 474/18723 | 6.13e-03 | 4.98e-02 | 64 |
| Page: 1 |
| Pathway ID | Tissue | Disease Stage | Description | Gene Ratio | Bg Ratio | pvalue | p.adjust | qvalue | Count |
| Page: 1 |
Top |
Cell-cell communication analysis |
| Identification of potential cell-cell interactions between two cell types and their ligand-receptor pairs for different disease states |
| Ligand | Receptor | LRpair | Pathway | Tissue | Disease Stage |
| Page: 1 |
Top |
Single-cell gene regulatory network inference analysis |
| Find out the significant the regulons (TFs) and the target genes of each regulon across cell types for different disease states |
| TF | Cell Type | Tissue | Disease Stage | Target Gene | RSS | Regulon Activity |
| ∗The dot plots of a searched regulon are shown for all cell subpopulations in each disease state of each tissue based on the regulon specific score inferred using pySCENIC and by calculating the average expression. |
| Page: 1 |
Top |
Somatic mutation of malignant transformation related genes |
| Annotation of somatic variants for genes involved in malignant transformation |
| Hugo Symbol | Variant Class | Variant Classification | dbSNP RS | HGVSc | HGVSp | HGVSp Short | SWISSPROT | BIOTYPE | SIFT | PolyPhen | Tumor Sample Barcode | Tissue | Histology | Sex | Age | Stage | Therapy Types | Drugs | Outcome |
| TMEM135 | SNV | Missense_Mutation | c.809N>A | p.Cys270Tyr | p.C270Y | Q86UB9 | protein_coding | deleterious(0) | probably_damaging(0.979) | TCGA-D8-A1JA-01 | Breast | breast invasive carcinoma | Female | <65 | III/IV | Chemotherapy | adriamycin | PD | |
| TMEM135 | SNV | Missense_Mutation | c.777C>G | p.Ile259Met | p.I259M | Q86UB9 | protein_coding | tolerated(0.13) | possibly_damaging(0.751) | TCGA-C5-A7UH-01 | Cervix | cervical & endocervical cancer | Female | <65 | III/IV | Chemotherapy | cisplatin | SD | |
| TMEM135 | SNV | Missense_Mutation | novel | c.288N>G | p.Phe96Leu | p.F96L | Q86UB9 | protein_coding | deleterious(0.01) | benign(0.168) | TCGA-DS-A7WH-01 | Cervix | cervical & endocervical cancer | Female | <65 | I/II | Chemotherapy | cisplatin | CR |
| TMEM135 | SNV | Missense_Mutation | c.692N>G | p.Asp231Gly | p.D231G | Q86UB9 | protein_coding | deleterious(0.04) | possibly_damaging(0.462) | TCGA-AA-3713-01 | Colorectum | colon adenocarcinoma | Male | >=65 | III/IV | Chemotherapy | 5-fluorouracil | PR | |
| TMEM135 | SNV | Missense_Mutation | c.47N>A | p.Gly16Asp | p.G16D | Q86UB9 | protein_coding | tolerated(0.08) | possibly_damaging(0.859) | TCGA-AD-5900-01 | Colorectum | colon adenocarcinoma | Male | >=65 | I/II | Unknown | Unknown | SD | |
| TMEM135 | SNV | Missense_Mutation | rs202089067 | c.955N>T | p.Arg319Cys | p.R319C | Q86UB9 | protein_coding | deleterious(0) | probably_damaging(0.997) | TCGA-AD-6899-01 | Colorectum | colon adenocarcinoma | Male | >=65 | III/IV | Unknown | Unknown | SD |
| TMEM135 | SNV | Missense_Mutation | c.1259N>G | p.Asn420Ser | p.N420S | Q86UB9 | protein_coding | tolerated(0.45) | probably_damaging(0.998) | TCGA-AY-6197-01 | Colorectum | colon adenocarcinoma | Male | <65 | I/II | Unknown | Unknown | SD | |
| TMEM135 | SNV | Missense_Mutation | novel | c.284N>C | p.Lys95Thr | p.K95T | Q86UB9 | protein_coding | tolerated(0.1) | benign(0.177) | TCGA-CA-6717-01 | Colorectum | colon adenocarcinoma | Male | <65 | I/II | Chemotherapy | oxaliplatin | CR |
| TMEM135 | SNV | Missense_Mutation | novel | c.653N>T | p.Gly218Val | p.G218V | Q86UB9 | protein_coding | tolerated(0.59) | benign(0.049) | TCGA-CA-6717-01 | Colorectum | colon adenocarcinoma | Male | <65 | I/II | Chemotherapy | oxaliplatin | CR |
| TMEM135 | SNV | Missense_Mutation | novel | c.645A>C | p.Glu215Asp | p.E215D | Q86UB9 | protein_coding | tolerated(0.4) | benign(0) | TCGA-F5-6814-01 | Colorectum | rectum adenocarcinoma | Male | <65 | I/II | Unknown | Unknown | SD |
| Page: 1 2 3 4 5 |
Top |
Related drugs of malignant transformation related genes |
| Identification of chemicals and drugs interact with genes involved in malignant transfromation |
| (DGIdb 4.0) |
| Entrez ID | Symbol | Category | Interaction Types | Drug Claim Name | Drug Name | PMIDs |
| Page: 1 |

Copyright 2023-Present -The University of Texas Health Science Center at Houston |