
|
|||||
|
 | |
| |
| |
| |
| |
| |
|
Gene: TMEM127 |
Gene summary for TMEM127 |
| Gene information | Species | Human | Gene symbol | TMEM127 | Gene ID | 55654 |
| Gene name | transmembrane protein 127 | |
| Gene Alias | TMEM127 | |
| Cytomap | 2q11.2 | |
| Gene Type | protein-coding | GO ID | GO:0006996 | UniProtAcc | O75204 |
Top |
Malignant transformation analysis |
| Identification of the aberrant gene expression in precancerous and cancerous lesions by comparing the gene expression of stem-like cells in diseased tissues with normal stem cells |
| Entrez ID | Symbol | Replicates | Species | Organ | Tissue | Adj P-value | Log2FC | Malignancy |
| 55654 | TMEM127 | Pt13.b | Human | Liver | HCC | 5.56e-03 | 9.69e-02 | 0.0251 |
| 55654 | TMEM127 | S014 | Human | Liver | HCC | 3.49e-09 | 4.37e-01 | 0.2254 |
| 55654 | TMEM127 | S015 | Human | Liver | HCC | 2.58e-08 | 5.10e-01 | 0.2375 |
| 55654 | TMEM127 | S016 | Human | Liver | HCC | 3.04e-09 | 4.53e-01 | 0.2243 |
| 55654 | TMEM127 | S027 | Human | Liver | HCC | 1.15e-06 | 6.69e-01 | 0.2446 |
| 55654 | TMEM127 | S028 | Human | Liver | HCC | 4.35e-13 | 6.02e-01 | 0.2503 |
| 55654 | TMEM127 | S029 | Human | Liver | HCC | 3.21e-11 | 5.32e-01 | 0.2581 |
| 55654 | TMEM127 | C04 | Human | Oral cavity | OSCC | 9.03e-10 | 5.91e-01 | 0.2633 |
| 55654 | TMEM127 | C21 | Human | Oral cavity | OSCC | 4.50e-15 | 6.42e-01 | 0.2678 |
| 55654 | TMEM127 | C30 | Human | Oral cavity | OSCC | 1.43e-23 | 1.21e+00 | 0.3055 |
| 55654 | TMEM127 | C43 | Human | Oral cavity | OSCC | 5.39e-08 | 2.77e-01 | 0.1704 |
| 55654 | TMEM127 | C46 | Human | Oral cavity | OSCC | 1.95e-06 | 2.11e-01 | 0.1673 |
| 55654 | TMEM127 | C51 | Human | Oral cavity | OSCC | 3.74e-08 | 5.65e-01 | 0.2674 |
| 55654 | TMEM127 | C57 | Human | Oral cavity | OSCC | 1.01e-08 | 4.23e-01 | 0.1679 |
| 55654 | TMEM127 | C08 | Human | Oral cavity | OSCC | 4.13e-09 | 2.51e-01 | 0.1919 |
| 55654 | TMEM127 | C09 | Human | Oral cavity | OSCC | 4.19e-02 | 2.28e-01 | 0.1431 |
| 55654 | TMEM127 | LN22 | Human | Oral cavity | OSCC | 2.86e-02 | 5.25e-01 | 0.1733 |
| 55654 | TMEM127 | LN38 | Human | Oral cavity | OSCC | 4.11e-02 | 6.77e-01 | 0.168 |
| 55654 | TMEM127 | LN46 | Human | Oral cavity | OSCC | 8.85e-03 | 3.62e-01 | 0.1666 |
| 55654 | TMEM127 | LP15 | Human | Oral cavity | LP | 1.50e-09 | 1.41e+00 | 0.2174 |
| Page: 1 2 3 4 5 6 |
| Tissue | Expression Dynamics | Abbreviation |
| Colorectum (GSE201348) |  | FAP: Familial adenomatous polyposis |
| CRC: Colorectal cancer | ||
| Colorectum (HTA11) |  | AD: Adenomas |
| SER: Sessile serrated lesions | ||
| MSI-H: Microsatellite-high colorectal cancer | ||
| MSS: Microsatellite stable colorectal cancer | ||
| Esophagus | 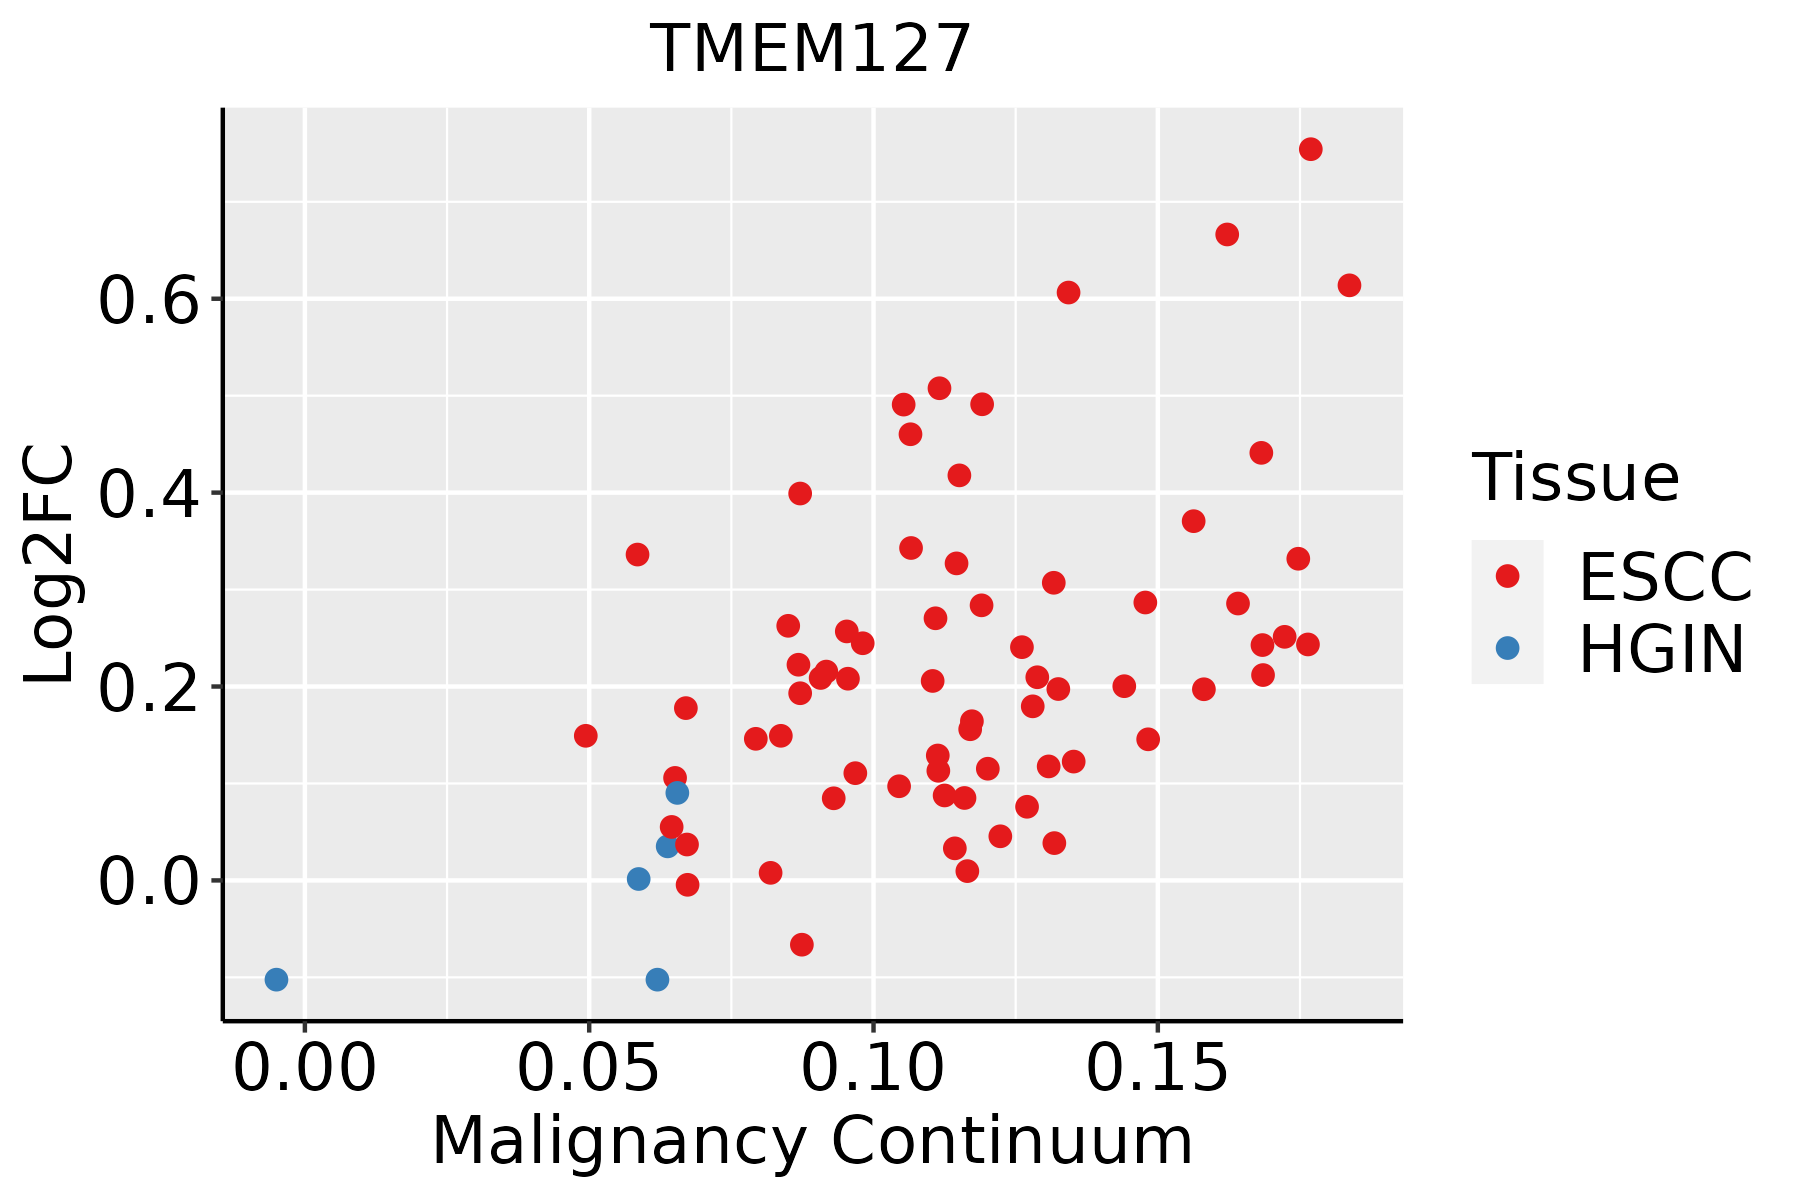 | ESCC: Esophageal squamous cell carcinoma |
| HGIN: High-grade intraepithelial neoplasias | ||
| LGIN: Low-grade intraepithelial neoplasias | ||
| Liver | 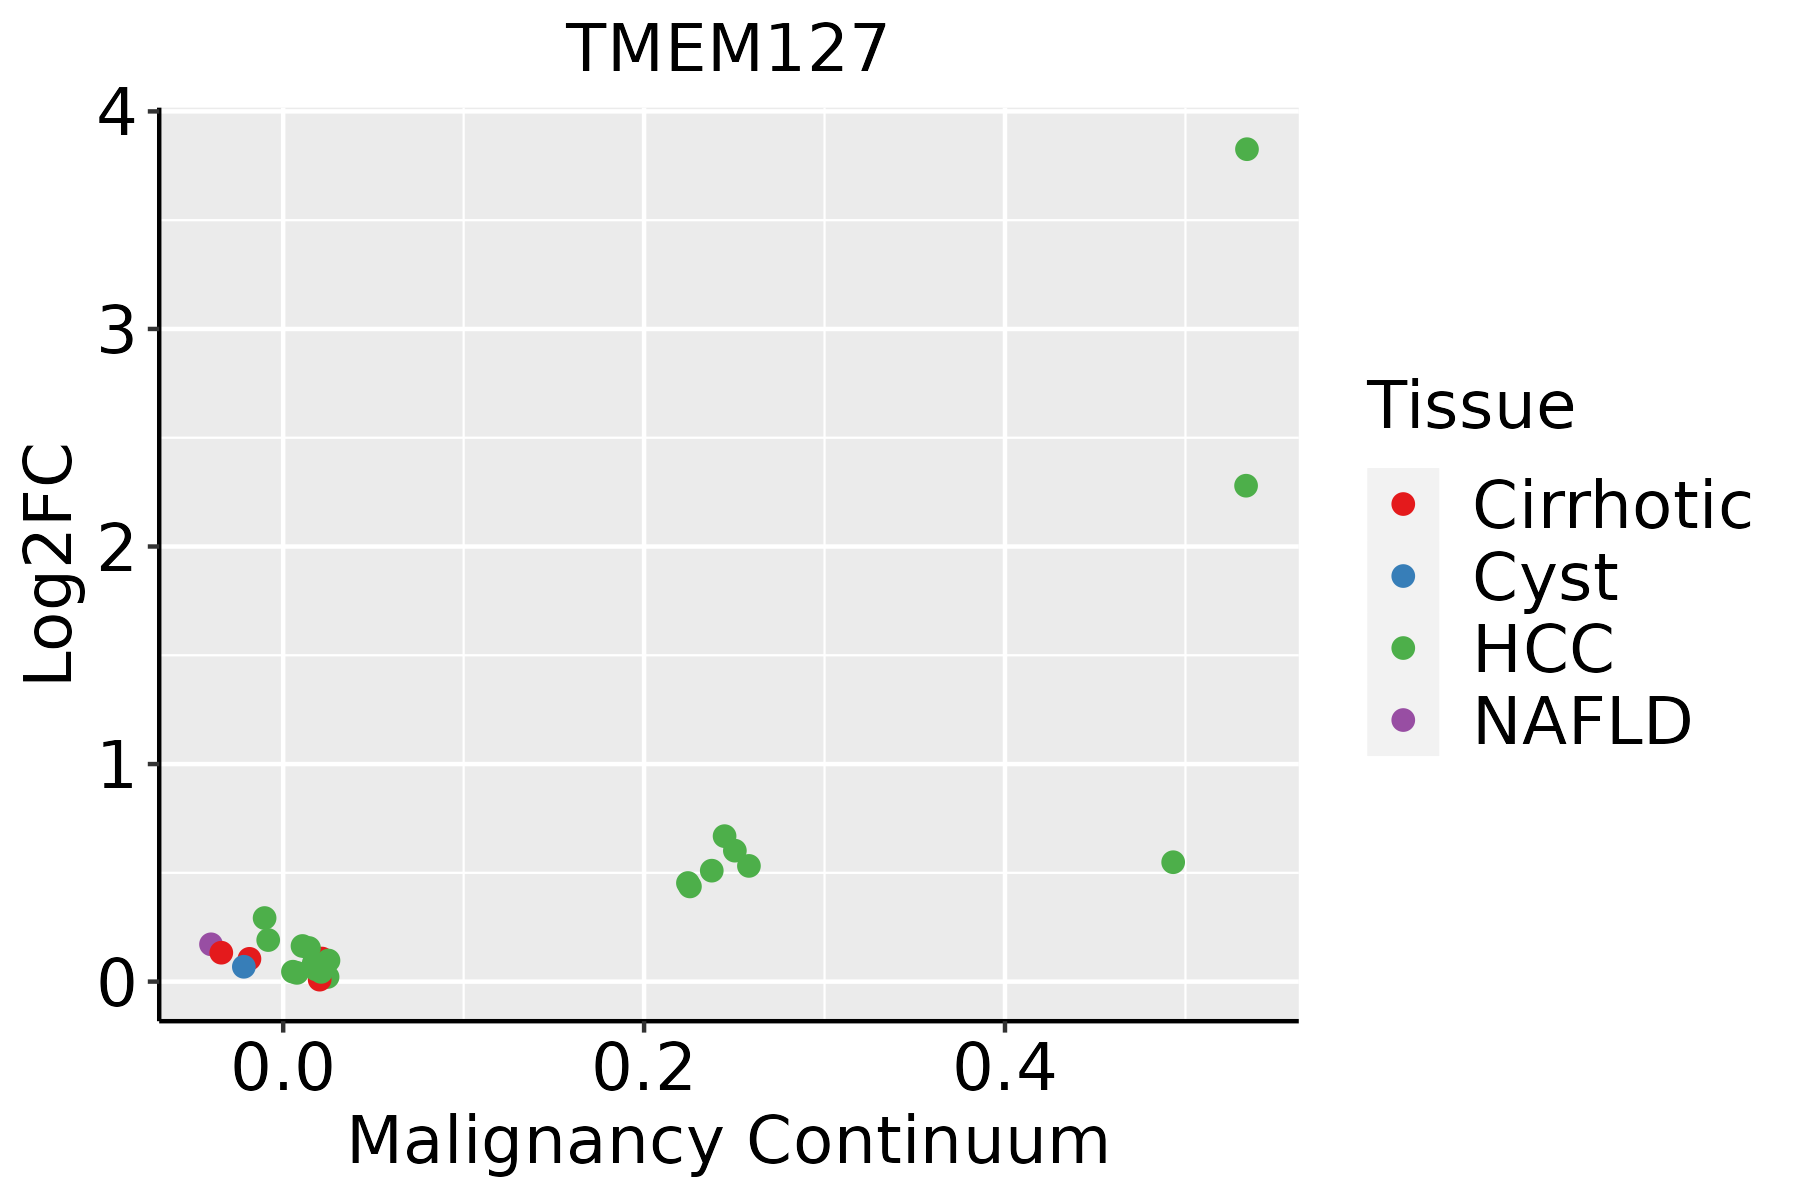 | HCC: Hepatocellular carcinoma |
| NAFLD: Non-alcoholic fatty liver disease | ||
| Oral Cavity | 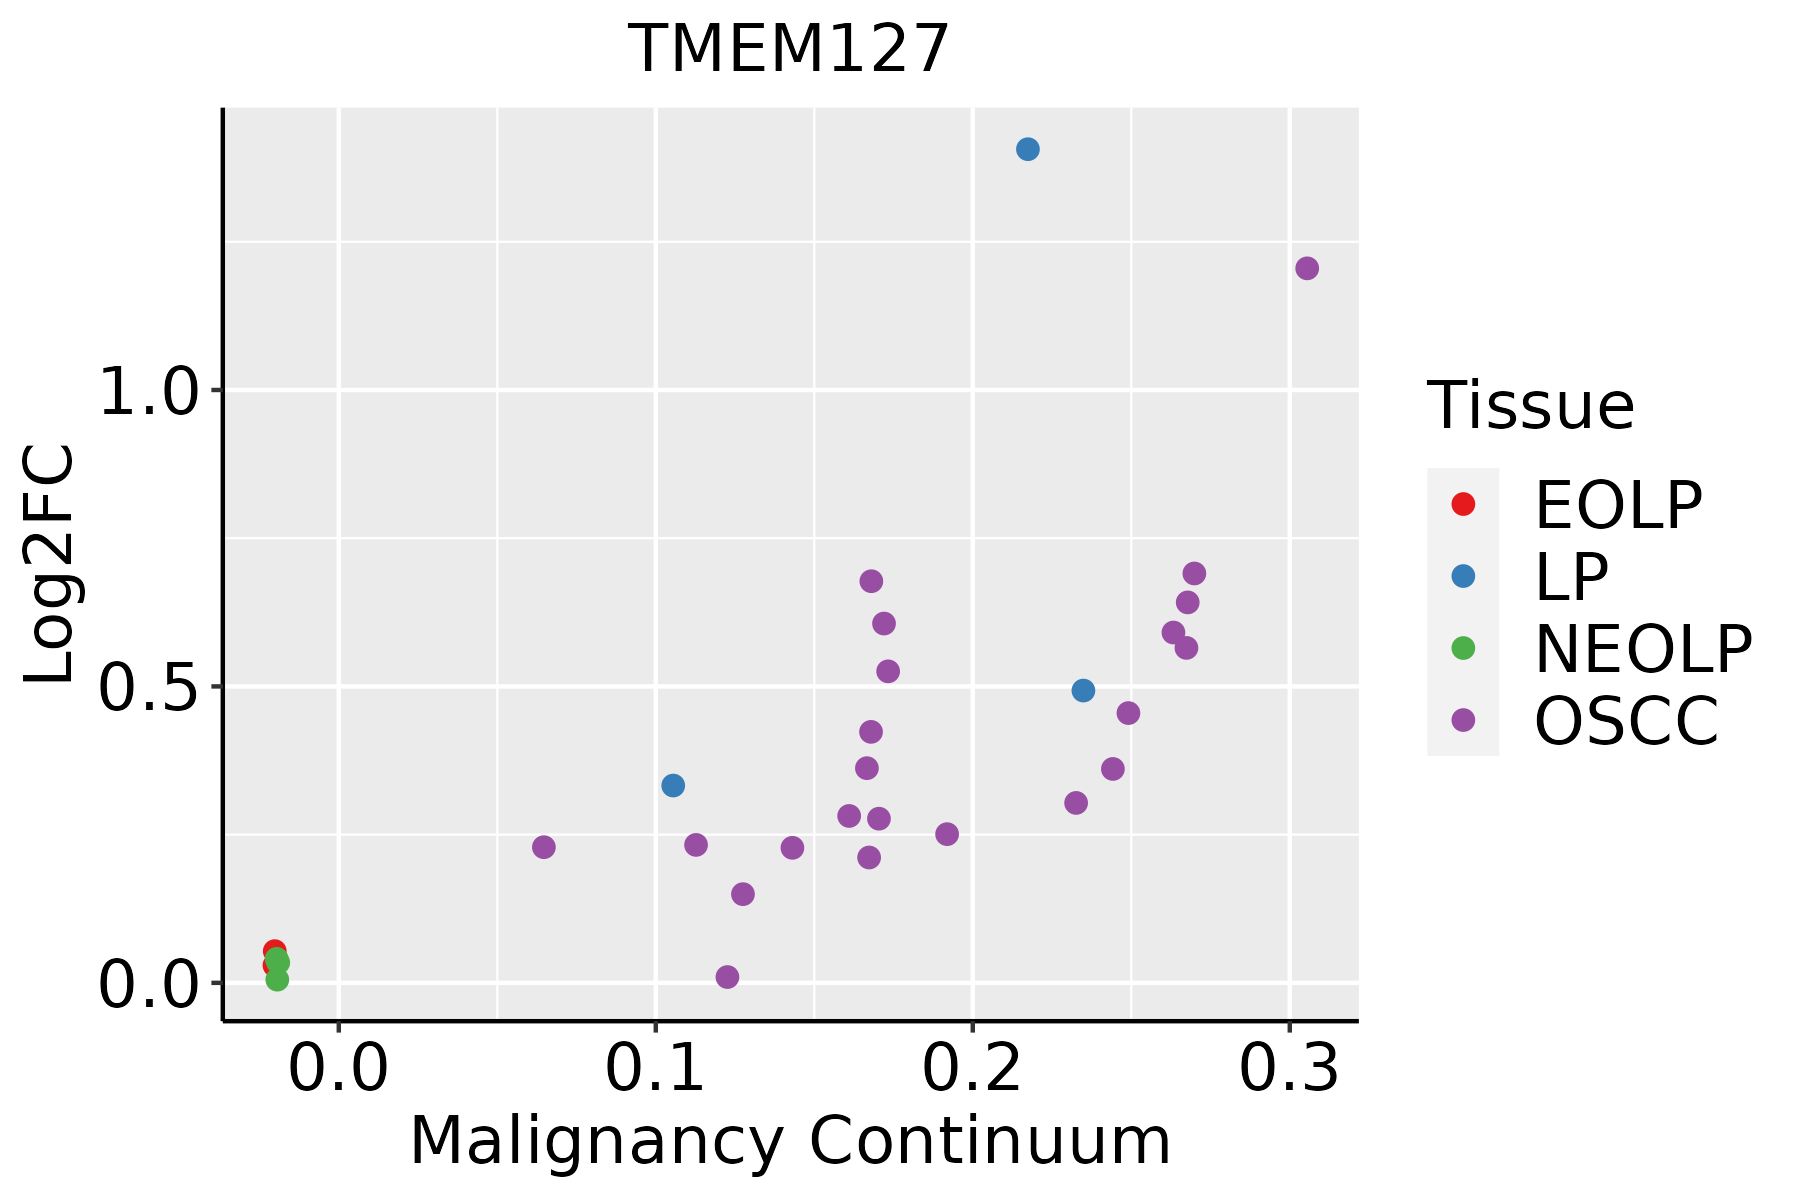 | EOLP: Erosive Oral lichen planus |
| LP: leukoplakia | ||
| NEOLP: Non-erosive oral lichen planus | ||
| OSCC: Oral squamous cell carcinoma |
| ∗log2FC in expression of this searched gene in stem-like cells from each diseased tissue sample relative to stem-like cells in normal samples in each tissue plotted against the malignancy continuum. Samples are colored based on if they are from different disease stage. |
Top |
Malignant transformation related pathway analysis |
| Find out the enriched GO biological processes and KEGG pathways involved in transition from healthy to precancer to cancer |
| Tissue | Disease Stage | Enriched GO biological Processes |
| Colorectum | AD |  |
| Colorectum | SER |  |
| Colorectum | MSS |  |
| Colorectum | MSI-H |  |
| Colorectum | FAP |  |
| ∗Top 15 enriched GO BP terms are showed in the bar plot of each disease state in each tissue. Each row represents a significant GO biological process which is colored according to the -log10(p.adjust). |
| Page: 1 2 3 4 5 6 7 8 9 |
| GO ID | Tissue | Disease Stage | Description | Gene Ratio | Bg Ratio | pvalue | p.adjust | Count |
| GO:0016050 | Colorectum | AD | vesicle organization | 101/3918 | 300/18723 | 1.65e-07 | 7.17e-06 | 101 |
| GO:0007032 | Colorectum | AD | endosome organization | 33/3918 | 82/18723 | 5.30e-05 | 9.01e-04 | 33 |
| GO:00160501 | Colorectum | SER | vesicle organization | 69/2897 | 300/18723 | 3.59e-04 | 5.61e-03 | 69 |
| GO:00070321 | Colorectum | SER | endosome organization | 24/2897 | 82/18723 | 1.11e-03 | 1.28e-02 | 24 |
| GO:00160502 | Colorectum | MSS | vesicle organization | 93/3467 | 300/18723 | 1.04e-07 | 4.97e-06 | 93 |
| GO:00070322 | Colorectum | MSS | endosome organization | 28/3467 | 82/18723 | 5.44e-04 | 6.07e-03 | 28 |
| GO:0031929 | Colorectum | MSS | TOR signaling | 35/3467 | 126/18723 | 6.91e-03 | 4.44e-02 | 35 |
| GO:001605014 | Esophagus | ESCC | vesicle organization | 211/8552 | 300/18723 | 2.85e-18 | 2.87e-16 | 211 |
| GO:000703214 | Esophagus | ESCC | endosome organization | 61/8552 | 82/18723 | 1.13e-07 | 1.85e-06 | 61 |
| GO:00319294 | Esophagus | ESCC | TOR signaling | 79/8552 | 126/18723 | 8.57e-05 | 6.21e-04 | 79 |
| GO:00320061 | Esophagus | ESCC | regulation of TOR signaling | 63/8552 | 104/18723 | 1.55e-03 | 7.29e-03 | 63 |
| GO:001605021 | Liver | HCC | vesicle organization | 194/7958 | 300/18723 | 5.58e-15 | 3.97e-13 | 194 |
| GO:000703211 | Liver | HCC | endosome organization | 61/7958 | 82/18723 | 4.36e-09 | 1.15e-07 | 61 |
| GO:00319291 | Liver | HCC | TOR signaling | 78/7958 | 126/18723 | 8.49e-06 | 9.97e-05 | 78 |
| GO:0032006 | Liver | HCC | regulation of TOR signaling | 63/7958 | 104/18723 | 1.50e-04 | 1.20e-03 | 63 |
| GO:00160508 | Oral cavity | OSCC | vesicle organization | 189/7305 | 300/18723 | 2.40e-17 | 2.14e-15 | 189 |
| GO:00070327 | Oral cavity | OSCC | endosome organization | 59/7305 | 82/18723 | 1.41e-09 | 3.39e-08 | 59 |
| GO:00319293 | Oral cavity | OSCC | TOR signaling | 67/7305 | 126/18723 | 8.52e-04 | 4.50e-03 | 67 |
| GO:001605013 | Oral cavity | LP | vesicle organization | 128/4623 | 300/18723 | 4.96e-12 | 3.98e-10 | 128 |
| GO:000703213 | Oral cavity | LP | endosome organization | 41/4623 | 82/18723 | 6.46e-07 | 1.73e-05 | 41 |
| Page: 1 |
| Pathway ID | Tissue | Disease Stage | Description | Gene Ratio | Bg Ratio | pvalue | p.adjust | qvalue | Count |
| Page: 1 |
Top |
Cell-cell communication analysis |
| Identification of potential cell-cell interactions between two cell types and their ligand-receptor pairs for different disease states |
| Ligand | Receptor | LRpair | Pathway | Tissue | Disease Stage |
| Page: 1 |
Top |
Single-cell gene regulatory network inference analysis |
| Find out the significant the regulons (TFs) and the target genes of each regulon across cell types for different disease states |
| TF | Cell Type | Tissue | Disease Stage | Target Gene | RSS | Regulon Activity |
| ∗The dot plots of a searched regulon are shown for all cell subpopulations in each disease state of each tissue based on the regulon specific score inferred using pySCENIC and by calculating the average expression. |
| Page: 1 |
Top |
Somatic mutation of malignant transformation related genes |
| Annotation of somatic variants for genes involved in malignant transformation |
| Hugo Symbol | Variant Class | Variant Classification | dbSNP RS | HGVSc | HGVSp | HGVSp Short | SWISSPROT | BIOTYPE | SIFT | PolyPhen | Tumor Sample Barcode | Tissue | Histology | Sex | Age | Stage | Therapy Types | Drugs | Outcome |
| TMEM127 | SNV | Missense_Mutation | c.452N>G | p.Ser151Cys | p.S151C | O75204 | protein_coding | deleterious(0) | probably_damaging(0.987) | TCGA-A8-A08L-01 | Breast | breast invasive carcinoma | Female | >=65 | III/IV | Unknown | Unknown | SD | |
| TMEM127 | SNV | Missense_Mutation | c.262N>G | p.Gln88Glu | p.Q88E | O75204 | protein_coding | tolerated(0.19) | possibly_damaging(0.764) | TCGA-JW-A5VL-01 | Cervix | cervical & endocervical cancer | Female | <65 | I/II | Unknown | Unknown | SD | |
| TMEM127 | SNV | Missense_Mutation | rs373951977 | c.665C>T | p.Ala222Val | p.A222V | O75204 | protein_coding | tolerated(0.69) | benign(0.105) | TCGA-EI-6917-01 | Colorectum | rectum adenocarcinoma | Male | <65 | III/IV | Chemotherapy | 5fluorouracil+oxaciplatina+l-folinian | SD |
| TMEM127 | SNV | Missense_Mutation | novel | c.247T>C | p.Phe83Leu | p.F83L | O75204 | protein_coding | tolerated(0.43) | benign(0.031) | TCGA-A5-A1OF-01 | Endometrium | uterine corpus endometrioid carcinoma | Female | <65 | I/II | Unknown | Unknown | SD |
| TMEM127 | SNV | Missense_Mutation | rs149034651 | c.523N>A | p.Val175Ile | p.V175I | O75204 | protein_coding | tolerated(0.38) | benign(0) | TCGA-AX-A05T-01 | Endometrium | uterine corpus endometrioid carcinoma | Female | >=65 | I/II | Unknown | Unknown | SD |
| TMEM127 | SNV | Missense_Mutation | rs747098700 | c.664G>A | p.Ala222Thr | p.A222T | O75204 | protein_coding | tolerated(0.42) | benign(0.005) | TCGA-B5-A1MX-01 | Endometrium | uterine corpus endometrioid carcinoma | Female | <65 | I/II | Hormone Therapy | megace | SD |
| TMEM127 | SNV | Missense_Mutation | rs746883021 | c.379N>T | p.Arg127Cys | p.R127C | O75204 | protein_coding | deleterious(0) | benign(0.001) | TCGA-B5-A3FC-01 | Endometrium | uterine corpus endometrioid carcinoma | Female | <65 | I/II | Unknown | Unknown | SD |
| TMEM127 | SNV | Missense_Mutation | novel | c.275N>C | p.Leu92Pro | p.L92P | O75204 | protein_coding | deleterious(0) | probably_damaging(0.991) | TCGA-BS-A0UF-01 | Endometrium | uterine corpus endometrioid carcinoma | Female | >=65 | I/II | Unknown | Unknown | SD |
| TMEM127 | SNV | Missense_Mutation | rs753594901 | c.520N>A | p.Ala174Thr | p.A174T | O75204 | protein_coding | tolerated(0.12) | possibly_damaging(0.746) | TCGA-EY-A1GU-01 | Endometrium | uterine corpus endometrioid carcinoma | Female | >=65 | I/II | Unknown | Unknown | SD |
| TMEM127 | SNV | Missense_Mutation | novel | c.526N>C | p.Ser176Arg | p.S176R | O75204 | protein_coding | deleterious(0.01) | probably_damaging(0.986) | TCGA-FI-A2D0-01 | Endometrium | uterine corpus endometrioid carcinoma | Female | <65 | I/II | Unknown | Unknown | SD |
| Page: 1 2 3 |
Top |
Related drugs of malignant transformation related genes |
| Identification of chemicals and drugs interact with genes involved in malignant transfromation |
| (DGIdb 4.0) |
| Entrez ID | Symbol | Category | Interaction Types | Drug Claim Name | Drug Name | PMIDs |
| Page: 1 |

Copyright 2023-Present -The University of Texas Health Science Center at Houston |