
|
|||||
|
 | |
| |
| |
| |
| |
| |
|
Gene: TMCO3 |
Gene summary for TMCO3 |
| Gene information | Species | Human | Gene symbol | TMCO3 | Gene ID | 55002 |
| Gene name | transmembrane and coiled-coil domains 3 | |
| Gene Alias | C13orf11 | |
| Cytomap | 13q34 | |
| Gene Type | protein-coding | GO ID | GO:0006810 | UniProtAcc | A0A024RE09 |
Top |
Malignant transformation analysis |
| Identification of the aberrant gene expression in precancerous and cancerous lesions by comparing the gene expression of stem-like cells in diseased tissues with normal stem cells |
| Entrez ID | Symbol | Replicates | Species | Organ | Tissue | Adj P-value | Log2FC | Malignancy |
| 55002 | TMCO3 | C06 | Human | Oral cavity | OSCC | 3.60e-10 | 1.31e+00 | 0.2699 |
| 55002 | TMCO3 | C08 | Human | Oral cavity | OSCC | 2.28e-21 | 4.54e-01 | 0.1919 |
| 55002 | TMCO3 | C09 | Human | Oral cavity | OSCC | 1.29e-12 | 4.71e-01 | 0.1431 |
| 55002 | TMCO3 | LN46 | Human | Oral cavity | OSCC | 8.63e-03 | 2.56e-01 | 0.1666 |
| 55002 | TMCO3 | LP15 | Human | Oral cavity | LP | 1.68e-02 | 8.09e-01 | 0.2174 |
| 55002 | TMCO3 | SYSMH1 | Human | Oral cavity | OSCC | 1.44e-10 | 2.58e-01 | 0.1127 |
| 55002 | TMCO3 | SYSMH2 | Human | Oral cavity | OSCC | 5.42e-05 | 2.54e-01 | 0.2326 |
| 55002 | TMCO3 | SYSMH3 | Human | Oral cavity | OSCC | 1.52e-02 | 1.30e-01 | 0.2442 |
| 55002 | TMCO3 | SYSMH5 | Human | Oral cavity | OSCC | 9.85e-03 | 1.09e-01 | 0.0647 |
| 55002 | TMCO3 | SYSMH6 | Human | Oral cavity | OSCC | 6.17e-12 | 2.96e-01 | 0.1275 |
| 55002 | TMCO3 | P5_S10_cSCC | Human | Skin | cSCC | 7.68e-03 | 7.75e-02 | -0.299 |
| 55002 | TMCO3 | P1_cSCC | Human | Skin | cSCC | 1.42e-05 | 3.50e-01 | 0.0292 |
| 55002 | TMCO3 | P2_cSCC | Human | Skin | cSCC | 4.16e-09 | 2.66e-01 | -0.024 |
| 55002 | TMCO3 | P4_cSCC | Human | Skin | cSCC | 1.12e-02 | 1.89e-01 | -0.00290000000000005 |
| 55002 | TMCO3 | P10_cSCC | Human | Skin | cSCC | 1.68e-17 | 6.05e-01 | 0.1017 |
| 55002 | TMCO3 | male-WTA | Human | Thyroid | PTC | 2.50e-02 | 1.27e-02 | 0.1037 |
| 55002 | TMCO3 | PTC01 | Human | Thyroid | PTC | 2.81e-02 | 1.67e-02 | 0.1899 |
| 55002 | TMCO3 | PTC04 | Human | Thyroid | PTC | 5.81e-06 | 8.40e-02 | 0.1927 |
| 55002 | TMCO3 | PTC06 | Human | Thyroid | PTC | 1.60e-05 | 1.11e-01 | 0.2057 |
| 55002 | TMCO3 | PTC07 | Human | Thyroid | PTC | 4.69e-04 | 3.78e-02 | 0.2044 |
| Page: 1 2 3 4 5 6 |
| Tissue | Expression Dynamics | Abbreviation |
| Esophagus | 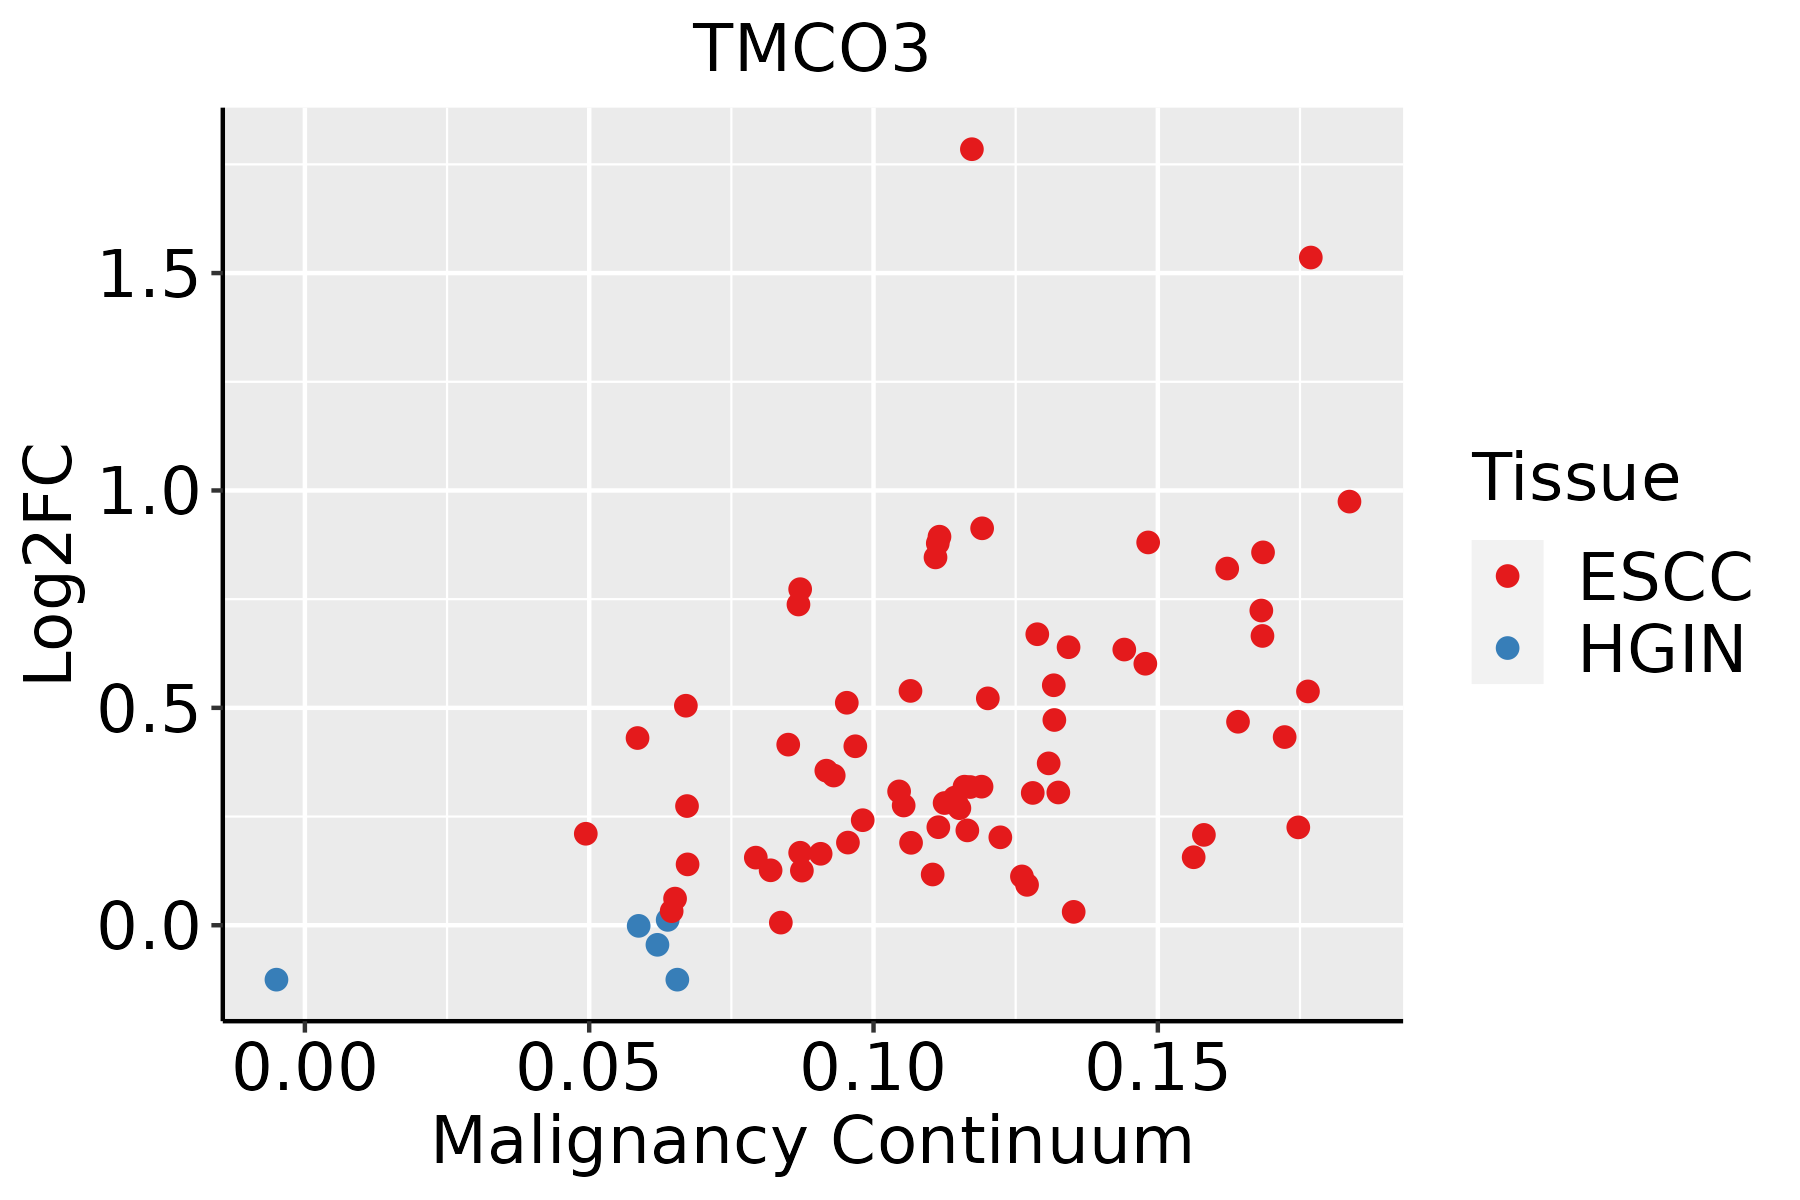 | ESCC: Esophageal squamous cell carcinoma |
| HGIN: High-grade intraepithelial neoplasias | ||
| LGIN: Low-grade intraepithelial neoplasias | ||
| Liver | 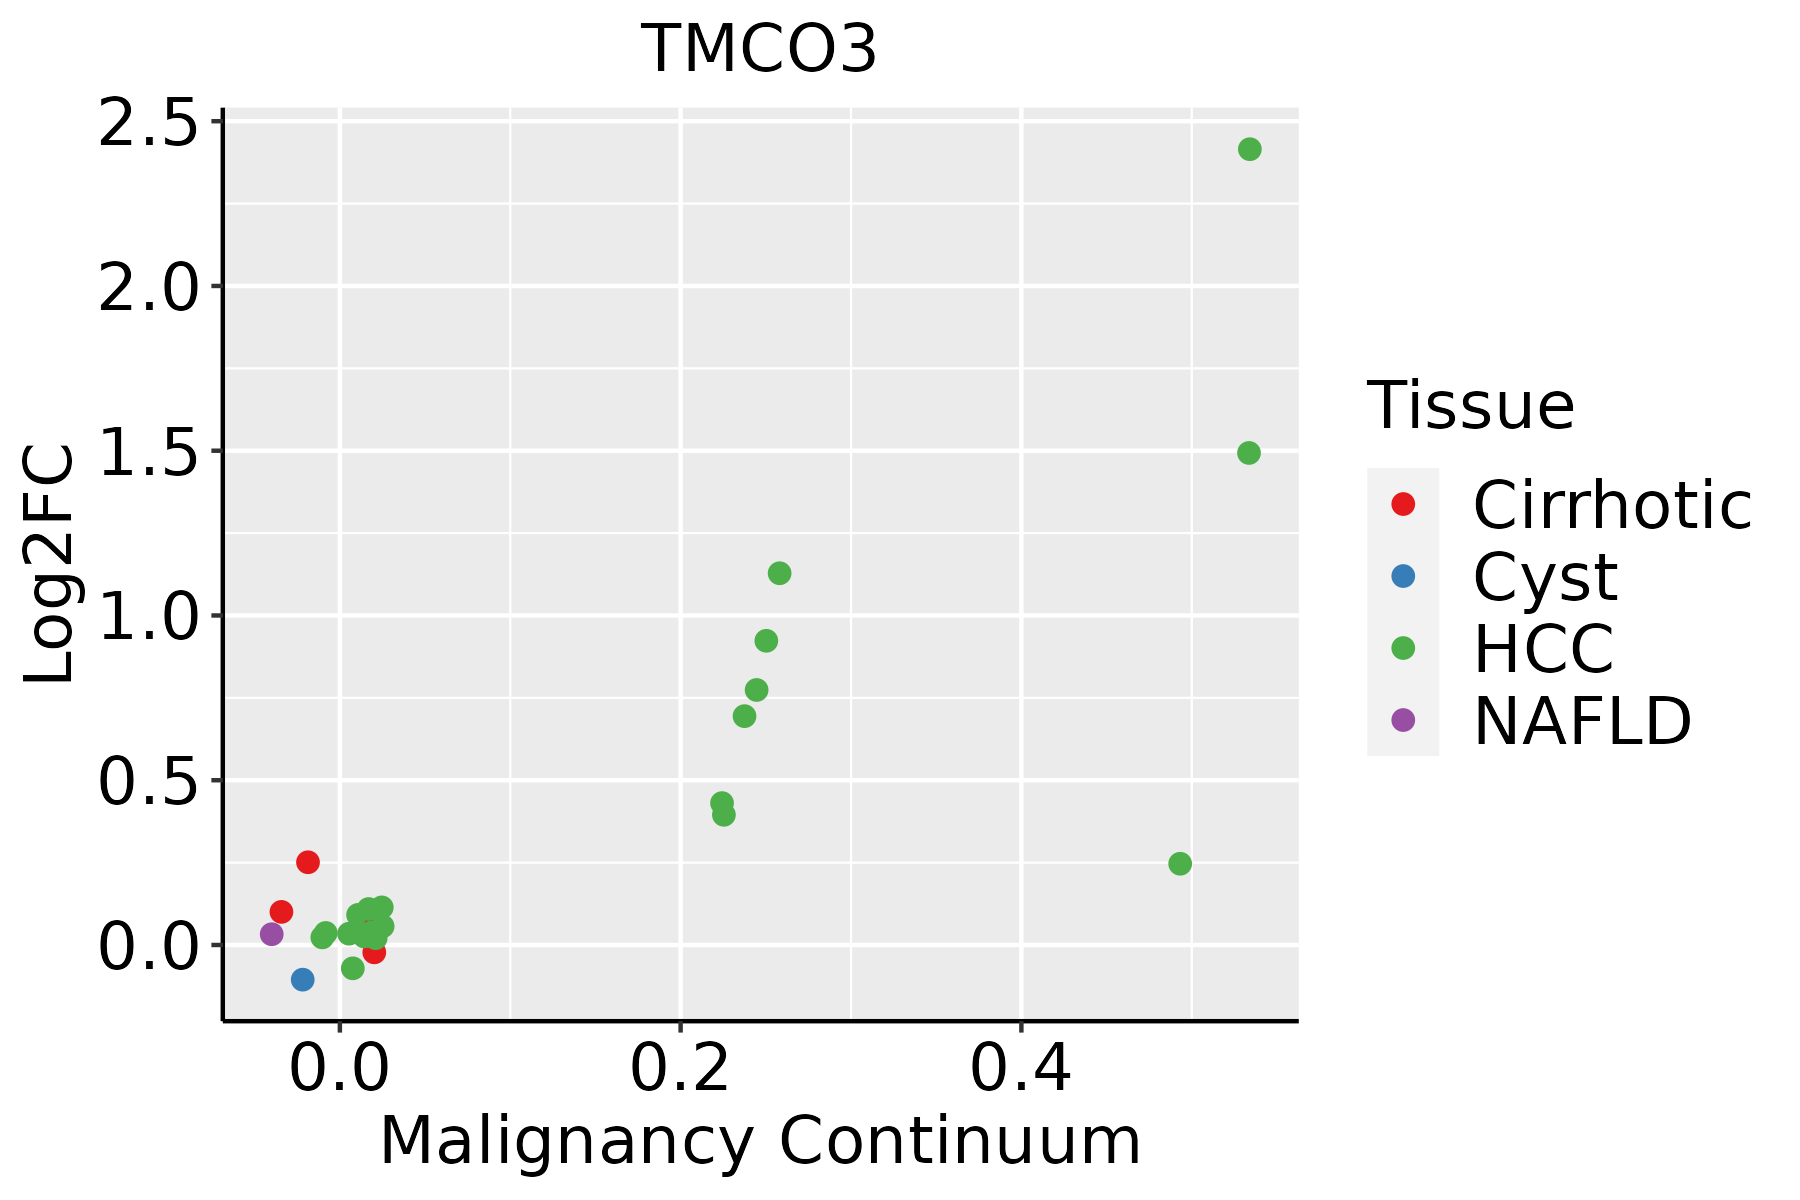 | HCC: Hepatocellular carcinoma |
| NAFLD: Non-alcoholic fatty liver disease | ||
| Oral Cavity | 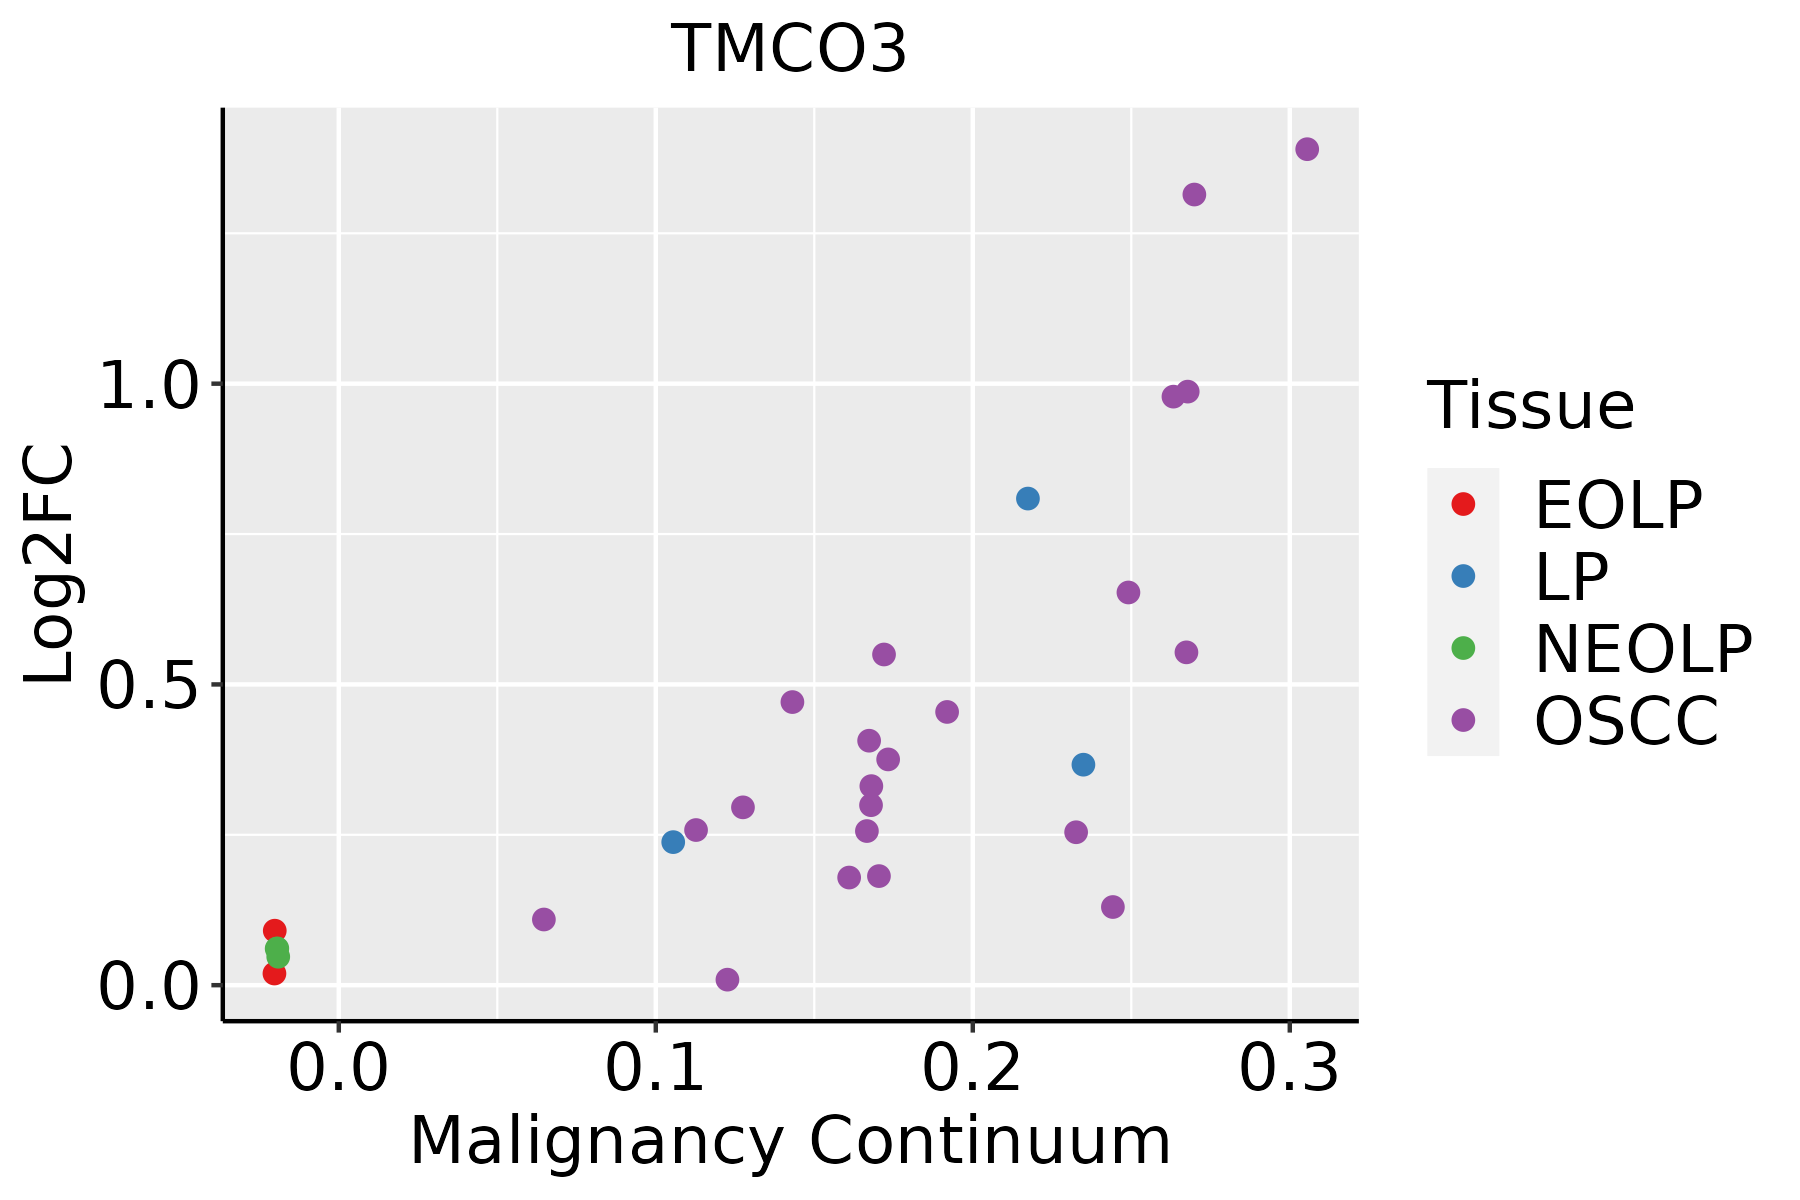 | EOLP: Erosive Oral lichen planus |
| LP: leukoplakia | ||
| NEOLP: Non-erosive oral lichen planus | ||
| OSCC: Oral squamous cell carcinoma | ||
| Skin | 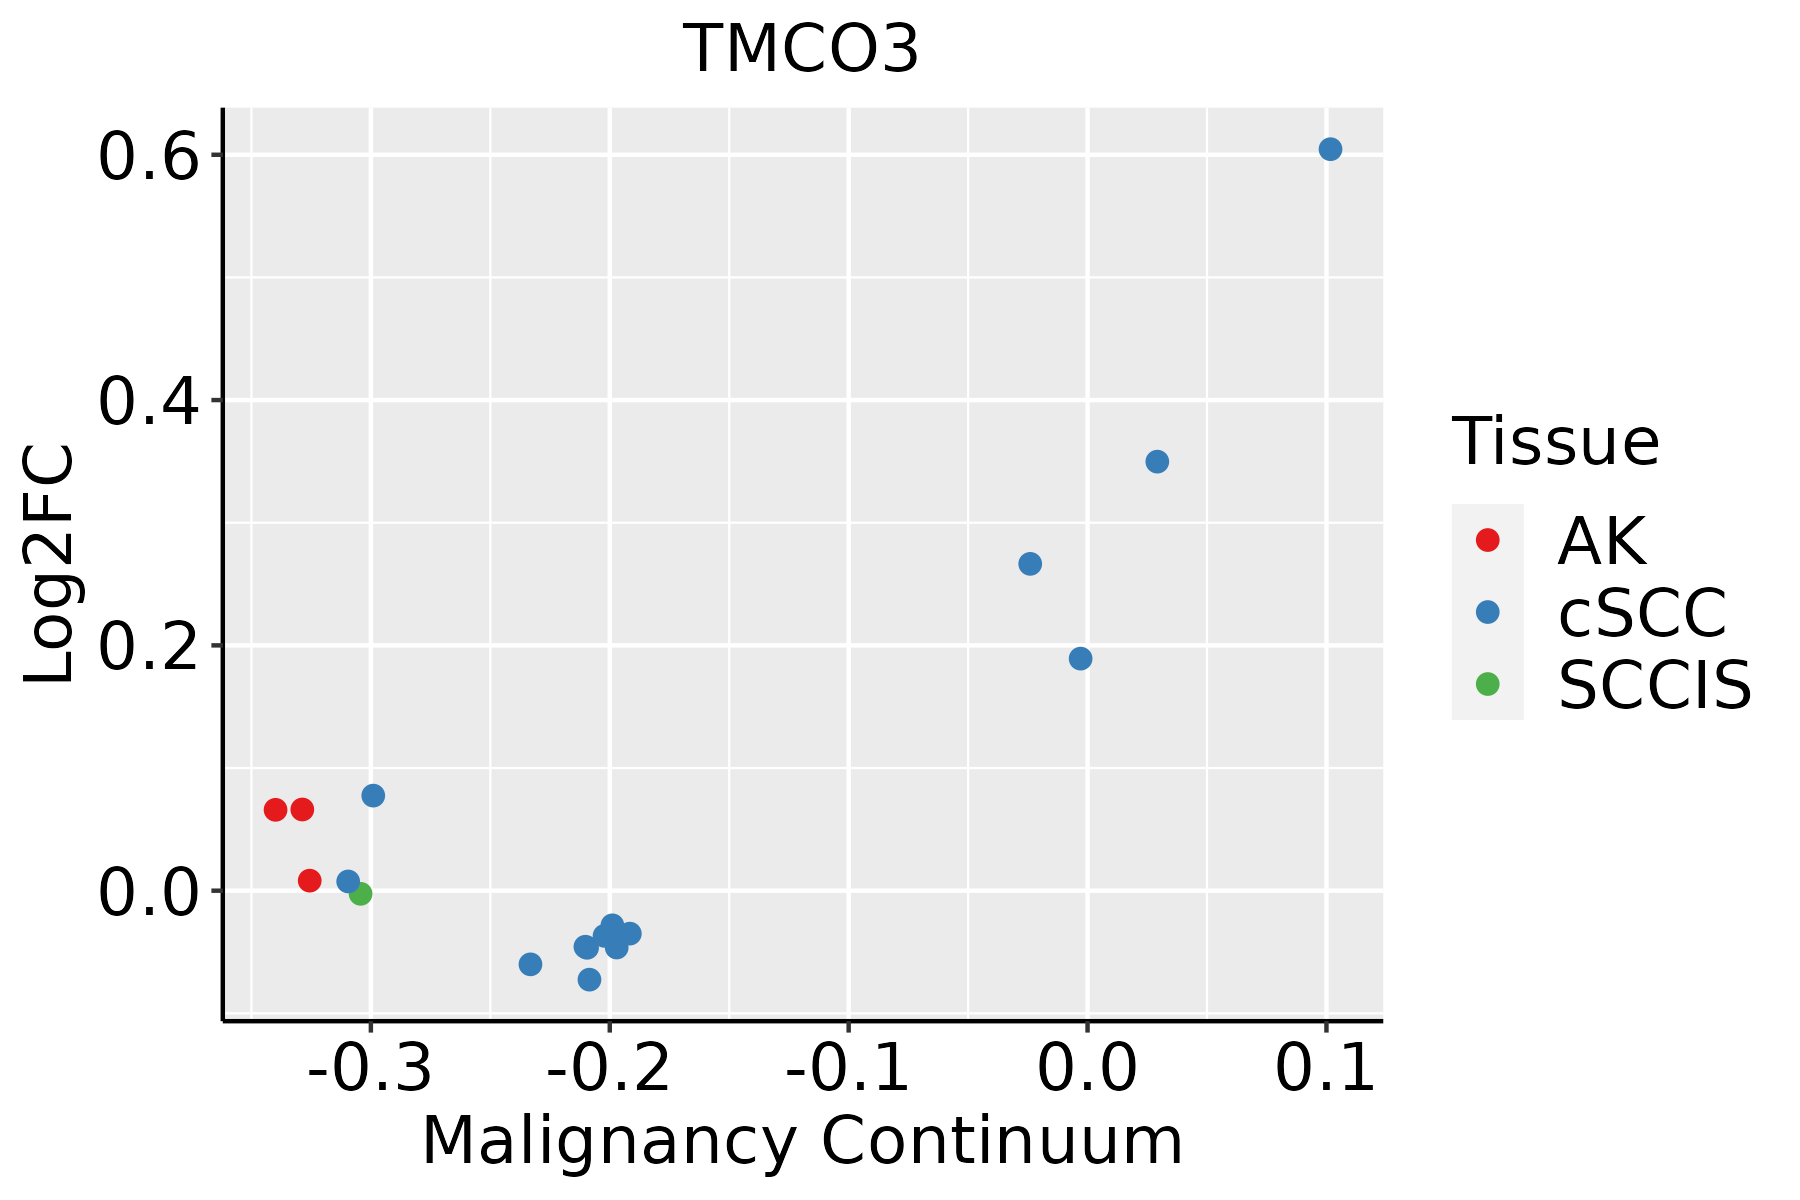 | AK: Actinic keratosis |
| cSCC: Cutaneous squamous cell carcinoma | ||
| SCCIS:squamous cell carcinoma in situ | ||
| Thyroid | 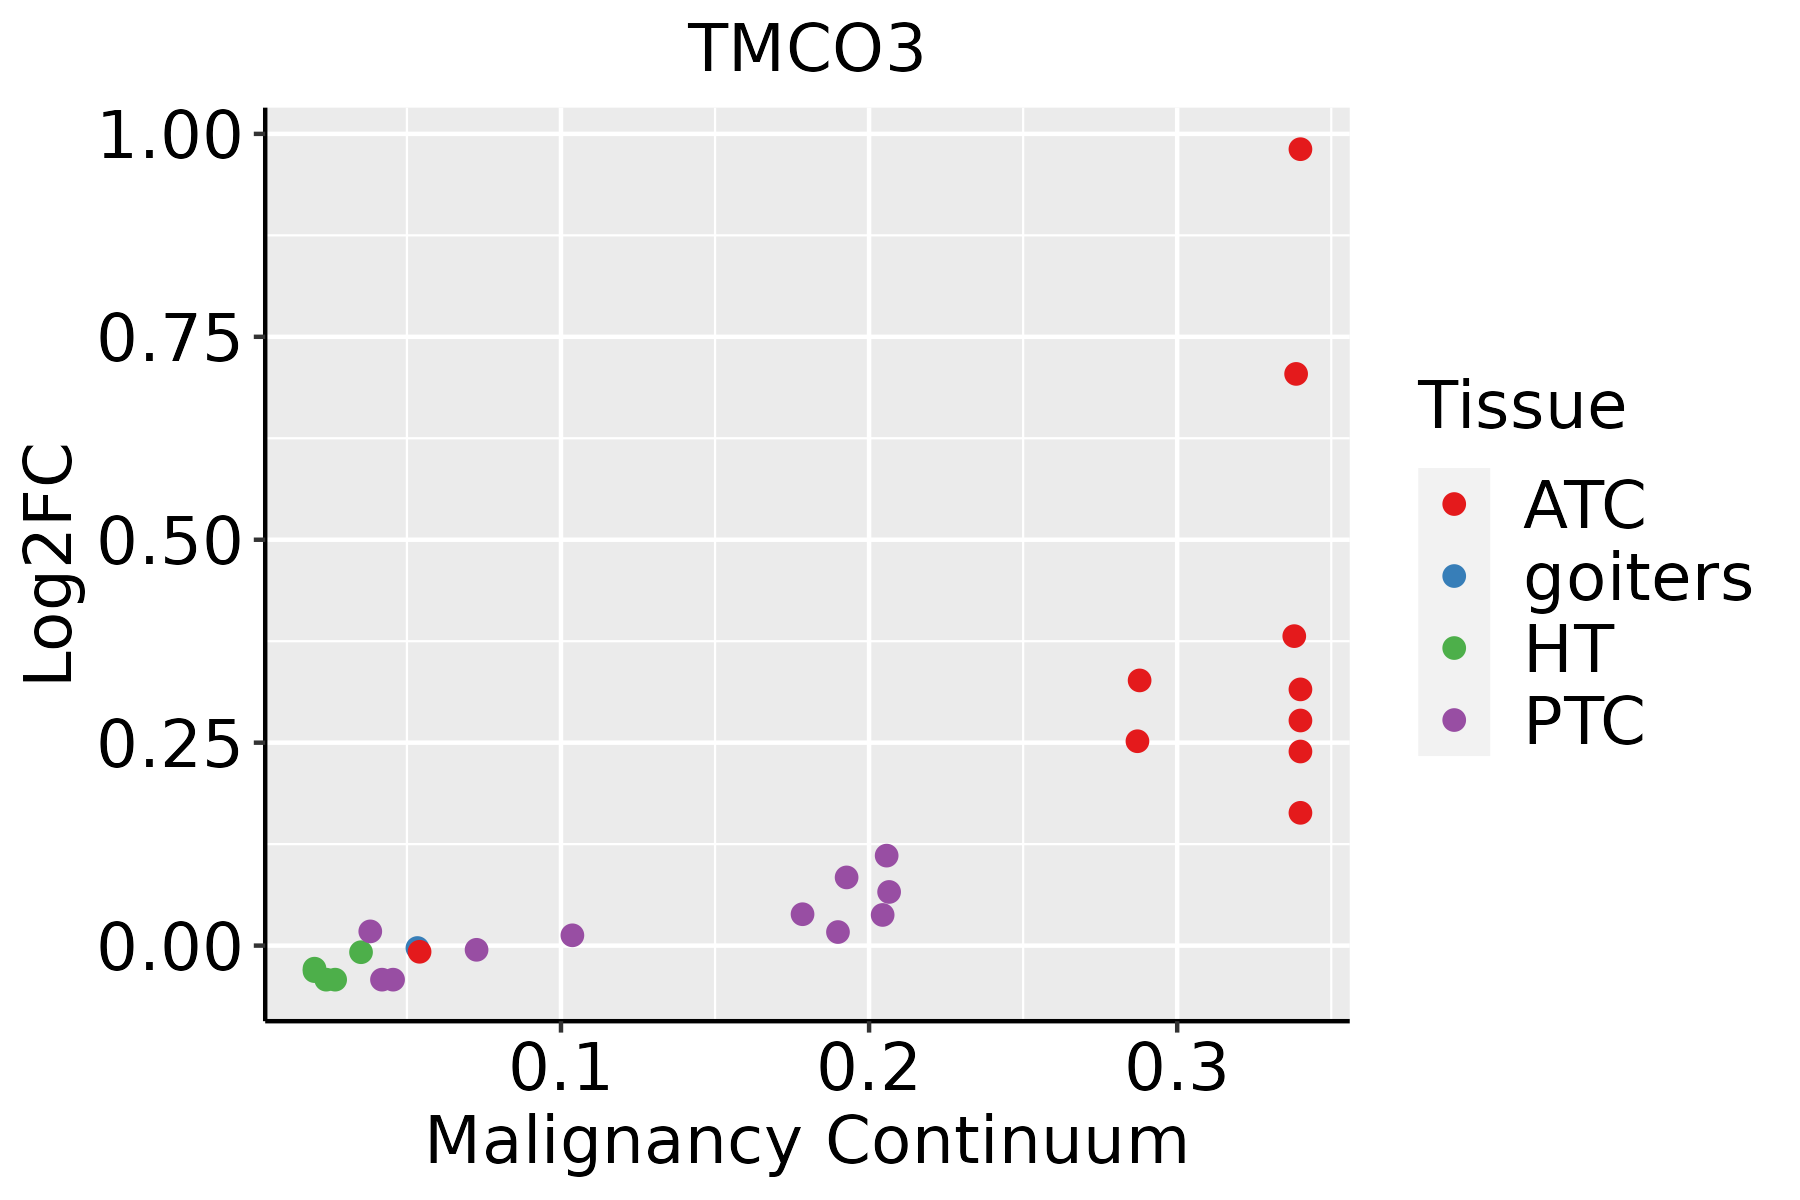 | ATC: Anaplastic thyroid cancer |
| HT: Hashimoto's thyroiditis | ||
| PTC: Papillary thyroid cancer |
| ∗log2FC in expression of this searched gene in stem-like cells from each diseased tissue sample relative to stem-like cells in normal samples in each tissue plotted against the malignancy continuum. Samples are colored based on if they are from different disease stage. |
Top |
Malignant transformation related pathway analysis |
| Find out the enriched GO biological processes and KEGG pathways involved in transition from healthy to precancer to cancer |
| Tissue | Disease Stage | Enriched GO biological Processes |
| Colorectum | AD |  |
| Colorectum | SER |  |
| Colorectum | MSS |  |
| Colorectum | MSI-H |  |
| Colorectum | FAP |  |
| ∗Top 15 enriched GO BP terms are showed in the bar plot of each disease state in each tissue. Each row represents a significant GO biological process which is colored according to the -log10(p.adjust). |
| Page: 1 2 3 4 5 6 7 8 9 |
| GO ID | Tissue | Disease Stage | Description | Gene Ratio | Bg Ratio | pvalue | p.adjust | Count |
| GO:190260018 | Esophagus | ESCC | proton transmembrane transport | 88/8552 | 157/18723 | 5.62e-03 | 2.10e-02 | 88 |
| GO:19026007 | Liver | HCC | proton transmembrane transport | 87/7958 | 157/18723 | 7.27e-04 | 4.42e-03 | 87 |
| GO:1902600110 | Skin | cSCC | proton transmembrane transport | 57/4864 | 157/18723 | 2.66e-03 | 1.50e-02 | 57 |
| GO:1902600111 | Thyroid | PTC | proton transmembrane transport | 72/5968 | 157/18723 | 1.64e-04 | 1.26e-03 | 72 |
| GO:190260032 | Thyroid | ATC | proton transmembrane transport | 73/6293 | 157/18723 | 5.25e-04 | 3.06e-03 | 73 |
| Page: 1 |
| Pathway ID | Tissue | Disease Stage | Description | Gene Ratio | Bg Ratio | pvalue | p.adjust | qvalue | Count |
| Page: 1 |
Top |
Cell-cell communication analysis |
| Identification of potential cell-cell interactions between two cell types and their ligand-receptor pairs for different disease states |
| Ligand | Receptor | LRpair | Pathway | Tissue | Disease Stage |
| Page: 1 |
Top |
Single-cell gene regulatory network inference analysis |
| Find out the significant the regulons (TFs) and the target genes of each regulon across cell types for different disease states |
| TF | Cell Type | Tissue | Disease Stage | Target Gene | RSS | Regulon Activity |
| ∗The dot plots of a searched regulon are shown for all cell subpopulations in each disease state of each tissue based on the regulon specific score inferred using pySCENIC and by calculating the average expression. |
| Page: 1 |
Top |
Somatic mutation of malignant transformation related genes |
| Annotation of somatic variants for genes involved in malignant transformation |
| Hugo Symbol | Variant Class | Variant Classification | dbSNP RS | HGVSc | HGVSp | HGVSp Short | SWISSPROT | BIOTYPE | SIFT | PolyPhen | Tumor Sample Barcode | Tissue | Histology | Sex | Age | Stage | Therapy Types | Drugs | Outcome |
| TMCO3 | SNV | Missense_Mutation | c.1915N>T | p.Arg639Trp | p.R639W | Q6UWJ1 | protein_coding | deleterious(0) | probably_damaging(1) | TCGA-AR-A0TW-01 | Breast | breast invasive carcinoma | Female | <65 | III/IV | Chemotherapy | doxorubicin | PD | |
| TMCO3 | SNV | Missense_Mutation | c.1492G>C | p.Glu498Gln | p.E498Q | Q6UWJ1 | protein_coding | deleterious(0) | probably_damaging(0.997) | TCGA-C8-A12T-01 | Breast | breast invasive carcinoma | Female | <65 | I/II | Unknown | Unknown | SD | |
| TMCO3 | SNV | Missense_Mutation | c.583G>C | p.Glu195Gln | p.E195Q | Q6UWJ1 | protein_coding | tolerated(0.09) | possibly_damaging(0.601) | TCGA-D8-A1J8-01 | Breast | breast invasive carcinoma | Female | >=65 | I/II | Hormone Therapy | nolvadex | SD | |
| TMCO3 | SNV | Missense_Mutation | rs755051458 | c.139N>T | p.Arg47Trp | p.R47W | Q6UWJ1 | protein_coding | deleterious(0.01) | benign(0.405) | TCGA-D8-A1XZ-01 | Breast | breast invasive carcinoma | Female | >=65 | III/IV | Hormone Therapy | tamoxiphen+anastrozolum | SD |
| TMCO3 | SNV | Missense_Mutation | c.746A>T | p.Gln249Leu | p.Q249L | Q6UWJ1 | protein_coding | tolerated(0.19) | benign(0.039) | TCGA-E2-A1LB-01 | Breast | breast invasive carcinoma | Female | <65 | I/II | Chemotherapy | cytoxan | SD | |
| TMCO3 | SNV | Missense_Mutation | c.1390N>G | p.Leu464Val | p.L464V | Q6UWJ1 | protein_coding | tolerated(0.08) | possibly_damaging(0.46) | TCGA-EW-A1J5-01 | Breast | breast invasive carcinoma | Female | <65 | I/II | Chemotherapy | adriamycin | SD | |
| TMCO3 | insertion | Frame_Shift_Ins | novel | c.1183_1184insCTTCACAAAAGCTCAGCTCTGCCTCCTT | p.Val395AlafsTer21 | p.V395Afs*21 | Q6UWJ1 | protein_coding | TCGA-AO-A0J5-01 | Breast | breast invasive carcinoma | Female | <65 | III/IV | Other, specify in notesBisphosphonate | zoledronic | PD | ||
| TMCO3 | SNV | Missense_Mutation | rs761196028 | c.1888C>T | p.Arg630Trp | p.R630W | Q6UWJ1 | protein_coding | deleterious(0) | probably_damaging(1) | TCGA-2W-A8YY-01 | Cervix | cervical & endocervical cancer | Female | <65 | I/II | Chemotherapy | cisplatin | CR |
| TMCO3 | SNV | Missense_Mutation | novel | c.1730N>T | p.Thr577Met | p.T577M | Q6UWJ1 | protein_coding | deleterious(0.01) | possibly_damaging(0.863) | TCGA-EA-A3HU-01 | Cervix | cervical & endocervical cancer | Female | <65 | I/II | Unknown | Unknown | SD |
| TMCO3 | SNV | Missense_Mutation | rs550159257 | c.1906G>A | p.Val636Ile | p.V636I | Q6UWJ1 | protein_coding | tolerated(1) | benign(0) | TCGA-A6-6780-01 | Colorectum | colon adenocarcinoma | Male | >=65 | I/II | Unknown | Unknown | SD |
| Page: 1 2 3 4 5 6 7 8 |
Top |
Related drugs of malignant transformation related genes |
| Identification of chemicals and drugs interact with genes involved in malignant transfromation |
| (DGIdb 4.0) |
| Entrez ID | Symbol | Category | Interaction Types | Drug Claim Name | Drug Name | PMIDs |
| Page: 1 |

Copyright 2023-Present -The University of Texas Health Science Center at Houston |