
|
|||||
|
 | |
| |
| |
| |
| |
| |
|
Gene: TIMM23 |
Gene summary for TIMM23 |
| Gene information | Species | Human | Gene symbol | TIMM23 | Gene ID | 100287932 |
| Gene name | translocase of inner mitochondrial membrane 23 | |
| Gene Alias | TIM23 | |
| Cytomap | 10q11.22 | |
| Gene Type | protein-coding | GO ID | GO:0006605 | UniProtAcc | O14925 |
Top |
Malignant transformation analysis |
| Identification of the aberrant gene expression in precancerous and cancerous lesions by comparing the gene expression of stem-like cells in diseased tissues with normal stem cells |
| Entrez ID | Symbol | Replicates | Species | Organ | Tissue | Adj P-value | Log2FC | Malignancy |
| 100287932 | TIMM23 | C43 | Human | Oral cavity | OSCC | 3.11e-10 | 2.80e-01 | 0.1704 |
| 100287932 | TIMM23 | C46 | Human | Oral cavity | OSCC | 2.84e-20 | 5.13e-01 | 0.1673 |
| 100287932 | TIMM23 | C51 | Human | Oral cavity | OSCC | 1.44e-07 | 5.04e-01 | 0.2674 |
| 100287932 | TIMM23 | C57 | Human | Oral cavity | OSCC | 5.08e-15 | 4.71e-01 | 0.1679 |
| 100287932 | TIMM23 | C06 | Human | Oral cavity | OSCC | 1.18e-09 | 1.52e+00 | 0.2699 |
| 100287932 | TIMM23 | C07 | Human | Oral cavity | OSCC | 3.77e-03 | 7.49e-01 | 0.2491 |
| 100287932 | TIMM23 | C08 | Human | Oral cavity | OSCC | 8.43e-25 | 5.88e-01 | 0.1919 |
| 100287932 | TIMM23 | C09 | Human | Oral cavity | OSCC | 3.99e-03 | 2.13e-01 | 0.1431 |
| 100287932 | TIMM23 | LN22 | Human | Oral cavity | OSCC | 4.23e-12 | 9.62e-01 | 0.1733 |
| 100287932 | TIMM23 | LN38 | Human | Oral cavity | OSCC | 5.87e-04 | 1.03e+00 | 0.168 |
| 100287932 | TIMM23 | LN46 | Human | Oral cavity | OSCC | 5.57e-12 | 5.48e-01 | 0.1666 |
| 100287932 | TIMM23 | LP15 | Human | Oral cavity | LP | 2.63e-04 | 8.62e-01 | 0.2174 |
| 100287932 | TIMM23 | LP17 | Human | Oral cavity | LP | 3.09e-02 | 5.49e-01 | 0.2349 |
| 100287932 | TIMM23 | SYSMH1 | Human | Oral cavity | OSCC | 5.56e-03 | 1.87e-01 | 0.1127 |
| 100287932 | TIMM23 | SYSMH2 | Human | Oral cavity | OSCC | 1.48e-08 | 3.72e-01 | 0.2326 |
| 100287932 | TIMM23 | SYSMH3 | Human | Oral cavity | OSCC | 5.26e-17 | 4.54e-01 | 0.2442 |
| 100287932 | TIMM23 | P5_S10_cSCC | Human | Skin | cSCC | 2.21e-02 | 8.24e-02 | -0.299 |
| 100287932 | TIMM23 | P1_cSCC | Human | Skin | cSCC | 2.39e-11 | 5.09e-01 | 0.0292 |
| 100287932 | TIMM23 | P2_cSCC | Human | Skin | cSCC | 4.04e-06 | 2.90e-01 | -0.024 |
| 100287932 | TIMM23 | P4_cSCC | Human | Skin | cSCC | 3.42e-24 | 4.96e-01 | -0.00290000000000005 |
| Page: 1 2 3 4 5 6 |
| Tissue | Expression Dynamics | Abbreviation |
| Esophagus | 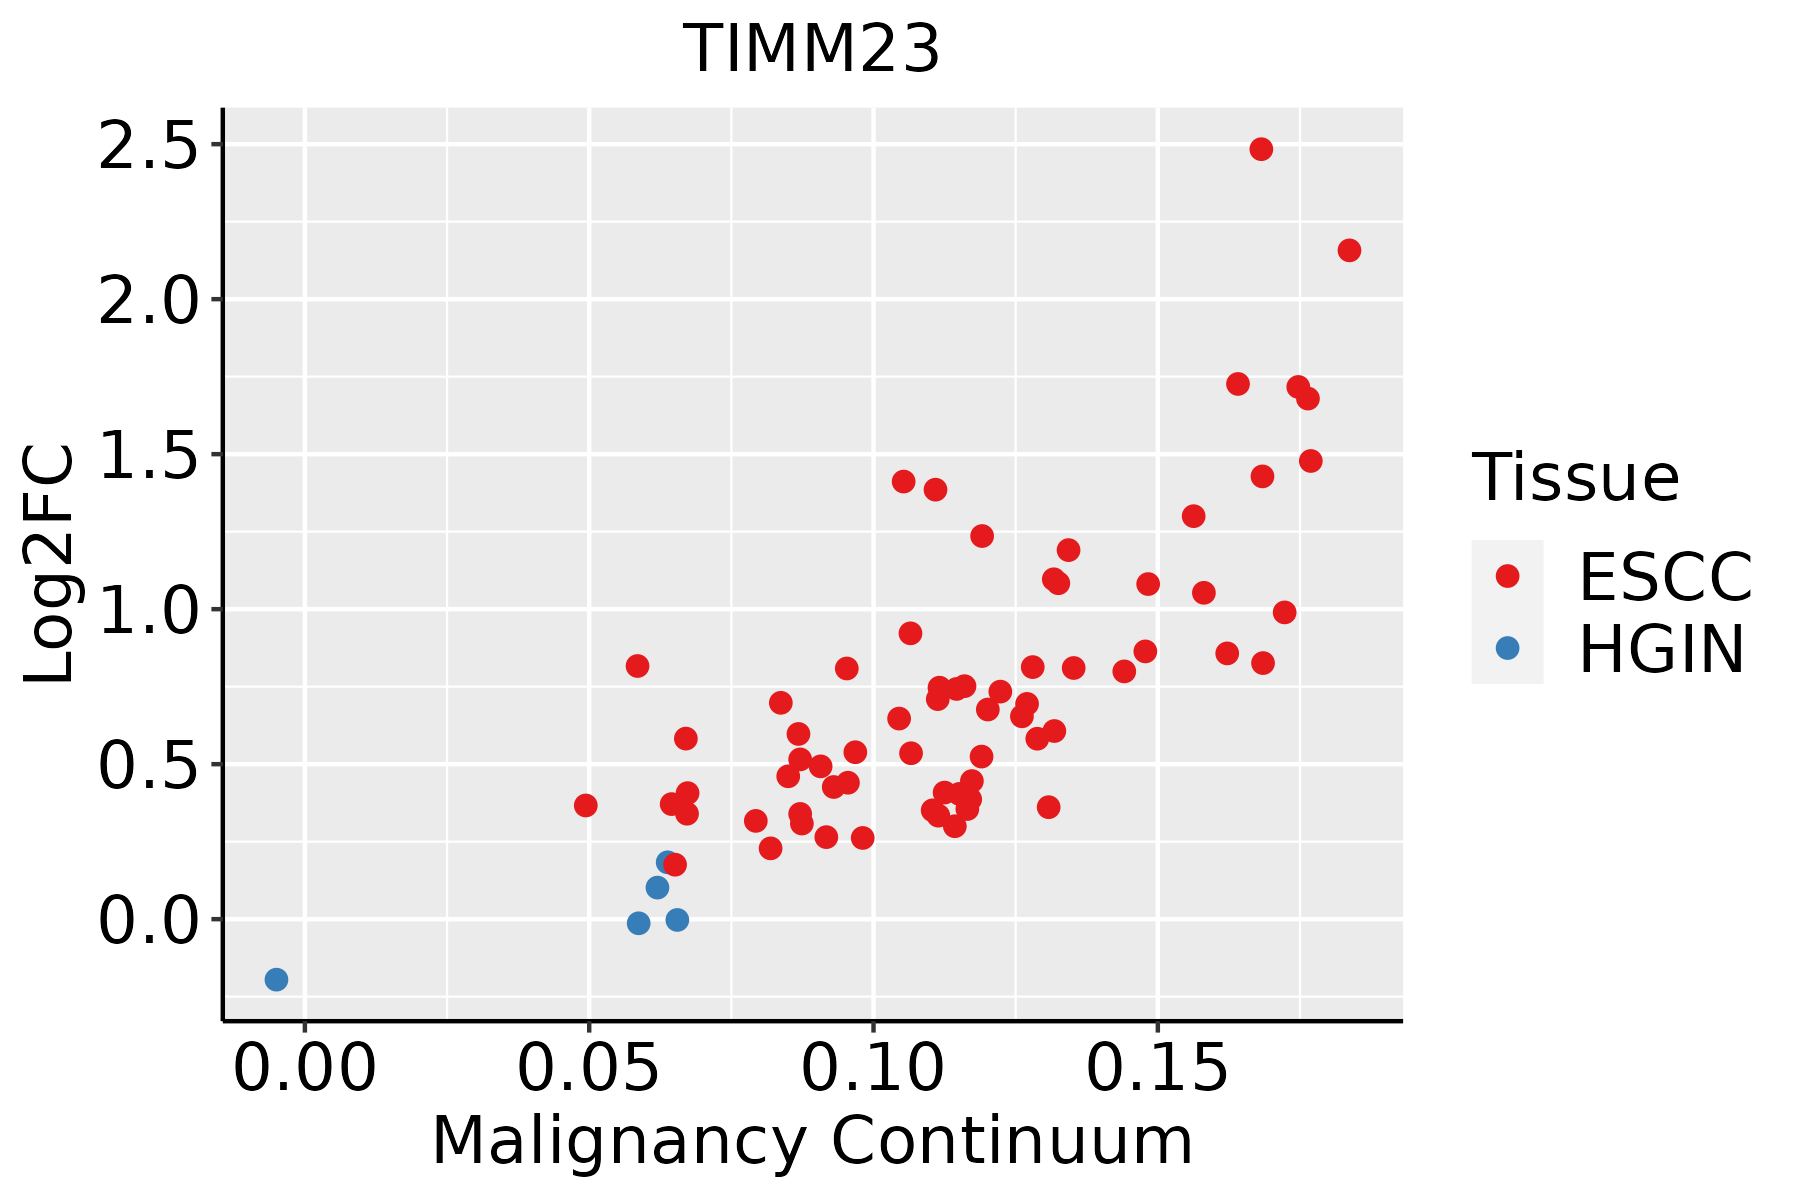 | ESCC: Esophageal squamous cell carcinoma |
| HGIN: High-grade intraepithelial neoplasias | ||
| LGIN: Low-grade intraepithelial neoplasias | ||
| Liver |  | HCC: Hepatocellular carcinoma |
| NAFLD: Non-alcoholic fatty liver disease | ||
| Oral Cavity |  | EOLP: Erosive Oral lichen planus |
| LP: leukoplakia | ||
| NEOLP: Non-erosive oral lichen planus | ||
| OSCC: Oral squamous cell carcinoma | ||
| Skin |  | AK: Actinic keratosis |
| cSCC: Cutaneous squamous cell carcinoma | ||
| SCCIS:squamous cell carcinoma in situ |
| ∗log2FC in expression of this searched gene in stem-like cells from each diseased tissue sample relative to stem-like cells in normal samples in each tissue plotted against the malignancy continuum. Samples are colored based on if they are from different disease stage. |
Top |
Malignant transformation related pathway analysis |
| Find out the enriched GO biological processes and KEGG pathways involved in transition from healthy to precancer to cancer |
| Tissue | Disease Stage | Enriched GO biological Processes |
| Colorectum | AD |  |
| Colorectum | SER |  |
| Colorectum | MSS |  |
| Colorectum | MSI-H |  |
| Colorectum | FAP |  |
| ∗Top 15 enriched GO BP terms are showed in the bar plot of each disease state in each tissue. Each row represents a significant GO biological process which is colored according to the -log10(p.adjust). |
| Page: 1 2 3 4 5 6 7 8 9 |
| GO ID | Tissue | Disease Stage | Description | Gene Ratio | Bg Ratio | pvalue | p.adjust | Count |
| GO:0006839 | Colorectum | AD | mitochondrial transport | 102/3918 | 254/18723 | 1.87e-12 | 3.08e-10 | 102 |
| GO:0072594 | Colorectum | AD | establishment of protein localization to organelle | 148/3918 | 422/18723 | 7.95e-12 | 1.04e-09 | 148 |
| GO:1990542 | Colorectum | AD | mitochondrial transmembrane transport | 47/3918 | 102/18723 | 1.09e-08 | 6.52e-07 | 47 |
| GO:0006605 | Colorectum | AD | protein targeting | 105/3918 | 314/18723 | 1.39e-07 | 6.44e-06 | 105 |
| GO:0070585 | Colorectum | AD | protein localization to mitochondrion | 51/3918 | 125/18723 | 3.40e-07 | 1.33e-05 | 51 |
| GO:0072655 | Colorectum | AD | establishment of protein localization to mitochondrion | 47/3918 | 120/18723 | 3.76e-06 | 1.04e-04 | 47 |
| GO:0017038 | Colorectum | AD | protein import | 67/3918 | 206/18723 | 6.34e-05 | 1.05e-03 | 67 |
| GO:0006626 | Colorectum | AD | protein targeting to mitochondrion | 37/3918 | 100/18723 | 1.58e-04 | 2.20e-03 | 37 |
| GO:0071806 | Colorectum | AD | protein transmembrane transport | 21/3918 | 59/18723 | 6.58e-03 | 4.08e-02 | 21 |
| GO:00068391 | Colorectum | SER | mitochondrial transport | 87/2897 | 254/18723 | 7.91e-14 | 3.03e-11 | 87 |
| GO:19905421 | Colorectum | SER | mitochondrial transmembrane transport | 42/2897 | 102/18723 | 3.65e-10 | 4.77e-08 | 42 |
| GO:00725941 | Colorectum | SER | establishment of protein localization to organelle | 111/2897 | 422/18723 | 4.98e-09 | 4.49e-07 | 111 |
| GO:00705851 | Colorectum | SER | protein localization to mitochondrion | 42/2897 | 125/18723 | 3.75e-07 | 1.98e-05 | 42 |
| GO:00726551 | Colorectum | SER | establishment of protein localization to mitochondrion | 38/2897 | 120/18723 | 6.60e-06 | 2.33e-04 | 38 |
| GO:00066051 | Colorectum | SER | protein targeting | 76/2897 | 314/18723 | 3.19e-05 | 8.47e-04 | 76 |
| GO:00066261 | Colorectum | SER | protein targeting to mitochondrion | 31/2897 | 100/18723 | 7.09e-05 | 1.61e-03 | 31 |
| GO:00170381 | Colorectum | SER | protein import | 49/2897 | 206/18723 | 1.12e-03 | 1.29e-02 | 49 |
| GO:00718061 | Colorectum | SER | protein transmembrane transport | 17/2897 | 59/18723 | 6.64e-03 | 4.69e-02 | 17 |
| GO:00725942 | Colorectum | MSS | establishment of protein localization to organelle | 139/3467 | 422/18723 | 5.75e-13 | 1.12e-10 | 139 |
| GO:00068392 | Colorectum | MSS | mitochondrial transport | 93/3467 | 254/18723 | 6.14e-12 | 9.82e-10 | 93 |
| Page: 1 2 3 4 5 |
| Pathway ID | Tissue | Disease Stage | Description | Gene Ratio | Bg Ratio | pvalue | p.adjust | qvalue | Count |
| Page: 1 |
Top |
Cell-cell communication analysis |
| Identification of potential cell-cell interactions between two cell types and their ligand-receptor pairs for different disease states |
| Ligand | Receptor | LRpair | Pathway | Tissue | Disease Stage |
| Page: 1 |
Top |
Single-cell gene regulatory network inference analysis |
| Find out the significant the regulons (TFs) and the target genes of each regulon across cell types for different disease states |
| TF | Cell Type | Tissue | Disease Stage | Target Gene | RSS | Regulon Activity |
| ∗The dot plots of a searched regulon are shown for all cell subpopulations in each disease state of each tissue based on the regulon specific score inferred using pySCENIC and by calculating the average expression. |
| Page: 1 |
Top |
Somatic mutation of malignant transformation related genes |
| Annotation of somatic variants for genes involved in malignant transformation |
| Hugo Symbol | Variant Class | Variant Classification | dbSNP RS | HGVSc | HGVSp | HGVSp Short | SWISSPROT | BIOTYPE | SIFT | PolyPhen | Tumor Sample Barcode | Tissue | Histology | Sex | Age | Stage | Therapy Types | Drugs | Outcome |
| TIMM23 | SNV | Missense_Mutation | novel | c.82C>T | p.His28Tyr | p.H28Y | O14925 | protein_coding | deleterious(0.03) | benign(0.139) | TCGA-C5-A2M2-01 | Cervix | cervical & endocervical cancer | Female | <65 | I/II | Unknown | Unknown | SD |
| TIMM23 | SNV | Missense_Mutation | novel | c.335N>T | p.Arg112Ile | p.R112I | O14925 | protein_coding | deleterious(0) | possibly_damaging(0.701) | TCGA-AA-A010-01 | Colorectum | colon adenocarcinoma | Female | <65 | I/II | Chemotherapy | folinic | CR |
| TIMM23 | SNV | Missense_Mutation | novel | c.266N>T | p.Ala89Val | p.A89V | O14925 | protein_coding | tolerated(0.07) | benign(0.027) | TCGA-D5-6928-01 | Colorectum | colon adenocarcinoma | Male | >=65 | I/II | Unknown | Unknown | SD |
| TIMM23 | SNV | Missense_Mutation | novel | c.415A>G | p.Ser139Gly | p.S139G | O14925 | protein_coding | deleterious(0) | probably_damaging(0.987) | TCGA-A5-A0VQ-01 | Endometrium | uterine corpus endometrioid carcinoma | Female | <65 | I/II | Chemotherapy | carboplatin | SD |
| TIMM23 | SNV | Missense_Mutation | novel | c.215G>A | p.Arg72Lys | p.R72K | O14925 | protein_coding | deleterious(0.01) | probably_damaging(0.987) | TCGA-AP-A0LE-01 | Endometrium | uterine corpus endometrioid carcinoma | Female | <65 | I/II | Unknown | Unknown | SD |
| TIMM23 | SNV | Missense_Mutation | novel | c.520N>A | p.Leu174Ile | p.L174I | O14925 | protein_coding | tolerated(0.1) | benign(0.084) | TCGA-AP-A0LM-01 | Endometrium | uterine corpus endometrioid carcinoma | Female | <65 | III/IV | Chemotherapy | cisplatin | SD |
| TIMM23 | SNV | Missense_Mutation | novel | c.113N>T | p.Gly38Val | p.G38V | O14925 | protein_coding | deleterious(0.01) | probably_damaging(0.998) | TCGA-AX-A05T-01 | Endometrium | uterine corpus endometrioid carcinoma | Female | >=65 | I/II | Unknown | Unknown | SD |
| TIMM23 | SNV | Missense_Mutation | novel | c.338A>T | p.Asn113Ile | p.N113I | O14925 | protein_coding | deleterious(0.04) | probably_damaging(0.998) | TCGA-AX-A06F-01 | Endometrium | uterine corpus endometrioid carcinoma | Female | <65 | III/IV | Chemotherapy | carboplatin | SD |
| TIMM23 | SNV | Missense_Mutation | novel | c.524N>A | p.Arg175Gln | p.R175Q | O14925 | protein_coding | tolerated(0.29) | benign(0.009) | TCGA-AX-A1CE-01 | Endometrium | uterine corpus endometrioid carcinoma | Female | <65 | I/II | Unspecific | Paclitaxel | SD |
| TIMM23 | SNV | Missense_Mutation | novel | c.260N>A | p.Gly87Glu | p.G87E | O14925 | protein_coding | deleterious(0) | probably_damaging(1) | TCGA-B5-A3FA-01 | Endometrium | uterine corpus endometrioid carcinoma | Female | >=65 | I/II | Unknown | Unknown | SD |
| Page: 1 2 |
Top |
Related drugs of malignant transformation related genes |
| Identification of chemicals and drugs interact with genes involved in malignant transfromation |
| (DGIdb 4.0) |
| Entrez ID | Symbol | Category | Interaction Types | Drug Claim Name | Drug Name | PMIDs |
| Page: 1 |

Copyright 2023-Present -The University of Texas Health Science Center at Houston |