
|
|||||
|
 | |
| |
| |
| |
| |
| |
|
Gene: SYS1 |
Gene summary for SYS1 |
| Gene information | Species | Human | Gene symbol | SYS1 | Gene ID | 90196 |
| Gene name | SYS1 golgi trafficking protein | |
| Gene Alias | C20orf169 | |
| Cytomap | 20q13.12 | |
| Gene Type | protein-coding | GO ID | GO:0006810 | UniProtAcc | Q8N2H4 |
Top |
Malignant transformation analysis |
| Identification of the aberrant gene expression in precancerous and cancerous lesions by comparing the gene expression of stem-like cells in diseased tissues with normal stem cells |
| Entrez ID | Symbol | Replicates | Species | Organ | Tissue | Adj P-value | Log2FC | Malignancy |
| 90196 | SYS1 | C51 | Human | Oral cavity | OSCC | 5.28e-09 | 5.49e-01 | 0.2674 |
| 90196 | SYS1 | C57 | Human | Oral cavity | OSCC | 2.91e-05 | 1.99e-01 | 0.1679 |
| 90196 | SYS1 | C06 | Human | Oral cavity | OSCC | 1.17e-05 | 9.38e-01 | 0.2699 |
| 90196 | SYS1 | C07 | Human | Oral cavity | OSCC | 1.54e-03 | 9.03e-01 | 0.2491 |
| 90196 | SYS1 | C08 | Human | Oral cavity | OSCC | 3.61e-15 | 3.85e-01 | 0.1919 |
| 90196 | SYS1 | C09 | Human | Oral cavity | OSCC | 1.38e-08 | 2.51e-01 | 0.1431 |
| 90196 | SYS1 | LN22 | Human | Oral cavity | OSCC | 4.69e-03 | 6.75e-01 | 0.1733 |
| 90196 | SYS1 | LN46 | Human | Oral cavity | OSCC | 1.66e-10 | 5.00e-01 | 0.1666 |
| 90196 | SYS1 | LP15 | Human | Oral cavity | LP | 4.86e-05 | 1.19e+00 | 0.2174 |
| 90196 | SYS1 | SYSMH1 | Human | Oral cavity | OSCC | 2.99e-27 | 5.26e-01 | 0.1127 |
| 90196 | SYS1 | SYSMH2 | Human | Oral cavity | OSCC | 4.96e-20 | 5.89e-01 | 0.2326 |
| 90196 | SYS1 | SYSMH3 | Human | Oral cavity | OSCC | 1.46e-18 | 4.56e-01 | 0.2442 |
| 90196 | SYS1 | SYSMH4 | Human | Oral cavity | OSCC | 1.11e-03 | 1.15e-01 | 0.1226 |
| 90196 | SYS1 | SYSMH6 | Human | Oral cavity | OSCC | 8.20e-08 | 3.48e-01 | 0.1275 |
| 90196 | SYS1 | male-WTA | Human | Thyroid | PTC | 8.13e-27 | 1.82e-01 | 0.1037 |
| 90196 | SYS1 | PTC01 | Human | Thyroid | PTC | 7.87e-08 | 1.59e-01 | 0.1899 |
| 90196 | SYS1 | PTC04 | Human | Thyroid | PTC | 6.45e-07 | 1.77e-01 | 0.1927 |
| 90196 | SYS1 | PTC05 | Human | Thyroid | PTC | 1.64e-09 | 3.59e-01 | 0.2065 |
| 90196 | SYS1 | PTC06 | Human | Thyroid | PTC | 4.25e-22 | 4.51e-01 | 0.2057 |
| 90196 | SYS1 | PTC07 | Human | Thyroid | PTC | 6.37e-26 | 4.43e-01 | 0.2044 |
| Page: 1 2 3 4 5 6 |
| Tissue | Expression Dynamics | Abbreviation |
| Esophagus | 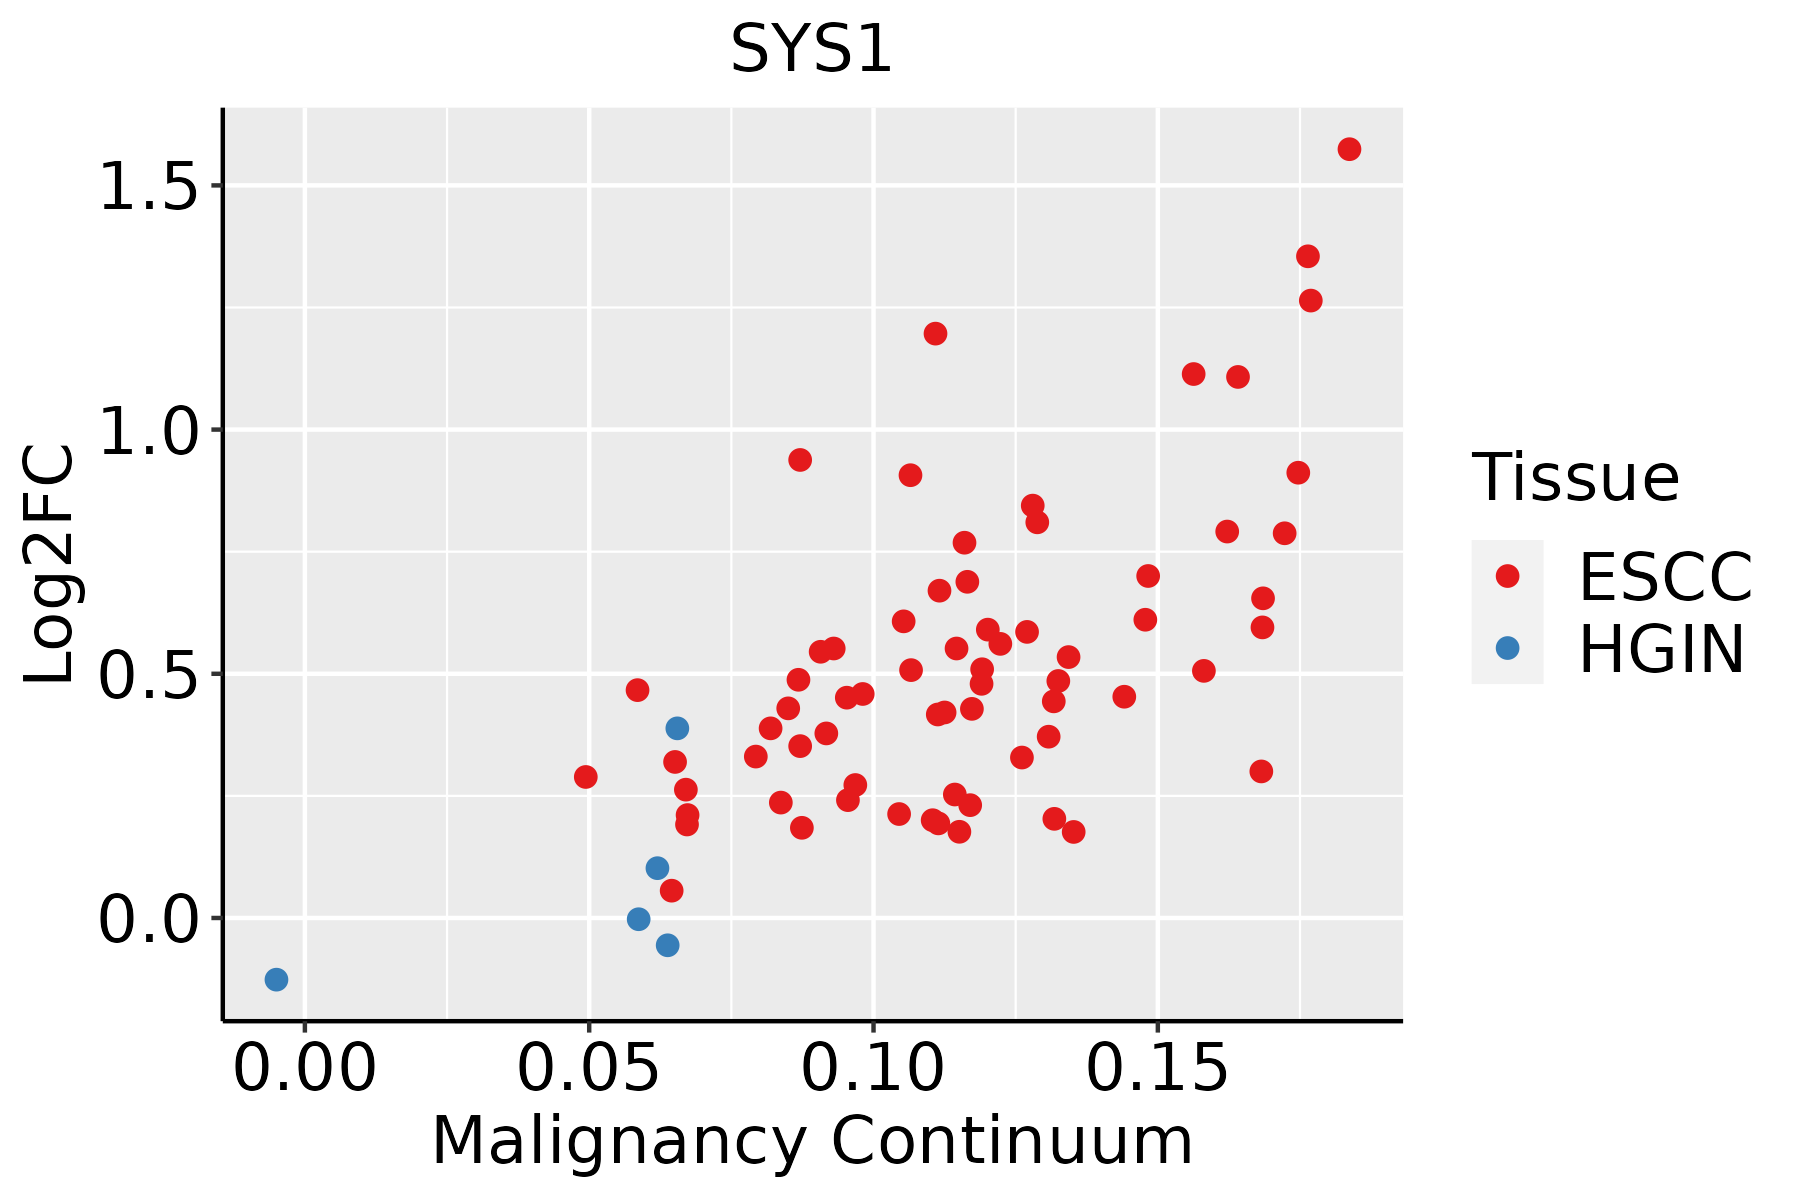 | ESCC: Esophageal squamous cell carcinoma |
| HGIN: High-grade intraepithelial neoplasias | ||
| LGIN: Low-grade intraepithelial neoplasias | ||
| Liver | 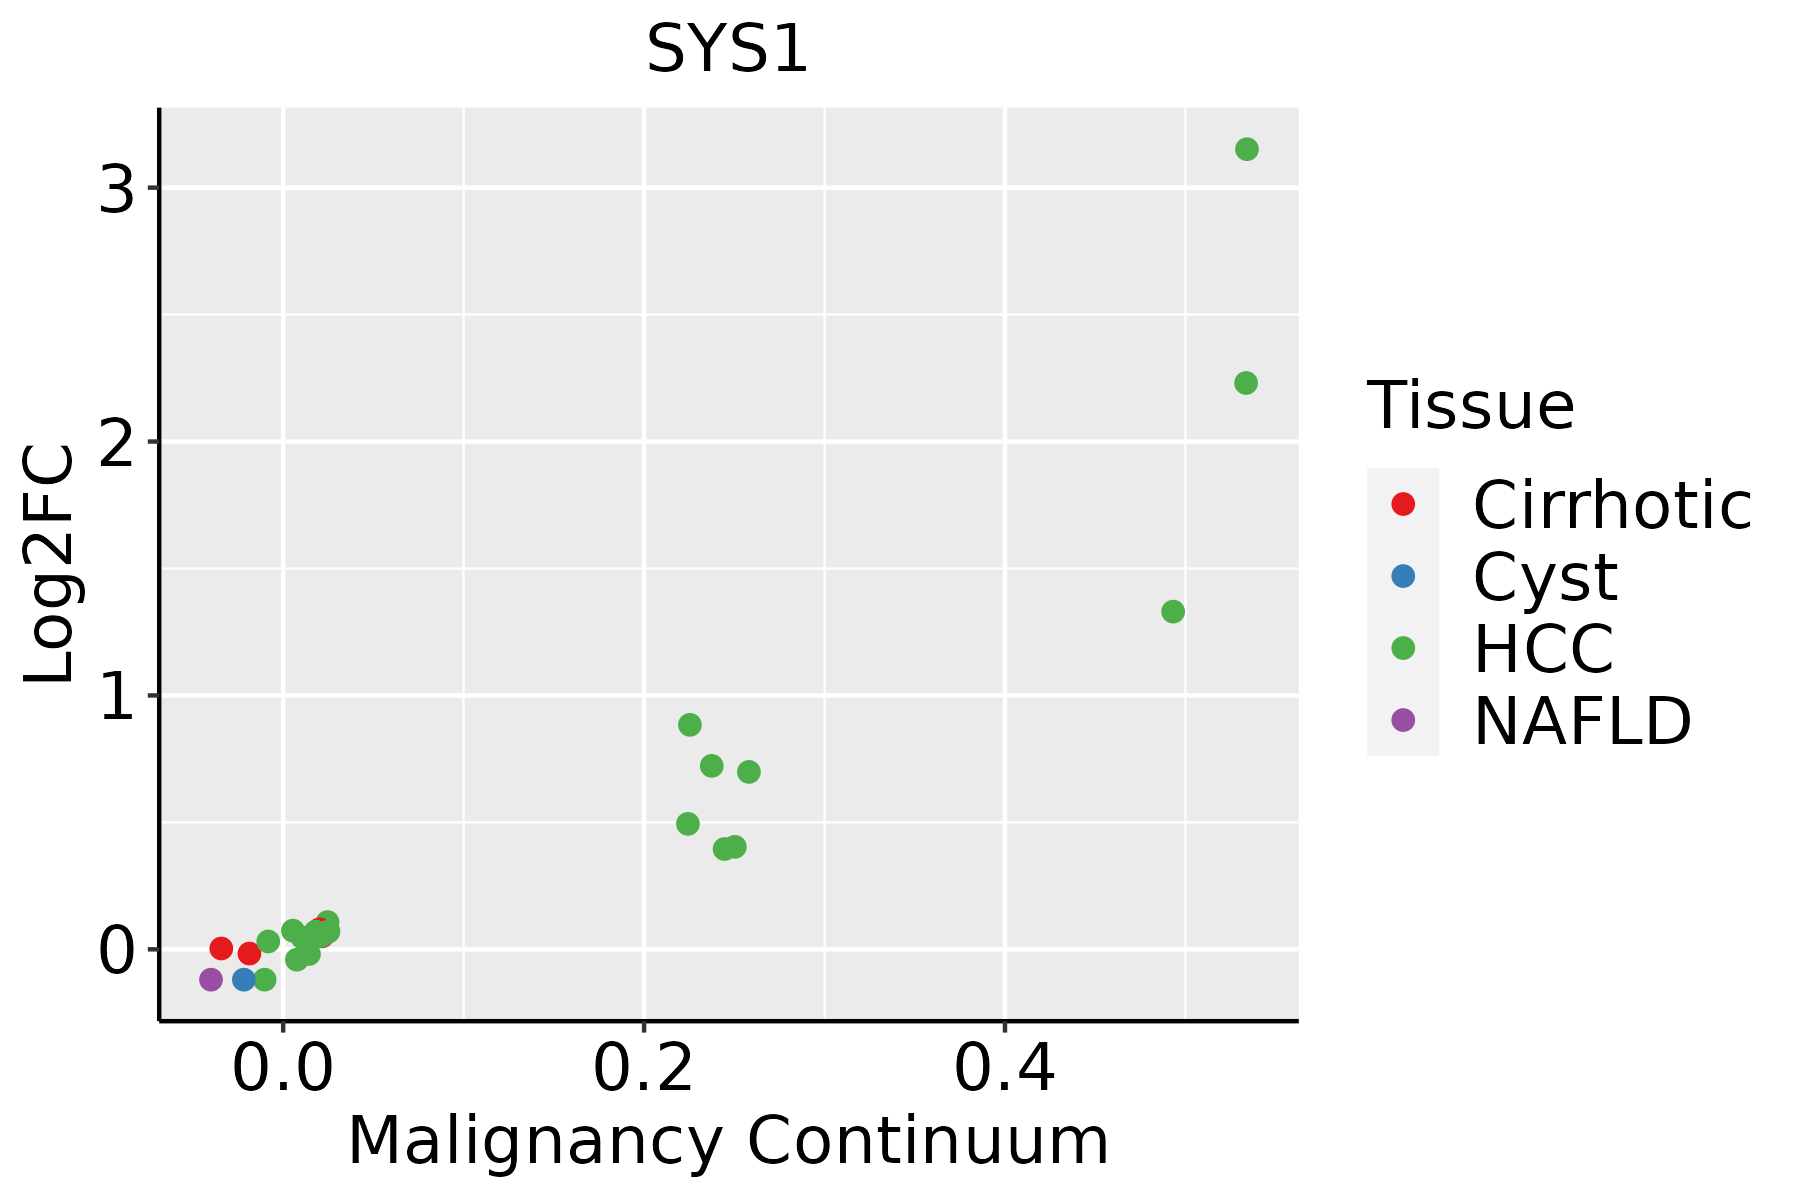 | HCC: Hepatocellular carcinoma |
| NAFLD: Non-alcoholic fatty liver disease | ||
| Oral Cavity |  | EOLP: Erosive Oral lichen planus |
| LP: leukoplakia | ||
| NEOLP: Non-erosive oral lichen planus | ||
| OSCC: Oral squamous cell carcinoma | ||
| Thyroid | 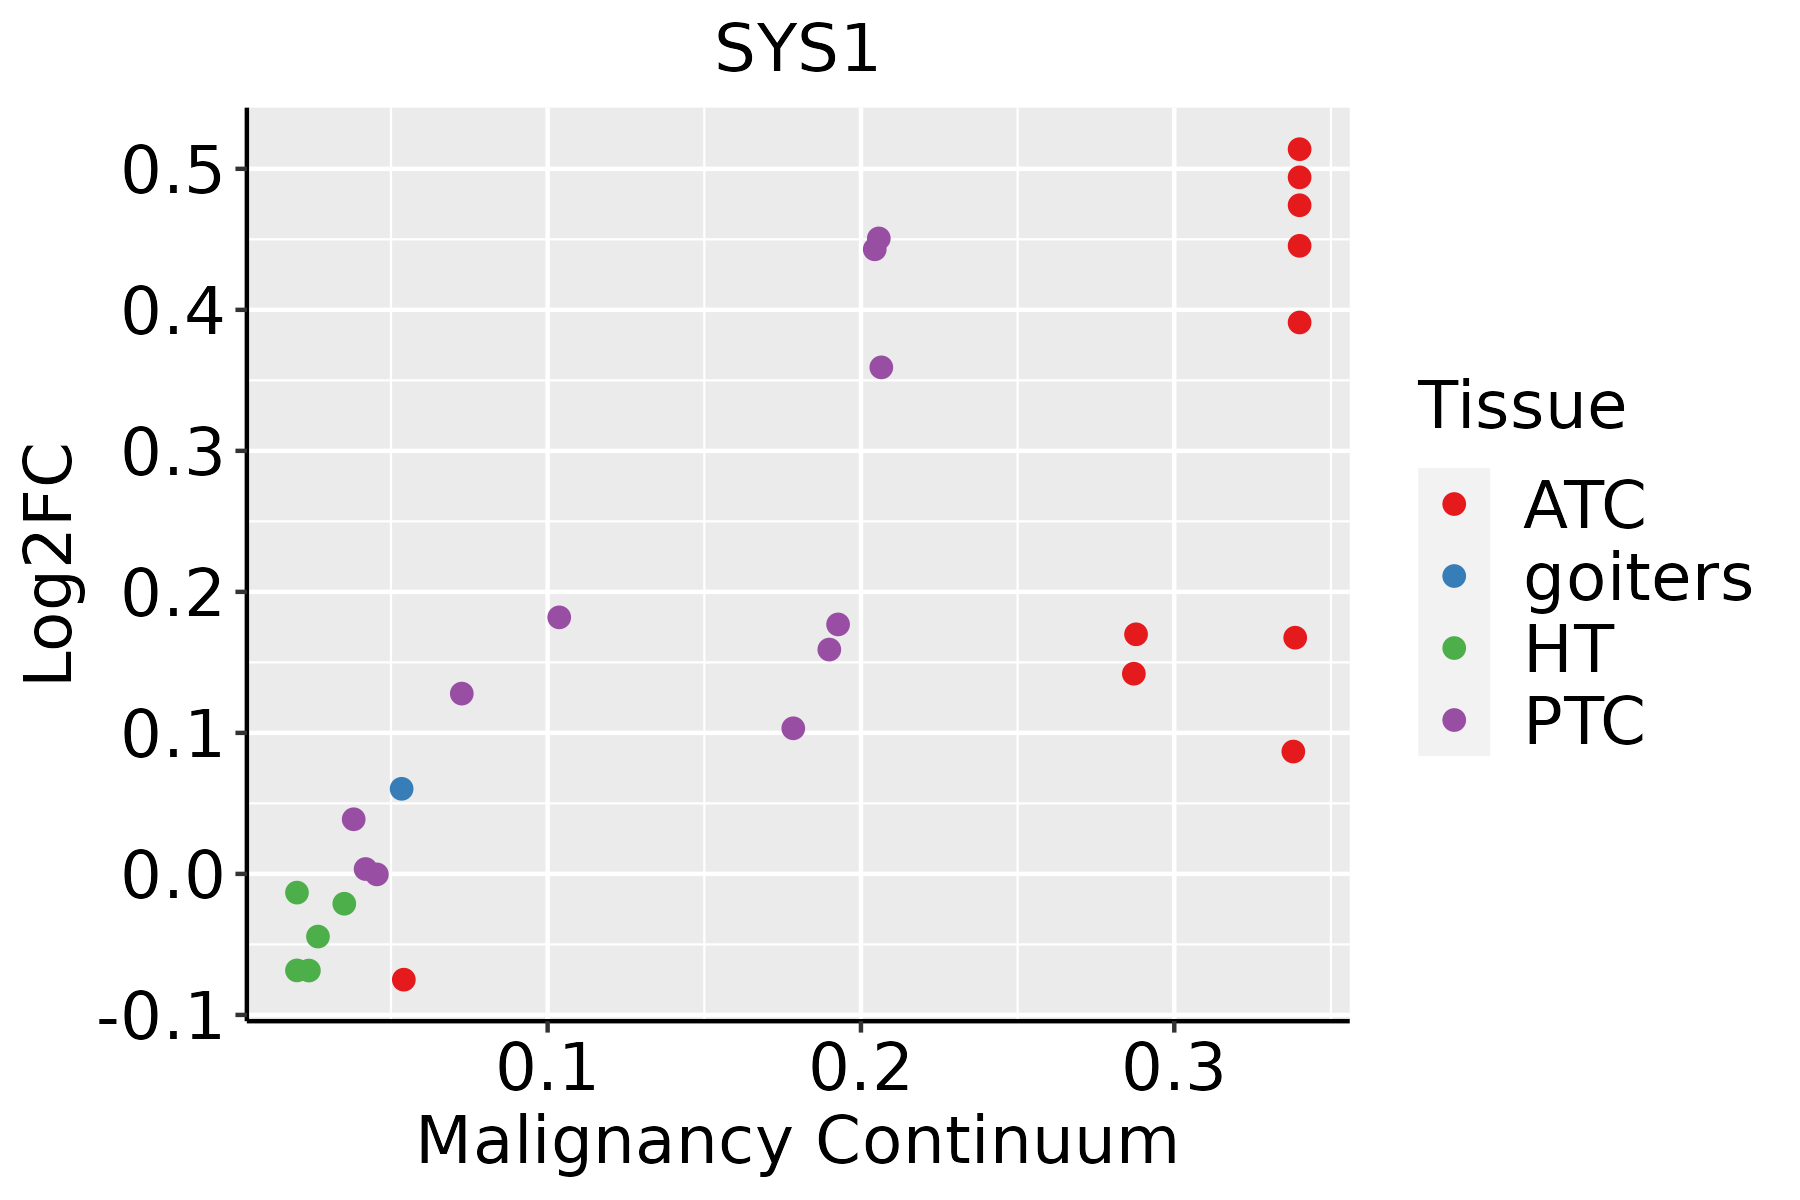 | ATC: Anaplastic thyroid cancer |
| HT: Hashimoto's thyroiditis | ||
| PTC: Papillary thyroid cancer |
| ∗log2FC in expression of this searched gene in stem-like cells from each diseased tissue sample relative to stem-like cells in normal samples in each tissue plotted against the malignancy continuum. Samples are colored based on if they are from different disease stage. |
Top |
Malignant transformation related pathway analysis |
| Find out the enriched GO biological processes and KEGG pathways involved in transition from healthy to precancer to cancer |
| Tissue | Disease Stage | Enriched GO biological Processes |
| Colorectum | AD |  |
| Colorectum | SER |  |
| Colorectum | MSS |  |
| Colorectum | MSI-H |  |
| Colorectum | FAP |  |
| ∗Top 15 enriched GO BP terms are showed in the bar plot of each disease state in each tissue. Each row represents a significant GO biological process which is colored according to the -log10(p.adjust). |
| Page: 1 2 3 4 5 6 7 8 9 |
| GO ID | Tissue | Disease Stage | Description | Gene Ratio | Bg Ratio | pvalue | p.adjust | Count |
| GO:004819318 | Esophagus | ESCC | Golgi vesicle transport | 231/8552 | 296/18723 | 1.82e-30 | 9.63e-28 | 231 |
| GO:0090150110 | Esophagus | ESCC | establishment of protein localization to membrane | 182/8552 | 260/18723 | 1.27e-15 | 8.19e-14 | 182 |
| GO:0072659110 | Esophagus | ESCC | protein localization to plasma membrane | 193/8552 | 284/18723 | 1.95e-14 | 1.03e-12 | 193 |
| GO:001648210 | Esophagus | ESCC | cytosolic transport | 124/8552 | 168/18723 | 9.69e-14 | 4.69e-12 | 124 |
| GO:199077819 | Esophagus | ESCC | protein localization to cell periphery | 217/8552 | 333/18723 | 4.08e-13 | 1.88e-11 | 217 |
| GO:000689215 | Esophagus | ESCC | post-Golgi vesicle-mediated transport | 82/8552 | 104/18723 | 4.00e-12 | 1.55e-10 | 82 |
| GO:009887615 | Esophagus | ESCC | vesicle-mediated transport to the plasma membrane | 99/8552 | 136/18723 | 1.13e-10 | 3.39e-09 | 99 |
| GO:000689315 | Esophagus | ESCC | Golgi to plasma membrane transport | 48/8552 | 60/18723 | 5.11e-08 | 9.16e-07 | 48 |
| GO:004300114 | Esophagus | ESCC | Golgi to plasma membrane protein transport | 34/8552 | 40/18723 | 3.00e-07 | 4.27e-06 | 34 |
| GO:006195114 | Esophagus | ESCC | establishment of protein localization to plasma membrane | 44/8552 | 60/18723 | 1.25e-05 | 1.15e-04 | 44 |
| GO:00340676 | Esophagus | ESCC | protein localization to Golgi apparatus | 23/8552 | 29/18723 | 2.25e-04 | 1.40e-03 | 23 |
| GO:00068953 | Esophagus | ESCC | Golgi to endosome transport | 13/8552 | 17/18723 | 1.00e-02 | 3.42e-02 | 13 |
| GO:004819311 | Liver | Cirrhotic | Golgi vesicle transport | 153/4634 | 296/18723 | 1.02e-23 | 6.43e-21 | 153 |
| GO:00901507 | Liver | Cirrhotic | establishment of protein localization to membrane | 123/4634 | 260/18723 | 1.85e-15 | 2.15e-13 | 123 |
| GO:199077811 | Liver | Cirrhotic | protein localization to cell periphery | 135/4634 | 333/18723 | 1.18e-10 | 6.21e-09 | 135 |
| GO:007265911 | Liver | Cirrhotic | protein localization to plasma membrane | 119/4634 | 284/18723 | 1.30e-10 | 6.80e-09 | 119 |
| GO:004300111 | Liver | Cirrhotic | Golgi to plasma membrane protein transport | 27/4634 | 40/18723 | 1.43e-08 | 5.36e-07 | 27 |
| GO:001648211 | Liver | Cirrhotic | cytosolic transport | 74/4634 | 168/18723 | 3.34e-08 | 1.12e-06 | 74 |
| GO:000689211 | Liver | Cirrhotic | post-Golgi vesicle-mediated transport | 51/4634 | 104/18723 | 7.12e-08 | 2.15e-06 | 51 |
| GO:00619515 | Liver | Cirrhotic | establishment of protein localization to plasma membrane | 33/4634 | 60/18723 | 5.09e-07 | 1.14e-05 | 33 |
| Page: 1 2 3 4 |
| Pathway ID | Tissue | Disease Stage | Description | Gene Ratio | Bg Ratio | pvalue | p.adjust | qvalue | Count |
| Page: 1 |
Top |
Cell-cell communication analysis |
| Identification of potential cell-cell interactions between two cell types and their ligand-receptor pairs for different disease states |
| Ligand | Receptor | LRpair | Pathway | Tissue | Disease Stage |
| Page: 1 |
Top |
Single-cell gene regulatory network inference analysis |
| Find out the significant the regulons (TFs) and the target genes of each regulon across cell types for different disease states |
| TF | Cell Type | Tissue | Disease Stage | Target Gene | RSS | Regulon Activity |
| ∗The dot plots of a searched regulon are shown for all cell subpopulations in each disease state of each tissue based on the regulon specific score inferred using pySCENIC and by calculating the average expression. |
| Page: 1 |
Top |
Somatic mutation of malignant transformation related genes |
| Annotation of somatic variants for genes involved in malignant transformation |
| Hugo Symbol | Variant Class | Variant Classification | dbSNP RS | HGVSc | HGVSp | HGVSp Short | SWISSPROT | BIOTYPE | SIFT | PolyPhen | Tumor Sample Barcode | Tissue | Histology | Sex | Age | Stage | Therapy Types | Drugs | Outcome |
| SYS1 | SNV | Missense_Mutation | c.188G>T | p.Gly63Val | p.G63V | Q8N2H4 | protein_coding | deleterious(0) | probably_damaging(0.997) | TCGA-A8-A07W-01 | Breast | breast invasive carcinoma | Female | >=65 | III/IV | Hormone Therapy | exemestane | SD | |
| SYS1 | SNV | Missense_Mutation | c.69G>C | p.Gln23His | p.Q23H | Q8N2H4 | protein_coding | deleterious(0) | probably_damaging(0.947) | TCGA-D8-A1J8-01 | Breast | breast invasive carcinoma | Female | >=65 | I/II | Hormone Therapy | nolvadex | SD | |
| SYS1 | SNV | Missense_Mutation | rs776461956 | c.419N>A | p.Arg140Gln | p.R140Q | Q8N2H4 | protein_coding | deleterious(0.03) | benign(0.417) | TCGA-AD-5900-01 | Colorectum | colon adenocarcinoma | Male | >=65 | I/II | Unknown | Unknown | SD |
| SYS1 | SNV | Missense_Mutation | c.187N>A | p.Gly63Ser | p.G63S | Q8N2H4 | protein_coding | deleterious(0) | possibly_damaging(0.876) | TCGA-CK-4951-01 | Colorectum | colon adenocarcinoma | Female | >=65 | I/II | Unknown | Unknown | PD | |
| SYS1 | SNV | Missense_Mutation | c.340N>A | p.Pro114Thr | p.P114T | Q8N2H4 | protein_coding | deleterious(0) | probably_damaging(0.964) | TCGA-CK-4951-01 | Colorectum | colon adenocarcinoma | Female | >=65 | I/II | Unknown | Unknown | PD | |
| SYS1 | SNV | Missense_Mutation | c.277G>T | p.Asp93Tyr | p.D93Y | Q8N2H4 | protein_coding | deleterious(0) | probably_damaging(1) | TCGA-AG-A011-01 | Colorectum | rectum adenocarcinoma | Male | >=65 | I/II | Unknown | Unknown | SD | |
| SYS1 | SNV | Missense_Mutation | novel | c.157N>A | p.Ala53Thr | p.A53T | Q8N2H4 | protein_coding | tolerated(0.05) | benign(0.001) | TCGA-A5-A0G1-01 | Endometrium | uterine corpus endometrioid carcinoma | Female | >=65 | I/II | Unknown | Unknown | SD |
| SYS1 | SNV | Missense_Mutation | rs199934485 | c.344N>T | p.Ser115Leu | p.S115L | Q8N2H4 | protein_coding | tolerated(0.27) | benign(0.01) | TCGA-AJ-A3EK-01 | Endometrium | uterine corpus endometrioid carcinoma | Female | <65 | I/II | Chemotherapy | carboplatin | CR |
| SYS1 | SNV | Missense_Mutation | novel | c.346N>A | p.Ala116Thr | p.A116T | Q8N2H4 | protein_coding | tolerated(1) | benign(0) | TCGA-AP-A1DK-01 | Endometrium | uterine corpus endometrioid carcinoma | Female | <65 | I/II | Unknown | Unknown | SD |
| SYS1 | SNV | Missense_Mutation | novel | c.466N>A | p.Val156Ile | p.V156I | Q8N2H4 | protein_coding | deleterious(0.04) | benign(0.138) | TCGA-5R-AA1C-01 | Liver | liver hepatocellular carcinoma | Male | <65 | I/II | Unknown | Unknown | SD |
| Page: 1 2 |
Top |
Related drugs of malignant transformation related genes |
| Identification of chemicals and drugs interact with genes involved in malignant transfromation |
| (DGIdb 4.0) |
| Entrez ID | Symbol | Category | Interaction Types | Drug Claim Name | Drug Name | PMIDs |
| Page: 1 |

Copyright 2023-Present -The University of Texas Health Science Center at Houston |