
|
|||||
|
 | |
| |
| |
| |
| |
| |
|
Gene: SYK |
Gene summary for SYK |
| Gene information | Species | Human | Gene symbol | SYK | Gene ID | 6850 |
| Gene name | spleen associated tyrosine kinase | |
| Gene Alias | IMD82 | |
| Cytomap | 9q22.2 | |
| Gene Type | protein-coding | GO ID | GO:0000165 | UniProtAcc | A0A024R273 |
Top |
Malignant transformation analysis |
| Identification of the aberrant gene expression in precancerous and cancerous lesions by comparing the gene expression of stem-like cells in diseased tissues with normal stem cells |
| Entrez ID | Symbol | Replicates | Species | Organ | Tissue | Adj P-value | Log2FC | Malignancy |
| 6850 | SYK | P127T-E | Human | Esophagus | ESCC | 6.97e-16 | 2.29e-01 | 0.0826 |
| 6850 | SYK | P128T-E | Human | Esophagus | ESCC | 2.97e-20 | 6.41e-01 | 0.1241 |
| 6850 | SYK | P130T-E | Human | Esophagus | ESCC | 9.91e-22 | 3.91e-01 | 0.1676 |
| 6850 | SYK | HCC2_Meng | Human | Liver | HCC | 4.20e-16 | 7.92e-02 | 0.0107 |
| 6850 | SYK | HCC2 | Human | Liver | HCC | 5.78e-11 | 7.86e-01 | 0.5341 |
| 6850 | SYK | HCC5 | Human | Liver | HCC | 9.41e-10 | 1.15e+00 | 0.4932 |
| 6850 | SYK | C04 | Human | Oral cavity | OSCC | 3.95e-07 | 3.34e-01 | 0.2633 |
| 6850 | SYK | C21 | Human | Oral cavity | OSCC | 1.11e-14 | 4.46e-01 | 0.2678 |
| 6850 | SYK | C30 | Human | Oral cavity | OSCC | 3.64e-39 | 1.29e+00 | 0.3055 |
| 6850 | SYK | C38 | Human | Oral cavity | OSCC | 5.05e-05 | 4.79e-01 | 0.172 |
| 6850 | SYK | C43 | Human | Oral cavity | OSCC | 1.99e-26 | 5.40e-01 | 0.1704 |
| 6850 | SYK | C46 | Human | Oral cavity | OSCC | 1.17e-24 | 4.62e-01 | 0.1673 |
| 6850 | SYK | C57 | Human | Oral cavity | OSCC | 1.52e-12 | 4.50e-01 | 0.1679 |
| 6850 | SYK | C08 | Human | Oral cavity | OSCC | 2.45e-02 | 1.23e-01 | 0.1919 |
| 6850 | SYK | LN46 | Human | Oral cavity | OSCC | 3.08e-18 | 5.69e-01 | 0.1666 |
| 6850 | SYK | LP15 | Human | Oral cavity | LP | 2.65e-02 | 5.42e-01 | 0.2174 |
| 6850 | SYK | EOLP-1 | Human | Oral cavity | EOLP | 7.44e-06 | 2.61e-01 | -0.0202 |
| 6850 | SYK | SYSMH1 | Human | Oral cavity | OSCC | 7.14e-17 | 4.21e-01 | 0.1127 |
| 6850 | SYK | Dong_P1 | Human | Prostate | Tumor | 1.52e-02 | 4.50e-02 | 0.035 |
| 6850 | SYK | Dong_P5 | Human | Prostate | Tumor | 5.92e-35 | 2.38e-01 | 0.053 |
| Page: 1 2 3 4 5 6 |
| Tissue | Expression Dynamics | Abbreviation |
| Cervix | 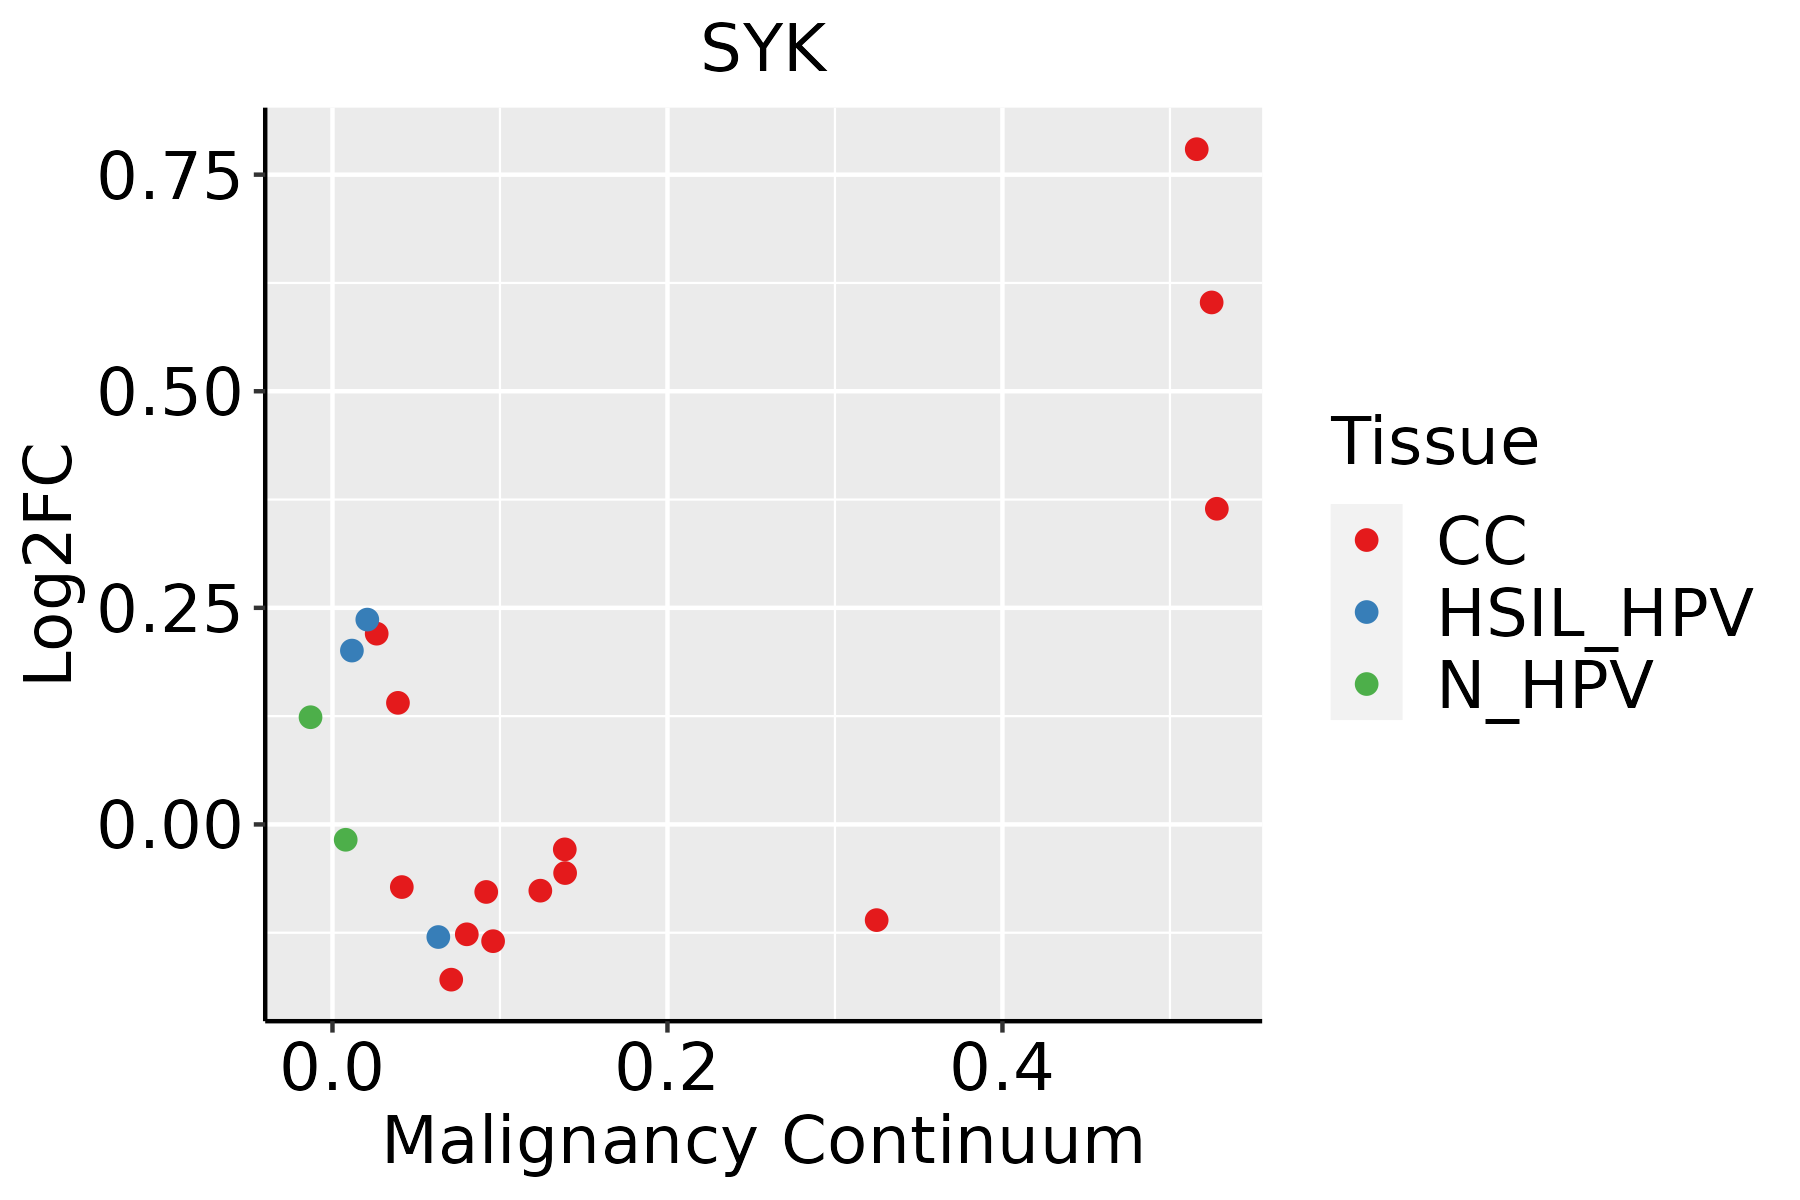 | CC: Cervix cancer |
| HSIL_HPV: HPV-infected high-grade squamous intraepithelial lesions | ||
| N_HPV: HPV-infected normal cervix | ||
| Colorectum (GSE201348) |  | FAP: Familial adenomatous polyposis |
| CRC: Colorectal cancer | ||
| Colorectum (HTA11) |  | AD: Adenomas |
| SER: Sessile serrated lesions | ||
| MSI-H: Microsatellite-high colorectal cancer | ||
| MSS: Microsatellite stable colorectal cancer | ||
| Esophagus | 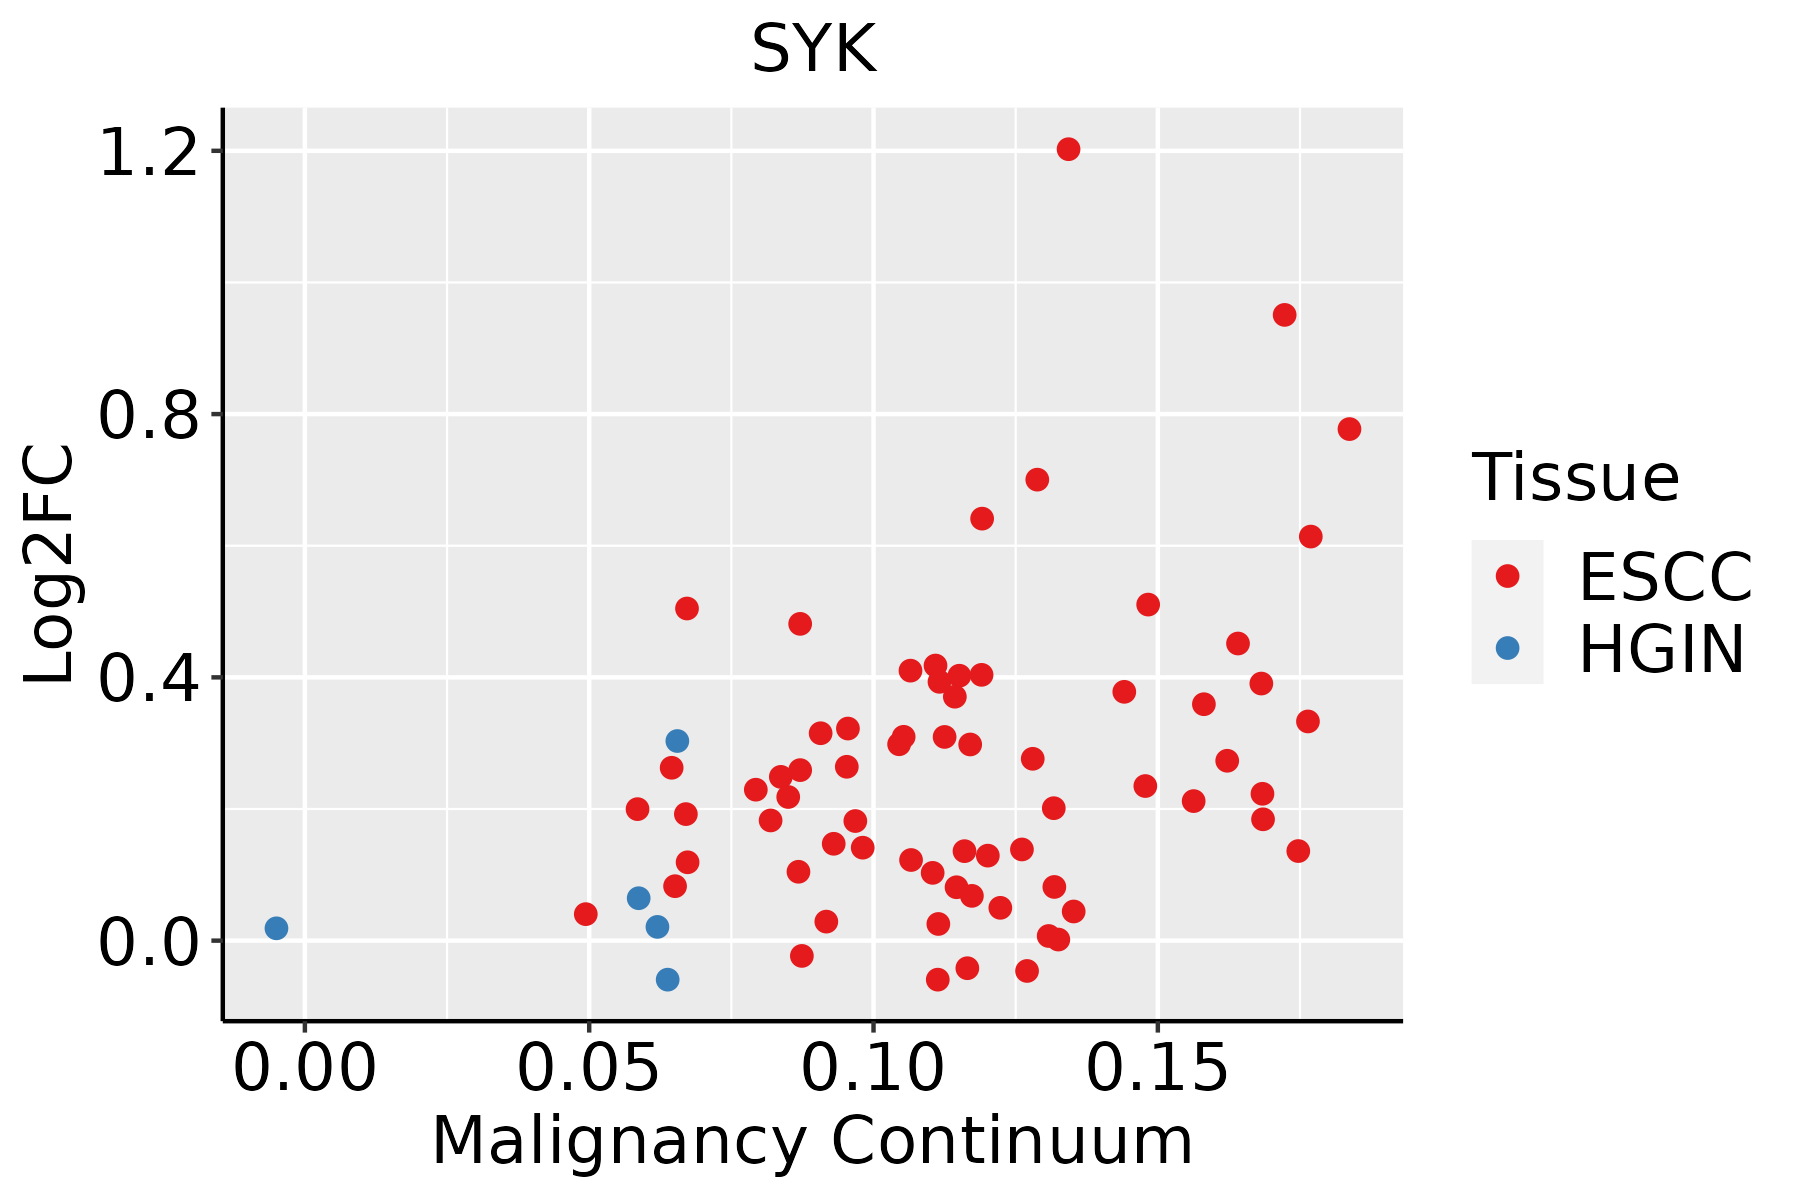 | ESCC: Esophageal squamous cell carcinoma |
| HGIN: High-grade intraepithelial neoplasias | ||
| LGIN: Low-grade intraepithelial neoplasias | ||
| Liver | 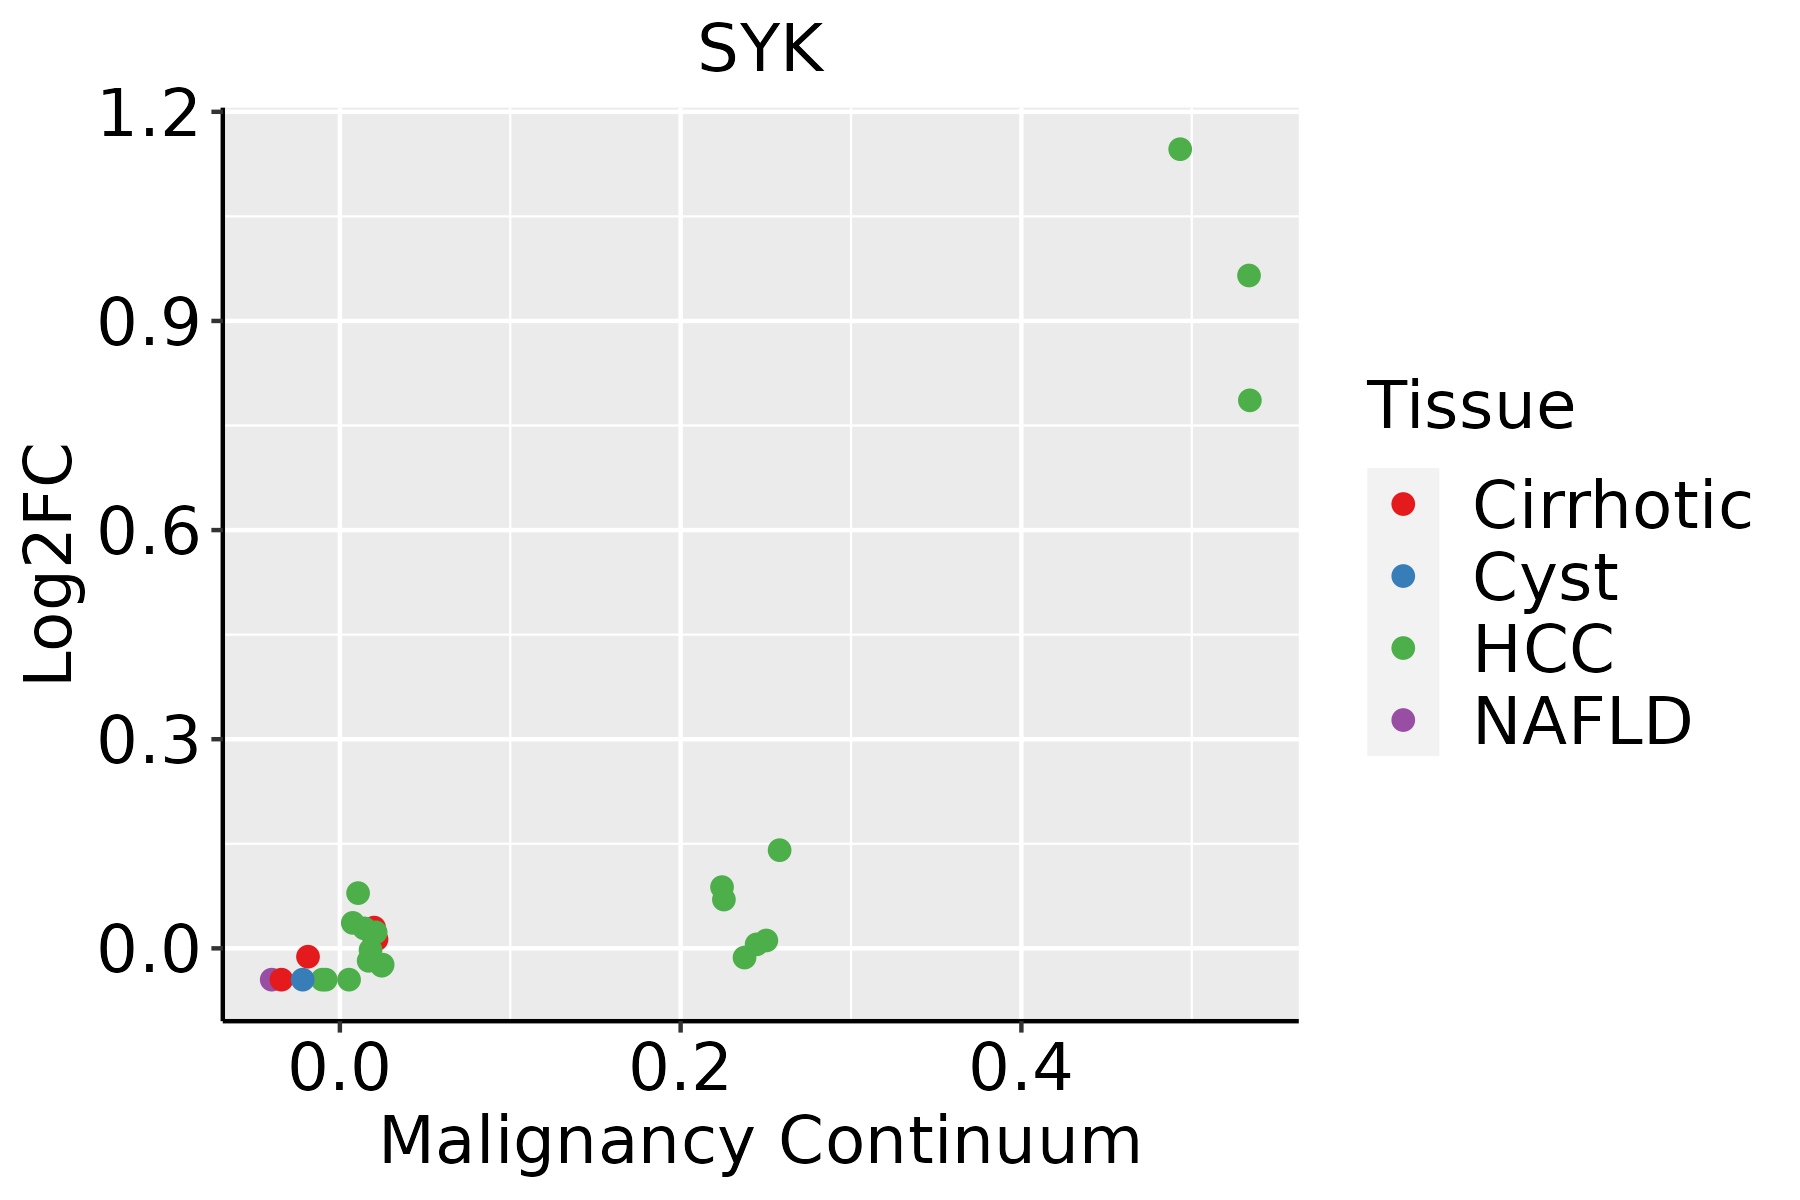 | HCC: Hepatocellular carcinoma |
| NAFLD: Non-alcoholic fatty liver disease | ||
| Oral Cavity | 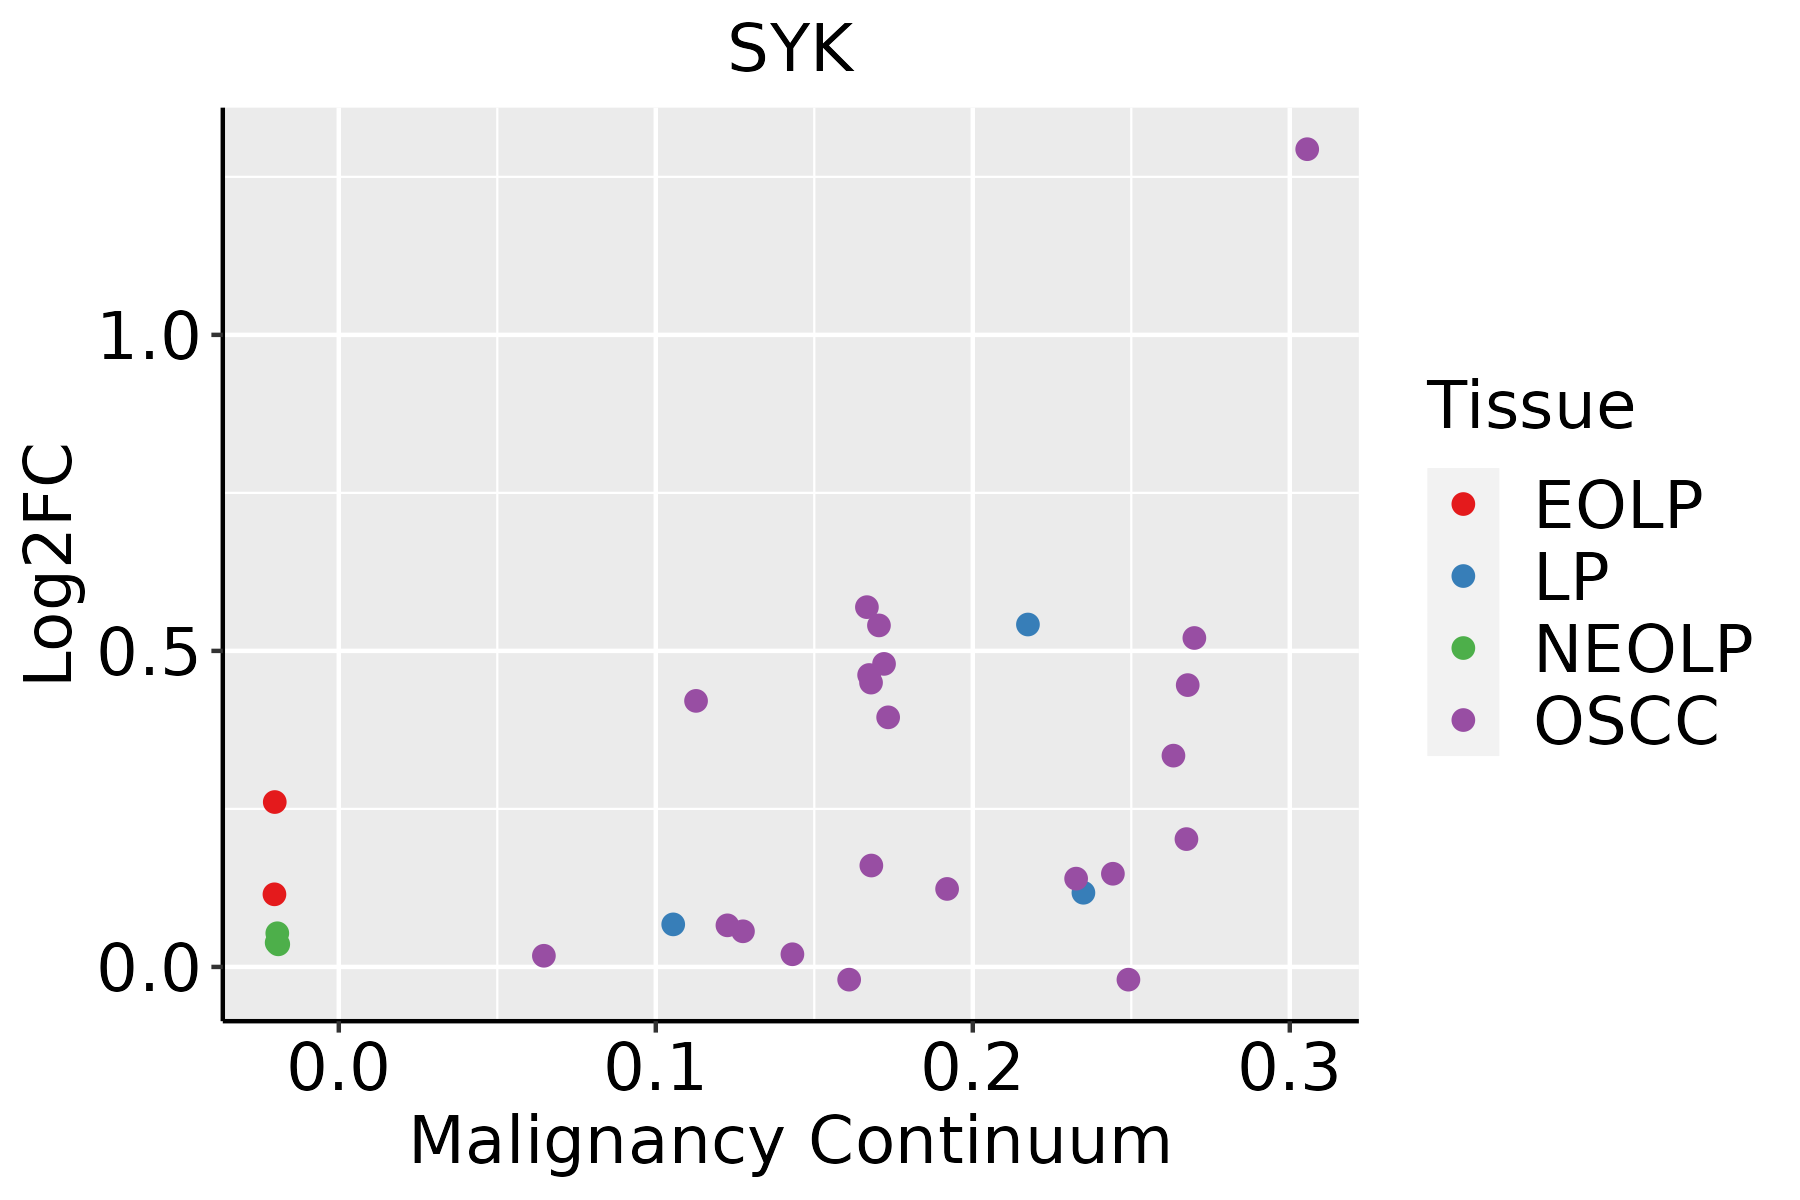 | EOLP: Erosive Oral lichen planus |
| LP: leukoplakia | ||
| NEOLP: Non-erosive oral lichen planus | ||
| OSCC: Oral squamous cell carcinoma | ||
| Prostate | 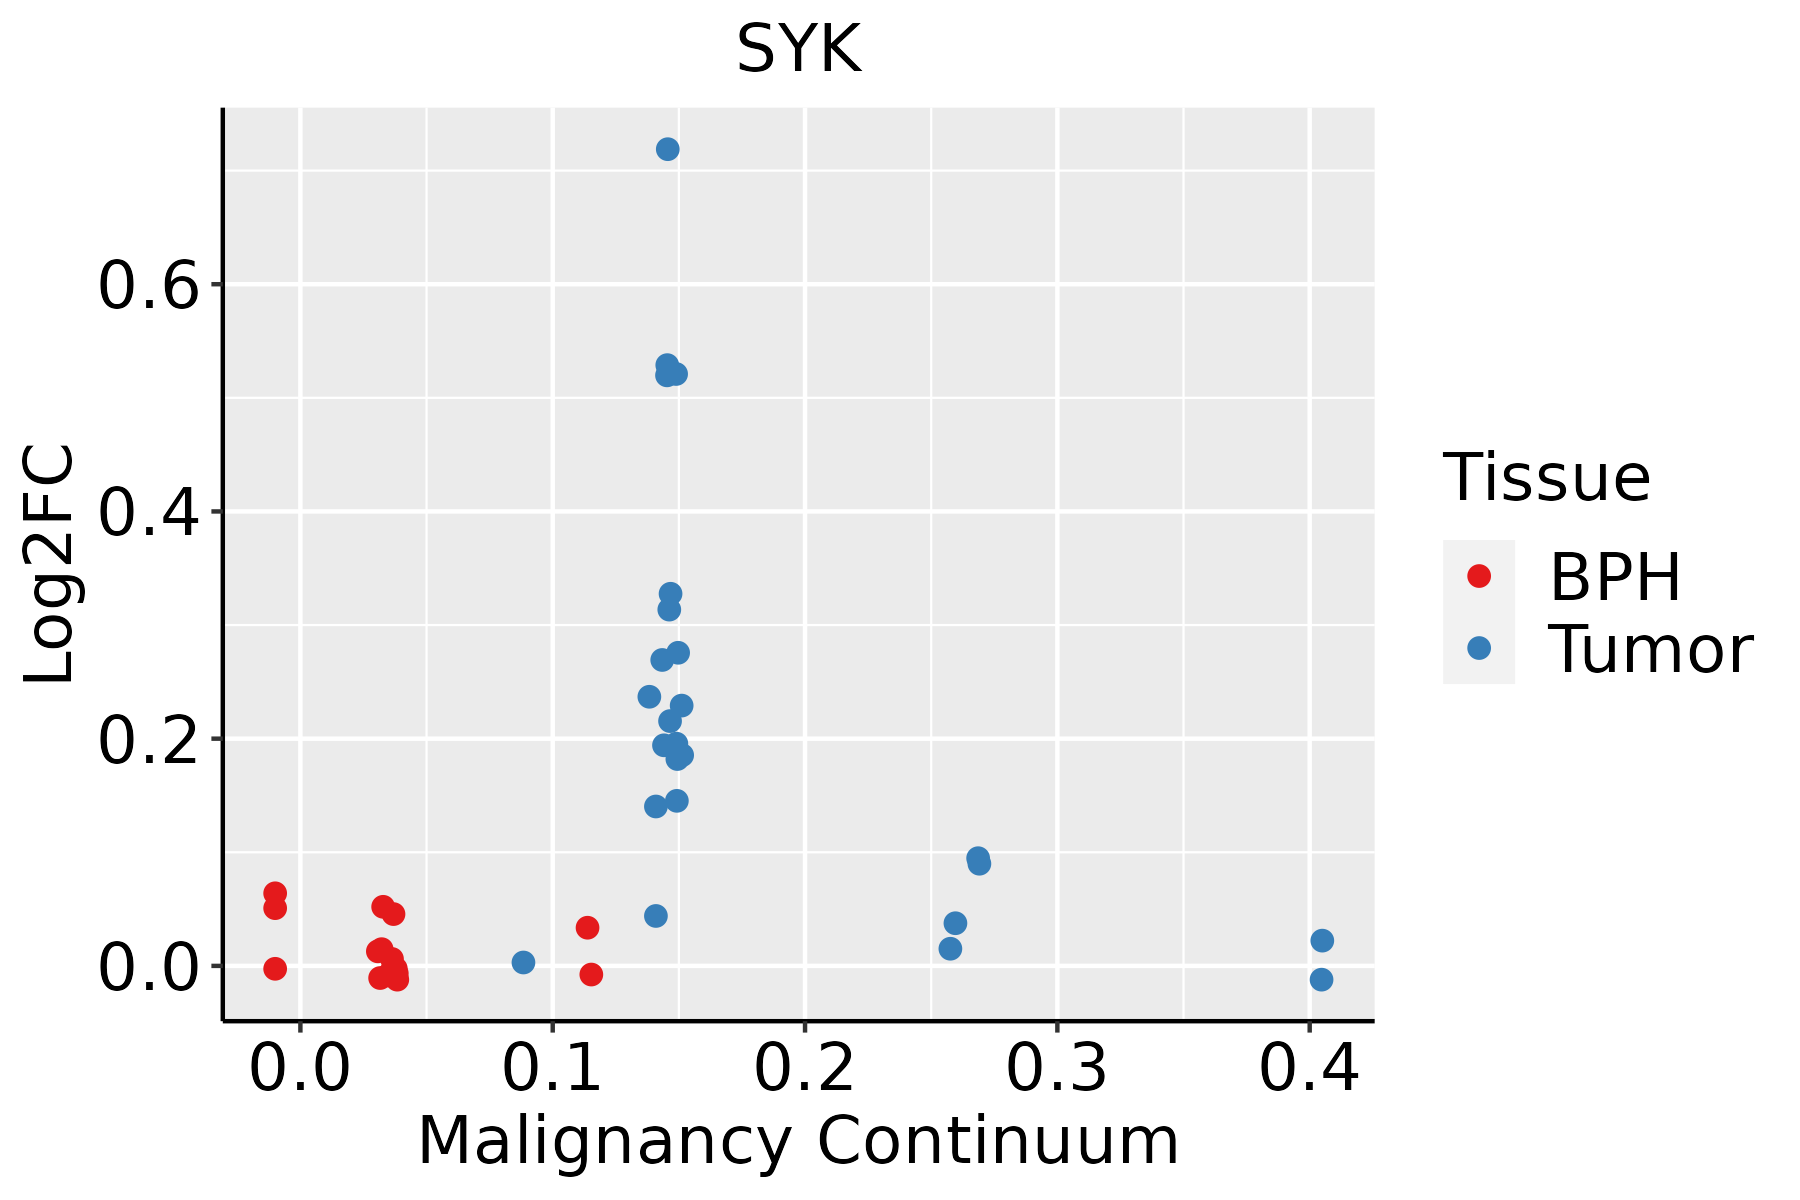 | BPH: Benign Prostatic Hyperplasia |
| Thyroid |  | ATC: Anaplastic thyroid cancer |
| HT: Hashimoto's thyroiditis | ||
| PTC: Papillary thyroid cancer |
| ∗log2FC in expression of this searched gene in stem-like cells from each diseased tissue sample relative to stem-like cells in normal samples in each tissue plotted against the malignancy continuum. Samples are colored based on if they are from different disease stage. |
Top |
Malignant transformation related pathway analysis |
| Find out the enriched GO biological processes and KEGG pathways involved in transition from healthy to precancer to cancer |
| Tissue | Disease Stage | Enriched GO biological Processes |
| Colorectum | AD |  |
| Colorectum | SER |  |
| Colorectum | MSS |  |
| Colorectum | MSI-H |  |
| Colorectum | FAP |  |
| ∗Top 15 enriched GO BP terms are showed in the bar plot of each disease state in each tissue. Each row represents a significant GO biological process which is colored according to the -log10(p.adjust). |
| Page: 1 2 3 4 5 6 7 8 9 |
| GO ID | Tissue | Disease Stage | Description | Gene Ratio | Bg Ratio | pvalue | p.adjust | Count |
| GO:004206010 | Cervix | CC | wound healing | 109/2311 | 422/18723 | 1.84e-14 | 1.57e-11 | 109 |
| GO:005254710 | Cervix | CC | regulation of peptidase activity | 112/2311 | 461/18723 | 6.70e-13 | 3.08e-10 | 112 |
| GO:004586210 | Cervix | CC | positive regulation of proteolysis | 95/2311 | 372/18723 | 1.84e-12 | 6.86e-10 | 95 |
| GO:005254810 | Cervix | CC | regulation of endopeptidase activity | 103/2311 | 432/18723 | 1.89e-11 | 5.14e-09 | 103 |
| GO:00725949 | Cervix | CC | establishment of protein localization to organelle | 99/2311 | 422/18723 | 1.23e-10 | 2.11e-08 | 99 |
| GO:002240710 | Cervix | CC | regulation of cell-cell adhesion | 103/2311 | 448/18723 | 1.78e-10 | 2.87e-08 | 103 |
| GO:004578510 | Cervix | CC | positive regulation of cell adhesion | 101/2311 | 437/18723 | 1.96e-10 | 3.08e-08 | 101 |
| GO:00421108 | Cervix | CC | T cell activation | 107/2311 | 487/18723 | 1.24e-09 | 1.46e-07 | 107 |
| GO:00508638 | Cervix | CC | regulation of T cell activation | 80/2311 | 329/18723 | 1.28e-09 | 1.47e-07 | 80 |
| GO:004325410 | Cervix | CC | regulation of protein-containing complex assembly | 96/2311 | 428/18723 | 2.91e-09 | 3.05e-07 | 96 |
| GO:00321035 | Cervix | CC | positive regulation of response to external stimulus | 95/2311 | 427/18723 | 5.44e-09 | 5.03e-07 | 95 |
| GO:001095210 | Cervix | CC | positive regulation of peptidase activity | 54/2311 | 197/18723 | 8.06e-09 | 6.99e-07 | 54 |
| GO:00071598 | Cervix | CC | leukocyte cell-cell adhesion | 85/2311 | 371/18723 | 8.27e-09 | 7.07e-07 | 85 |
| GO:003367410 | Cervix | CC | positive regulation of kinase activity | 101/2311 | 467/18723 | 8.66e-09 | 7.22e-07 | 101 |
| GO:200011610 | Cervix | CC | regulation of cysteine-type endopeptidase activity | 61/2311 | 235/18723 | 8.69e-09 | 7.22e-07 | 61 |
| GO:00026837 | Cervix | CC | negative regulation of immune system process | 94/2311 | 434/18723 | 2.63e-08 | 1.87e-06 | 94 |
| GO:004328110 | Cervix | CC | regulation of cysteine-type endopeptidase activity involved in apoptotic process | 55/2311 | 209/18723 | 2.77e-08 | 1.95e-06 | 55 |
| GO:00603267 | Cervix | CC | cell chemotaxis | 73/2311 | 310/18723 | 2.82e-08 | 1.96e-06 | 73 |
| GO:00069139 | Cervix | CC | nucleocytoplasmic transport | 71/2311 | 301/18723 | 4.04e-08 | 2.54e-06 | 71 |
| GO:00511699 | Cervix | CC | nuclear transport | 71/2311 | 301/18723 | 4.04e-08 | 2.54e-06 | 71 |
| Page: 1 2 3 4 5 6 7 8 9 10 11 12 13 14 15 16 17 18 19 20 21 22 23 24 25 26 27 28 29 30 31 32 33 34 35 36 37 38 39 40 41 42 43 44 45 46 47 48 49 50 51 52 53 54 55 56 |
| Pathway ID | Tissue | Disease Stage | Description | Gene Ratio | Bg Ratio | pvalue | p.adjust | qvalue | Count |
| hsa0517120 | Cervix | CC | Coronavirus disease - COVID-19 | 111/1267 | 232/8465 | 1.82e-33 | 5.90e-31 | 3.49e-31 | 111 |
| hsa0516720 | Cervix | CC | Kaposi sarcoma-associated herpesvirus infection | 60/1267 | 194/8465 | 9.74e-09 | 1.58e-07 | 9.33e-08 | 60 |
| hsa0516920 | Cervix | CC | Epstein-Barr virus infection | 57/1267 | 202/8465 | 7.30e-07 | 7.39e-06 | 4.37e-06 | 57 |
| hsa0466612 | Cervix | CC | Fc gamma R-mediated phagocytosis | 31/1267 | 97/8465 | 1.78e-05 | 1.42e-04 | 8.40e-05 | 31 |
| hsa04664 | Cervix | CC | Fc epsilon RI signaling pathway | 22/1267 | 68/8465 | 2.35e-04 | 1.31e-03 | 7.77e-04 | 22 |
| hsa05152 | Cervix | CC | Tuberculosis | 42/1267 | 180/8465 | 1.78e-03 | 7.21e-03 | 4.26e-03 | 42 |
| hsa046115 | Cervix | CC | Platelet activation | 28/1267 | 124/8465 | 1.50e-02 | 4.45e-02 | 2.63e-02 | 28 |
| hsa05171110 | Cervix | CC | Coronavirus disease - COVID-19 | 111/1267 | 232/8465 | 1.82e-33 | 5.90e-31 | 3.49e-31 | 111 |
| hsa05167110 | Cervix | CC | Kaposi sarcoma-associated herpesvirus infection | 60/1267 | 194/8465 | 9.74e-09 | 1.58e-07 | 9.33e-08 | 60 |
| hsa05169110 | Cervix | CC | Epstein-Barr virus infection | 57/1267 | 202/8465 | 7.30e-07 | 7.39e-06 | 4.37e-06 | 57 |
| hsa0466613 | Cervix | CC | Fc gamma R-mediated phagocytosis | 31/1267 | 97/8465 | 1.78e-05 | 1.42e-04 | 8.40e-05 | 31 |
| hsa046641 | Cervix | CC | Fc epsilon RI signaling pathway | 22/1267 | 68/8465 | 2.35e-04 | 1.31e-03 | 7.77e-04 | 22 |
| hsa051521 | Cervix | CC | Tuberculosis | 42/1267 | 180/8465 | 1.78e-03 | 7.21e-03 | 4.26e-03 | 42 |
| hsa0461113 | Cervix | CC | Platelet activation | 28/1267 | 124/8465 | 1.50e-02 | 4.45e-02 | 2.63e-02 | 28 |
| hsa05171 | Colorectum | AD | Coronavirus disease - COVID-19 | 113/2092 | 232/8465 | 9.90e-16 | 2.55e-14 | 1.63e-14 | 113 |
| hsa04666 | Colorectum | AD | Fc gamma R-mediated phagocytosis | 46/2092 | 97/8465 | 9.10e-07 | 1.22e-05 | 7.77e-06 | 46 |
| hsa051711 | Colorectum | AD | Coronavirus disease - COVID-19 | 113/2092 | 232/8465 | 9.90e-16 | 2.55e-14 | 1.63e-14 | 113 |
| hsa046661 | Colorectum | AD | Fc gamma R-mediated phagocytosis | 46/2092 | 97/8465 | 9.10e-07 | 1.22e-05 | 7.77e-06 | 46 |
| hsa051714 | Colorectum | MSS | Coronavirus disease - COVID-19 | 108/1875 | 232/8465 | 6.50e-17 | 1.67e-15 | 1.03e-15 | 108 |
| hsa046664 | Colorectum | MSS | Fc gamma R-mediated phagocytosis | 45/1875 | 97/8465 | 9.30e-08 | 1.56e-06 | 9.55e-07 | 45 |
| Page: 1 2 3 4 5 6 7 |
Top |
Cell-cell communication analysis |
| Identification of potential cell-cell interactions between two cell types and their ligand-receptor pairs for different disease states |
| Ligand | Receptor | LRpair | Pathway | Tissue | Disease Stage |
| Page: 1 |
Top |
Single-cell gene regulatory network inference analysis |
| Find out the significant the regulons (TFs) and the target genes of each regulon across cell types for different disease states |
| TF | Cell Type | Tissue | Disease Stage | Target Gene | RSS | Regulon Activity |
| ∗The dot plots of a searched regulon are shown for all cell subpopulations in each disease state of each tissue based on the regulon specific score inferred using pySCENIC and by calculating the average expression. |
| Page: 1 |
Top |
Somatic mutation of malignant transformation related genes |
| Annotation of somatic variants for genes involved in malignant transformation |
| Hugo Symbol | Variant Class | Variant Classification | dbSNP RS | HGVSc | HGVSp | HGVSp Short | SWISSPROT | BIOTYPE | SIFT | PolyPhen | Tumor Sample Barcode | Tissue | Histology | Sex | Age | Stage | Therapy Types | Drugs | Outcome |
| SYK | SNV | Missense_Mutation | novel | c.437N>G | p.Ala146Gly | p.A146G | P43405 | protein_coding | deleterious(0) | probably_damaging(0.991) | TCGA-A2-A0T0-01 | Breast | breast invasive carcinoma | Female | <65 | I/II | Chemotherapy | taxotere | SD |
| SYK | SNV | Missense_Mutation | novel | c.82N>G | p.Tyr28Asp | p.Y28D | P43405 | protein_coding | deleterious(0.03) | probably_damaging(1) | TCGA-AN-A046-01 | Breast | breast invasive carcinoma | Female | >=65 | I/II | Unknown | Unknown | SD |
| SYK | SNV | Missense_Mutation | c.852N>T | p.Trp284Cys | p.W284C | P43405 | protein_coding | tolerated(0.18) | benign(0.221) | TCGA-B6-A0WZ-01 | Breast | breast invasive carcinoma | Female | <65 | I/II | Unknown | Unknown | PD | |
| SYK | SNV | Missense_Mutation | rs200078199 | c.163N>A | p.Val55Met | p.V55M | P43405 | protein_coding | tolerated(0.25) | probably_damaging(0.937) | TCGA-C8-A12P-01 | Breast | breast invasive carcinoma | Female | <65 | I/II | Unknown | Unknown | SD |
| SYK | SNV | Missense_Mutation | novel | c.584N>A | p.Arg195Gln | p.R195Q | P43405 | protein_coding | deleterious(0.02) | possibly_damaging(0.761) | TCGA-2W-A8YY-01 | Cervix | cervical & endocervical cancer | Female | <65 | I/II | Chemotherapy | cisplatin | CR |
| SYK | SNV | Missense_Mutation | rs139388374 | c.1004N>A | p.Gly335Asp | p.G335D | P43405 | protein_coding | tolerated(0.66) | benign(0) | TCGA-C5-A1BL-01 | Cervix | cervical & endocervical cancer | Female | <65 | I/II | Unknown | Unknown | SD |
| SYK | SNV | Missense_Mutation | c.355C>T | p.Pro119Ser | p.P119S | P43405 | protein_coding | tolerated(0.47) | benign(0.047) | TCGA-A6-2686-01 | Colorectum | colon adenocarcinoma | Female | >=65 | I/II | Unknown | Unknown | SD | |
| SYK | SNV | Missense_Mutation | novel | c.1841A>G | p.Glu614Gly | p.E614G | P43405 | protein_coding | deleterious(0) | benign(0.267) | TCGA-AA-3950-01 | Colorectum | colon adenocarcinoma | Female | >=65 | I/II | Unknown | Unknown | SD |
| SYK | SNV | Missense_Mutation | c.272N>G | p.Tyr91Cys | p.Y91C | P43405 | protein_coding | deleterious(0) | probably_damaging(1) | TCGA-AY-6197-01 | Colorectum | colon adenocarcinoma | Male | <65 | I/II | Unknown | Unknown | SD | |
| SYK | SNV | Missense_Mutation | rs200167353 | c.1057G>A | p.Ala353Thr | p.A353T | P43405 | protein_coding | deleterious(0.02) | possibly_damaging(0.891) | TCGA-D5-6922-01 | Colorectum | colon adenocarcinoma | Male | >=65 | III/IV | Unknown | Unknown | SD |
| Page: 1 2 3 4 5 6 7 8 |
Top |
Related drugs of malignant transformation related genes |
| Identification of chemicals and drugs interact with genes involved in malignant transfromation |
| (DGIdb 4.0) |
| Entrez ID | Symbol | Category | Interaction Types | Drug Claim Name | Drug Name | PMIDs |
| 6850 | SYK | CLINICALLY ACTIONABLE, KINASE, TYROSINE KINASE, ENZYME, SERINE THREONINE KINASE, DRUGGABLE GENOME, DRUG RESISTANCE | inhibitor | 328083490 | ||
| 6850 | SYK | CLINICALLY ACTIONABLE, KINASE, TYROSINE KINASE, ENZYME, SERINE THREONINE KINASE, DRUGGABLE GENOME, DRUG RESISTANCE | inhibitor | 340590230 | ||
| 6850 | SYK | CLINICALLY ACTIONABLE, KINASE, TYROSINE KINASE, ENZYME, SERINE THREONINE KINASE, DRUGGABLE GENOME, DRUG RESISTANCE | CYC-116 | CYC-116 | ||
| 6850 | SYK | CLINICALLY ACTIONABLE, KINASE, TYROSINE KINASE, ENZYME, SERINE THREONINE KINASE, DRUGGABLE GENOME, DRUG RESISTANCE | PRT-062607 | PRT-2607 | 24419749 | |
| 6850 | SYK | CLINICALLY ACTIONABLE, KINASE, TYROSINE KINASE, ENZYME, SERINE THREONINE KINASE, DRUGGABLE GENOME, DRUG RESISTANCE | inhibitor | 178102670 | ||
| 6850 | SYK | CLINICALLY ACTIONABLE, KINASE, TYROSINE KINASE, ENZYME, SERINE THREONINE KINASE, DRUGGABLE GENOME, DRUG RESISTANCE | TAK-659 | TAK-659 | ||
| 6850 | SYK | CLINICALLY ACTIONABLE, KINASE, TYROSINE KINASE, ENZYME, SERINE THREONINE KINASE, DRUGGABLE GENOME, DRUG RESISTANCE | inhibitor | FOSTAMATINIB | FOSTAMATINIB | |
| 6850 | SYK | CLINICALLY ACTIONABLE, KINASE, TYROSINE KINASE, ENZYME, SERINE THREONINE KINASE, DRUGGABLE GENOME, DRUG RESISTANCE | inhibitor | 348353652 | ||
| 6850 | SYK | CLINICALLY ACTIONABLE, KINASE, TYROSINE KINASE, ENZYME, SERINE THREONINE KINASE, DRUGGABLE GENOME, DRUG RESISTANCE | ACU-XSP-001 | |||
| 6850 | SYK | CLINICALLY ACTIONABLE, KINASE, TYROSINE KINASE, ENZYME, SERINE THREONINE KINASE, DRUGGABLE GENOME, DRUG RESISTANCE | inhibitor | CHEMBL3545340 | R-343 |
| Page: 1 2 3 4 5 6 7 |

Copyright 2023-Present -The University of Texas Health Science Center at Houston |