
|
|||||
|
 | |
| |
| |
| |
| |
| |
|
Gene: STK40 |
Gene summary for STK40 |
| Gene information | Species | Human | Gene symbol | STK40 | Gene ID | 83931 |
| Gene name | serine/threonine kinase 40 | |
| Gene Alias | SHIK | |
| Cytomap | 1p34.3 | |
| Gene Type | protein-coding | GO ID | GO:0000165 | UniProtAcc | Q8N2I9 |
Top |
Malignant transformation analysis |
| Identification of the aberrant gene expression in precancerous and cancerous lesions by comparing the gene expression of stem-like cells in diseased tissues with normal stem cells |
| Entrez ID | Symbol | Replicates | Species | Organ | Tissue | Adj P-value | Log2FC | Malignancy |
| 83931 | STK40 | S027 | Human | Liver | HCC | 4.85e-15 | 1.23e+00 | 0.2446 |
| 83931 | STK40 | S028 | Human | Liver | HCC | 3.19e-24 | 9.63e-01 | 0.2503 |
| 83931 | STK40 | S029 | Human | Liver | HCC | 8.72e-31 | 1.28e+00 | 0.2581 |
| 83931 | STK40 | RNA-P17T-P17T-2 | Human | Lung | IAC | 4.41e-03 | 6.57e-01 | 0.3371 |
| 83931 | STK40 | RNA-P17T-P17T-4 | Human | Lung | IAC | 6.09e-04 | 6.02e-01 | 0.343 |
| 83931 | STK40 | RNA-P17T-P17T-6 | Human | Lung | IAC | 2.26e-03 | 6.93e-01 | 0.3385 |
| 83931 | STK40 | RNA-P17T-P17T-8 | Human | Lung | IAC | 9.32e-04 | 6.67e-01 | 0.3329 |
| 83931 | STK40 | RNA-P6T2-P6T2-2 | Human | Lung | IAC | 2.60e-06 | 3.04e-01 | -0.0132 |
| 83931 | STK40 | RNA-P6T2-P6T2-3 | Human | Lung | IAC | 1.12e-02 | 1.98e-01 | -0.013 |
| 83931 | STK40 | 047563_1562-all-cells | Human | Prostate | BPH | 9.65e-07 | 1.34e-01 | 0.0791 |
| 83931 | STK40 | 048752_1579-all-cells | Human | Prostate | BPH | 2.86e-35 | 7.00e-01 | 0.1008 |
| 83931 | STK40 | 052097_1595-all-cells | Human | Prostate | BPH | 2.73e-23 | 5.35e-01 | 0.0972 |
| 83931 | STK40 | 052099_1652-all-cells | Human | Prostate | BPH | 7.97e-12 | 4.17e-01 | 0.1038 |
| 83931 | STK40 | Dong_P1 | Human | Prostate | Tumor | 3.06e-21 | 1.19e-01 | 0.035 |
| 83931 | STK40 | Dong_P5 | Human | Prostate | Tumor | 6.84e-09 | -1.37e-01 | 0.053 |
| 83931 | STK40 | GSM5353244_PA_PR5261_T2_S24_L002 | Human | Prostate | Tumor | 1.58e-02 | -1.22e-01 | 0.1569 |
| Page: 1 2 3 4 5 |
| Tissue | Expression Dynamics | Abbreviation |
| Colorectum (GSE201348) |  | FAP: Familial adenomatous polyposis |
| CRC: Colorectal cancer | ||
| Colorectum (HTA11) |  | AD: Adenomas |
| SER: Sessile serrated lesions | ||
| MSI-H: Microsatellite-high colorectal cancer | ||
| MSS: Microsatellite stable colorectal cancer | ||
| Esophagus |  | ESCC: Esophageal squamous cell carcinoma |
| HGIN: High-grade intraepithelial neoplasias | ||
| LGIN: Low-grade intraepithelial neoplasias | ||
| Liver |  | HCC: Hepatocellular carcinoma |
| NAFLD: Non-alcoholic fatty liver disease | ||
| Lung |  | AAH: Atypical adenomatous hyperplasia |
| AIS: Adenocarcinoma in situ | ||
| IAC: Invasive lung adenocarcinoma | ||
| MIA: Minimally invasive adenocarcinoma | ||
| Prostate | 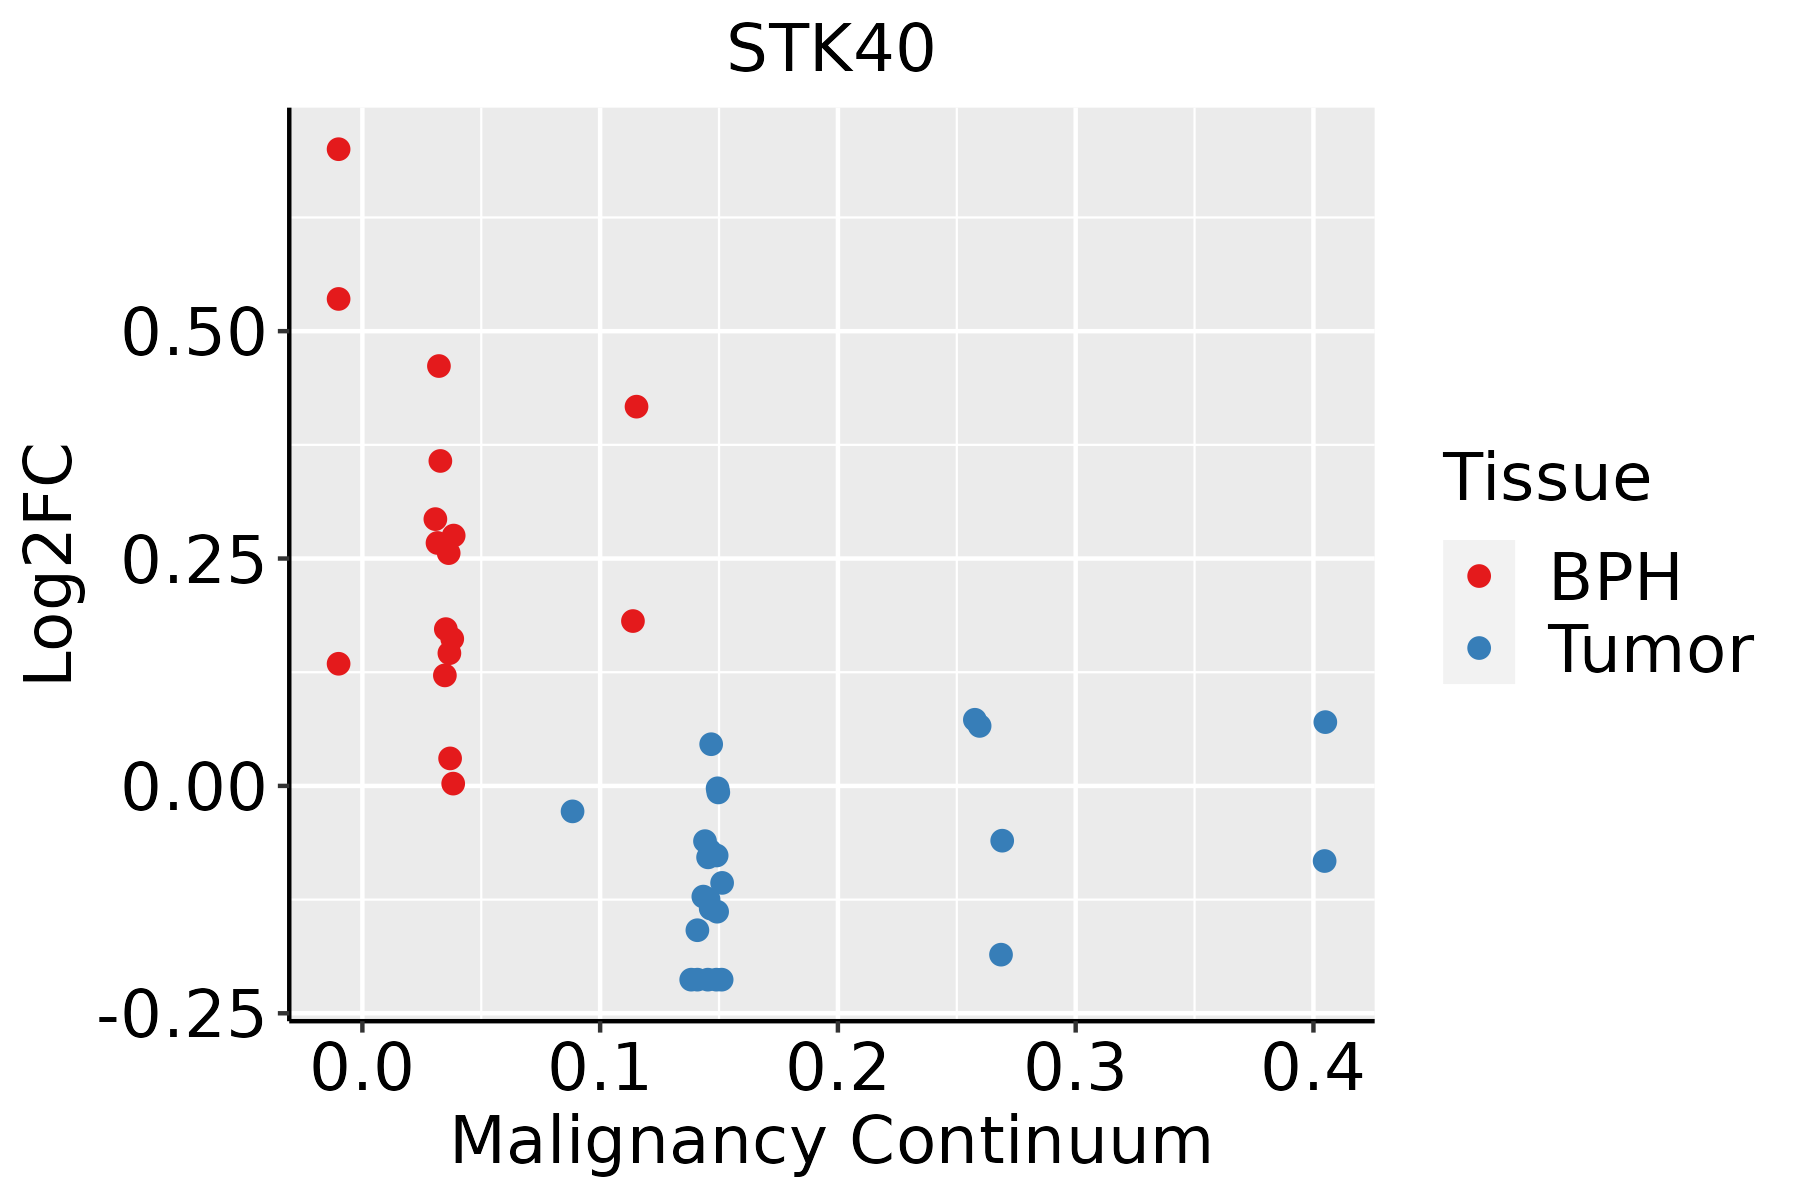 | BPH: Benign Prostatic Hyperplasia |
| ∗log2FC in expression of this searched gene in stem-like cells from each diseased tissue sample relative to stem-like cells in normal samples in each tissue plotted against the malignancy continuum. Samples are colored based on if they are from different disease stage. |
Top |
Malignant transformation related pathway analysis |
| Find out the enriched GO biological processes and KEGG pathways involved in transition from healthy to precancer to cancer |
| Tissue | Disease Stage | Enriched GO biological Processes |
| Colorectum | AD |  |
| Colorectum | SER |  |
| Colorectum | MSS |  |
| Colorectum | MSI-H |  |
| Colorectum | FAP |  |
| ∗Top 15 enriched GO BP terms are showed in the bar plot of each disease state in each tissue. Each row represents a significant GO biological process which is colored according to the -log10(p.adjust). |
| Page: 1 2 3 4 5 6 7 8 9 |
| GO ID | Tissue | Disease Stage | Description | Gene Ratio | Bg Ratio | pvalue | p.adjust | Count |
| GO:0006091 | Colorectum | AD | generation of precursor metabolites and energy | 209/3918 | 490/18723 | 3.17e-28 | 6.61e-25 | 209 |
| GO:0015980 | Colorectum | AD | energy derivation by oxidation of organic compounds | 143/3918 | 318/18723 | 2.78e-22 | 2.49e-19 | 143 |
| GO:0044262 | Colorectum | AD | cellular carbohydrate metabolic process | 87/3918 | 283/18723 | 6.00e-05 | 1.01e-03 | 87 |
| GO:0060425 | Colorectum | AD | lung morphogenesis | 20/3918 | 50/18723 | 1.65e-03 | 1.38e-02 | 20 |
| GO:00060911 | Colorectum | SER | generation of precursor metabolites and energy | 168/2897 | 490/18723 | 1.39e-25 | 1.70e-22 | 168 |
| GO:00159801 | Colorectum | SER | energy derivation by oxidation of organic compounds | 119/2897 | 318/18723 | 5.28e-22 | 4.62e-19 | 119 |
| GO:00060912 | Colorectum | MSS | generation of precursor metabolites and energy | 186/3467 | 490/18723 | 1.14e-24 | 2.15e-21 | 186 |
| GO:00159802 | Colorectum | MSS | energy derivation by oxidation of organic compounds | 131/3467 | 318/18723 | 2.60e-21 | 2.70e-18 | 131 |
| GO:00604251 | Colorectum | MSS | lung morphogenesis | 20/3467 | 50/18723 | 3.25e-04 | 4.21e-03 | 20 |
| GO:0035264 | Colorectum | MSS | multicellular organism growth | 37/3467 | 132/18723 | 4.77e-03 | 3.34e-02 | 37 |
| GO:00060914 | Colorectum | FAP | generation of precursor metabolites and energy | 128/2622 | 490/18723 | 5.58e-13 | 4.28e-10 | 128 |
| GO:00159804 | Colorectum | FAP | energy derivation by oxidation of organic compounds | 85/2622 | 318/18723 | 1.36e-09 | 2.77e-07 | 85 |
| GO:00442621 | Colorectum | FAP | cellular carbohydrate metabolic process | 66/2622 | 283/18723 | 1.53e-05 | 4.01e-04 | 66 |
| GO:00604252 | Colorectum | FAP | lung morphogenesis | 16/2622 | 50/18723 | 9.14e-04 | 9.20e-03 | 16 |
| GO:00352641 | Colorectum | FAP | multicellular organism growth | 31/2622 | 132/18723 | 2.28e-03 | 1.84e-02 | 31 |
| GO:0030323 | Colorectum | FAP | respiratory tube development | 39/2622 | 181/18723 | 3.60e-03 | 2.58e-02 | 39 |
| GO:0030324 | Colorectum | FAP | lung development | 38/2622 | 177/18723 | 4.28e-03 | 2.93e-02 | 38 |
| GO:0006091110 | Esophagus | ESCC | generation of precursor metabolites and energy | 331/8552 | 490/18723 | 3.86e-23 | 8.45e-21 | 331 |
| GO:0015980110 | Esophagus | ESCC | energy derivation by oxidation of organic compounds | 220/8552 | 318/18723 | 1.20e-17 | 1.09e-15 | 220 |
| GO:00303239 | Esophagus | ESCC | respiratory tube development | 112/8552 | 181/18723 | 7.82e-06 | 7.69e-05 | 112 |
| Page: 1 2 3 |
| Pathway ID | Tissue | Disease Stage | Description | Gene Ratio | Bg Ratio | pvalue | p.adjust | qvalue | Count |
| Page: 1 |
Top |
Cell-cell communication analysis |
| Identification of potential cell-cell interactions between two cell types and their ligand-receptor pairs for different disease states |
| Ligand | Receptor | LRpair | Pathway | Tissue | Disease Stage |
| Page: 1 |
Top |
Single-cell gene regulatory network inference analysis |
| Find out the significant the regulons (TFs) and the target genes of each regulon across cell types for different disease states |
| TF | Cell Type | Tissue | Disease Stage | Target Gene | RSS | Regulon Activity |
| ∗The dot plots of a searched regulon are shown for all cell subpopulations in each disease state of each tissue based on the regulon specific score inferred using pySCENIC and by calculating the average expression. |
| Page: 1 |
Top |
Somatic mutation of malignant transformation related genes |
| Annotation of somatic variants for genes involved in malignant transformation |
| Hugo Symbol | Variant Class | Variant Classification | dbSNP RS | HGVSc | HGVSp | HGVSp Short | SWISSPROT | BIOTYPE | SIFT | PolyPhen | Tumor Sample Barcode | Tissue | Histology | Sex | Age | Stage | Therapy Types | Drugs | Outcome |
| STK40 | SNV | Missense_Mutation | novel | c.511N>C | p.Glu171Gln | p.E171Q | Q8N2I9 | protein_coding | tolerated(0.14) | probably_damaging(0.929) | TCGA-AR-A2LE-01 | Breast | breast invasive carcinoma | Female | >=65 | I/II | Hormone Therapy | tamoxiphen | PD |
| STK40 | SNV | Missense_Mutation | rs754087375 | c.1261N>A | p.Asp421Asn | p.D421N | Q8N2I9 | protein_coding | deleterious_low_confidence(0.01) | possibly_damaging(0.883) | TCGA-BH-A18S-01 | Breast | breast invasive carcinoma | Female | >=65 | I/II | Unknown | Unknown | SD |
| STK40 | SNV | Missense_Mutation | c.714N>C | p.Gln238His | p.Q238H | Q8N2I9 | protein_coding | deleterious(0) | probably_damaging(0.939) | TCGA-C8-A274-01 | Breast | breast invasive carcinoma | Female | <65 | I/II | Hormone Therapy | tamoxiphen | SD | |
| STK40 | deletion | Frame_Shift_Del | c.891delC | p.Ile298PhefsTer49 | p.I298Ffs*49 | Q8N2I9 | protein_coding | TCGA-D8-A27V-01 | Breast | breast invasive carcinoma | Female | <65 | I/II | Hormone Therapy | tamoxiphen | SD | |||
| STK40 | insertion | In_Frame_Ins | novel | c.67_102dupGGGATTTCTGGAAATAATGCAAAGAGAGCTGGACCA | p.Gly23_Pro34dup | p.G23_P34dup | Q8N2I9 | protein_coding | TCGA-E9-A2JS-01 | Breast | breast invasive carcinoma | Female | >=65 | I/II | Chemotherapy | cyclophosphamide | PD | ||
| STK40 | SNV | Missense_Mutation | novel | c.422N>A | p.Arg141His | p.R141H | Q8N2I9 | protein_coding | deleterious(0) | probably_damaging(0.992) | TCGA-C5-A1MH-01 | Cervix | cervical & endocervical cancer | Female | >=65 | III/IV | Chemotherapy | cisplatin | PD |
| STK40 | SNV | Missense_Mutation | novel | c.445C>A | p.Leu149Ile | p.L149I | Q8N2I9 | protein_coding | deleterious(0.02) | possibly_damaging(0.814) | TCGA-AA-3949-01 | Colorectum | colon adenocarcinoma | Female | >=65 | III/IV | Unknown | Unknown | SD |
| STK40 | SNV | Missense_Mutation | rs773276972 | c.745N>A | p.Val249Met | p.V249M | Q8N2I9 | protein_coding | deleterious(0) | probably_damaging(0.947) | TCGA-CK-4947-01 | Colorectum | colon adenocarcinoma | Female | <65 | III/IV | Other, specify in notes | folinic | SD |
| STK40 | SNV | Missense_Mutation | rs150712193 | c.767G>A | p.Arg256His | p.R256H | Q8N2I9 | protein_coding | tolerated(0.53) | benign(0.365) | TCGA-CK-4951-01 | Colorectum | colon adenocarcinoma | Female | >=65 | I/II | Unknown | Unknown | PD |
| STK40 | SNV | Missense_Mutation | c.296A>G | p.Tyr99Cys | p.Y99C | Q8N2I9 | protein_coding | deleterious(0) | probably_damaging(0.971) | TCGA-CK-4951-01 | Colorectum | colon adenocarcinoma | Female | >=65 | I/II | Unknown | Unknown | PD |
| Page: 1 2 3 4 5 |
Top |
Related drugs of malignant transformation related genes |
| Identification of chemicals and drugs interact with genes involved in malignant transfromation |
| (DGIdb 4.0) |
| Entrez ID | Symbol | Category | Interaction Types | Drug Claim Name | Drug Name | PMIDs |
| Page: 1 |

Copyright 2023-Present -The University of Texas Health Science Center at Houston |