
|
|||||
|
 | |
| |
| |
| |
| |
| |
|
Gene: SPRYD7 |
Gene summary for SPRYD7 |
| Gene information | Species | Human | Gene symbol | SPRYD7 | Gene ID | 57213 |
| Gene name | SPRY domain containing 7 | |
| Gene Alias | C13orf1 | |
| Cytomap | 13q14.2 | |
| Gene Type | protein-coding | GO ID | GO:0003674 | UniProtAcc | Q5W111 |
Top |
Malignant transformation analysis |
| Identification of the aberrant gene expression in precancerous and cancerous lesions by comparing the gene expression of stem-like cells in diseased tissues with normal stem cells |
| Entrez ID | Symbol | Replicates | Species | Organ | Tissue | Adj P-value | Log2FC | Malignancy |
| 57213 | SPRYD7 | LP17 | Human | Oral cavity | LP | 1.58e-02 | 5.85e-01 | 0.2349 |
| 57213 | SPRYD7 | SYSMH1 | Human | Oral cavity | OSCC | 3.13e-15 | 3.86e-01 | 0.1127 |
| 57213 | SPRYD7 | SYSMH2 | Human | Oral cavity | OSCC | 1.38e-18 | 6.07e-01 | 0.2326 |
| 57213 | SPRYD7 | SYSMH3 | Human | Oral cavity | OSCC | 8.68e-15 | 4.16e-01 | 0.2442 |
| 57213 | SPRYD7 | SYSMH6 | Human | Oral cavity | OSCC | 3.00e-02 | 1.68e-01 | 0.1275 |
| 57213 | SPRYD7 | P5_S10_cSCC | Human | Skin | cSCC | 2.72e-06 | 1.22e-01 | -0.299 |
| 57213 | SPRYD7 | P1_cSCC | Human | Skin | cSCC | 9.01e-16 | 5.78e-01 | 0.0292 |
| 57213 | SPRYD7 | P2_cSCC | Human | Skin | cSCC | 6.31e-08 | 2.73e-01 | -0.024 |
| 57213 | SPRYD7 | P4_cSCC | Human | Skin | cSCC | 1.71e-20 | 4.57e-01 | -0.00290000000000005 |
| 57213 | SPRYD7 | P10_cSCC | Human | Skin | cSCC | 3.18e-27 | 8.68e-01 | 0.1017 |
| 57213 | SPRYD7 | male-WTA | Human | Thyroid | PTC | 6.08e-08 | 3.52e-02 | 0.1037 |
| 57213 | SPRYD7 | PTC01 | Human | Thyroid | PTC | 2.06e-08 | 8.58e-02 | 0.1899 |
| 57213 | SPRYD7 | PTC03 | Human | Thyroid | PTC | 2.13e-02 | 1.21e-01 | 0.1784 |
| 57213 | SPRYD7 | PTC04 | Human | Thyroid | PTC | 2.21e-04 | 1.07e-01 | 0.1927 |
| 57213 | SPRYD7 | PTC05 | Human | Thyroid | PTC | 7.92e-17 | 4.28e-01 | 0.2065 |
| 57213 | SPRYD7 | PTC06 | Human | Thyroid | PTC | 3.84e-20 | 4.30e-01 | 0.2057 |
| 57213 | SPRYD7 | PTC07 | Human | Thyroid | PTC | 9.72e-22 | 3.54e-01 | 0.2044 |
| 57213 | SPRYD7 | ATC11 | Human | Thyroid | ATC | 6.13e-05 | 3.23e-01 | 0.3386 |
| 57213 | SPRYD7 | ATC12 | Human | Thyroid | ATC | 2.45e-05 | 1.17e-01 | 0.34 |
| 57213 | SPRYD7 | ATC13 | Human | Thyroid | ATC | 8.72e-16 | 1.45e-01 | 0.34 |
| Page: 1 2 3 4 5 6 |
| Tissue | Expression Dynamics | Abbreviation |
| Esophagus | 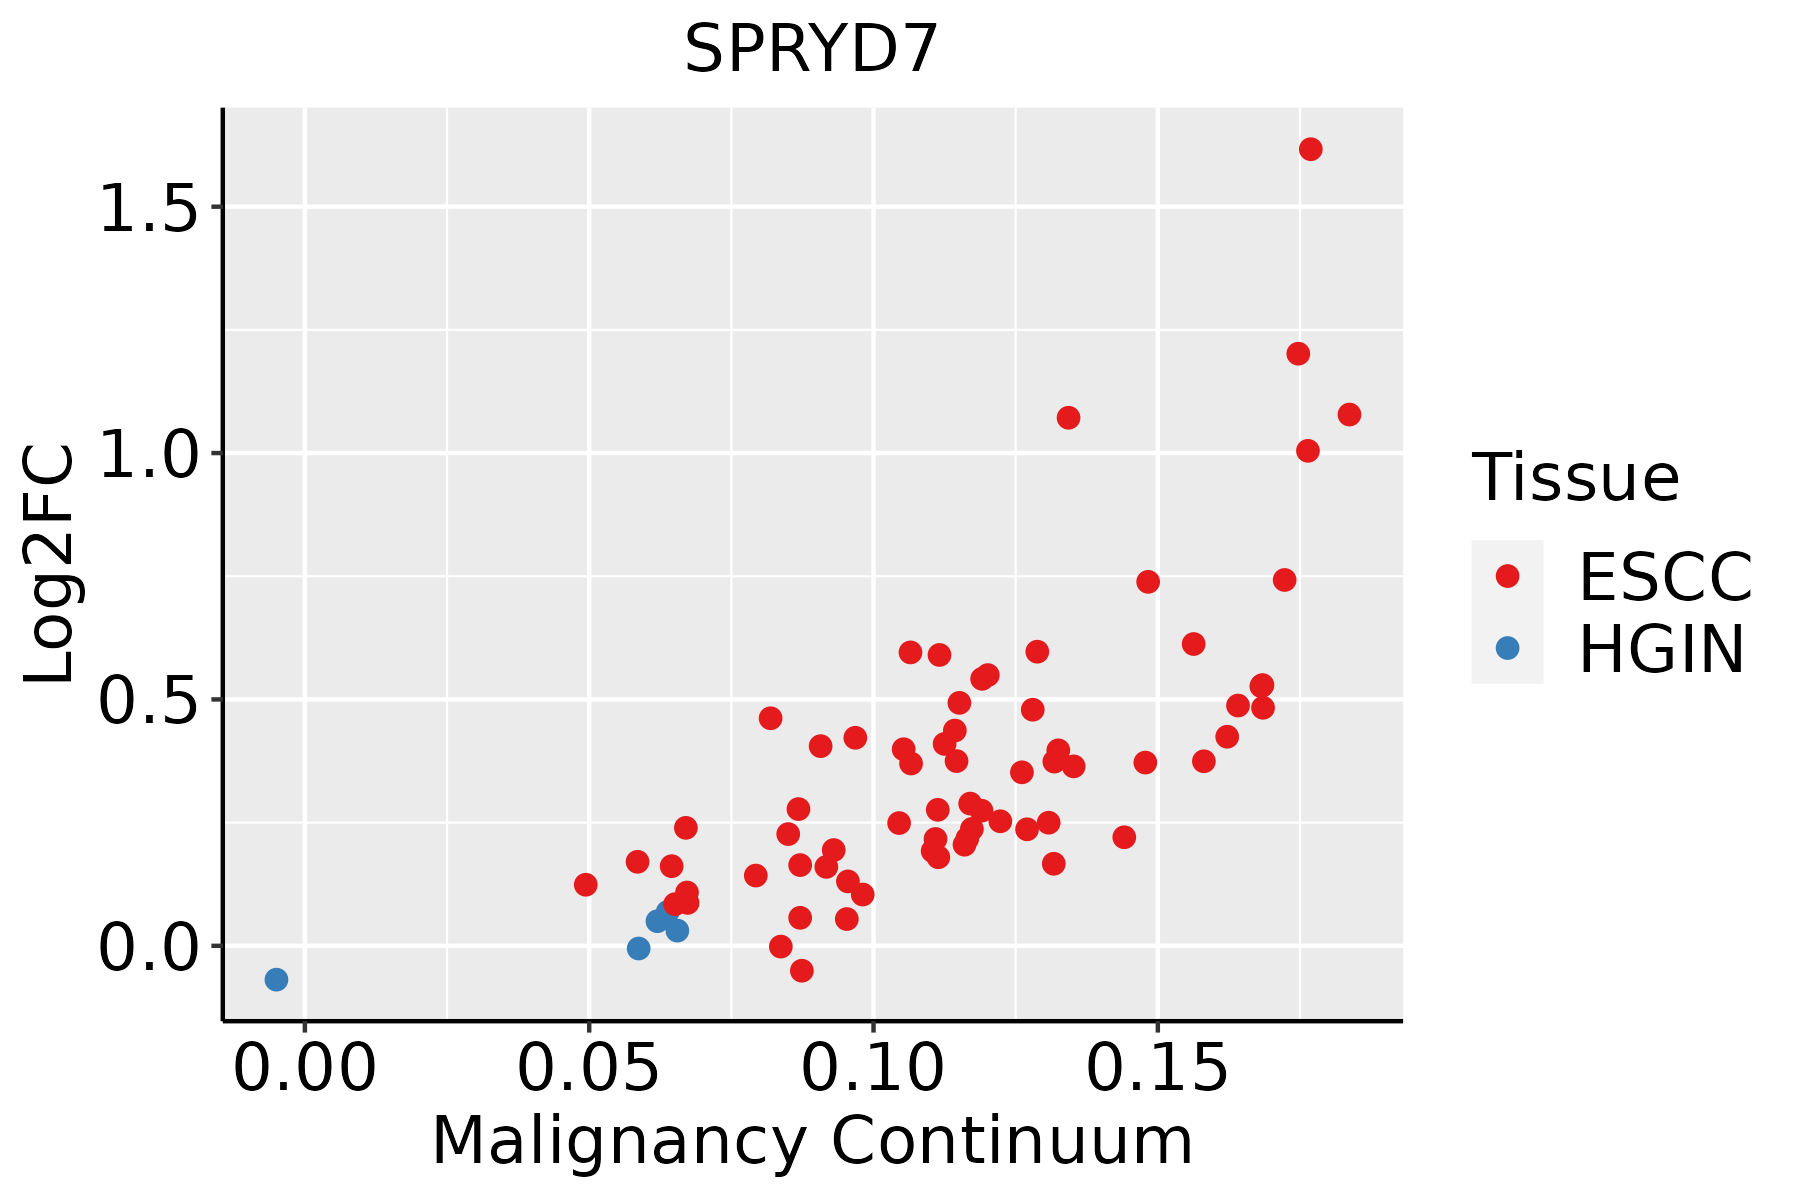 | ESCC: Esophageal squamous cell carcinoma |
| HGIN: High-grade intraepithelial neoplasias | ||
| LGIN: Low-grade intraepithelial neoplasias | ||
| Liver |  | HCC: Hepatocellular carcinoma |
| NAFLD: Non-alcoholic fatty liver disease | ||
| Oral Cavity | 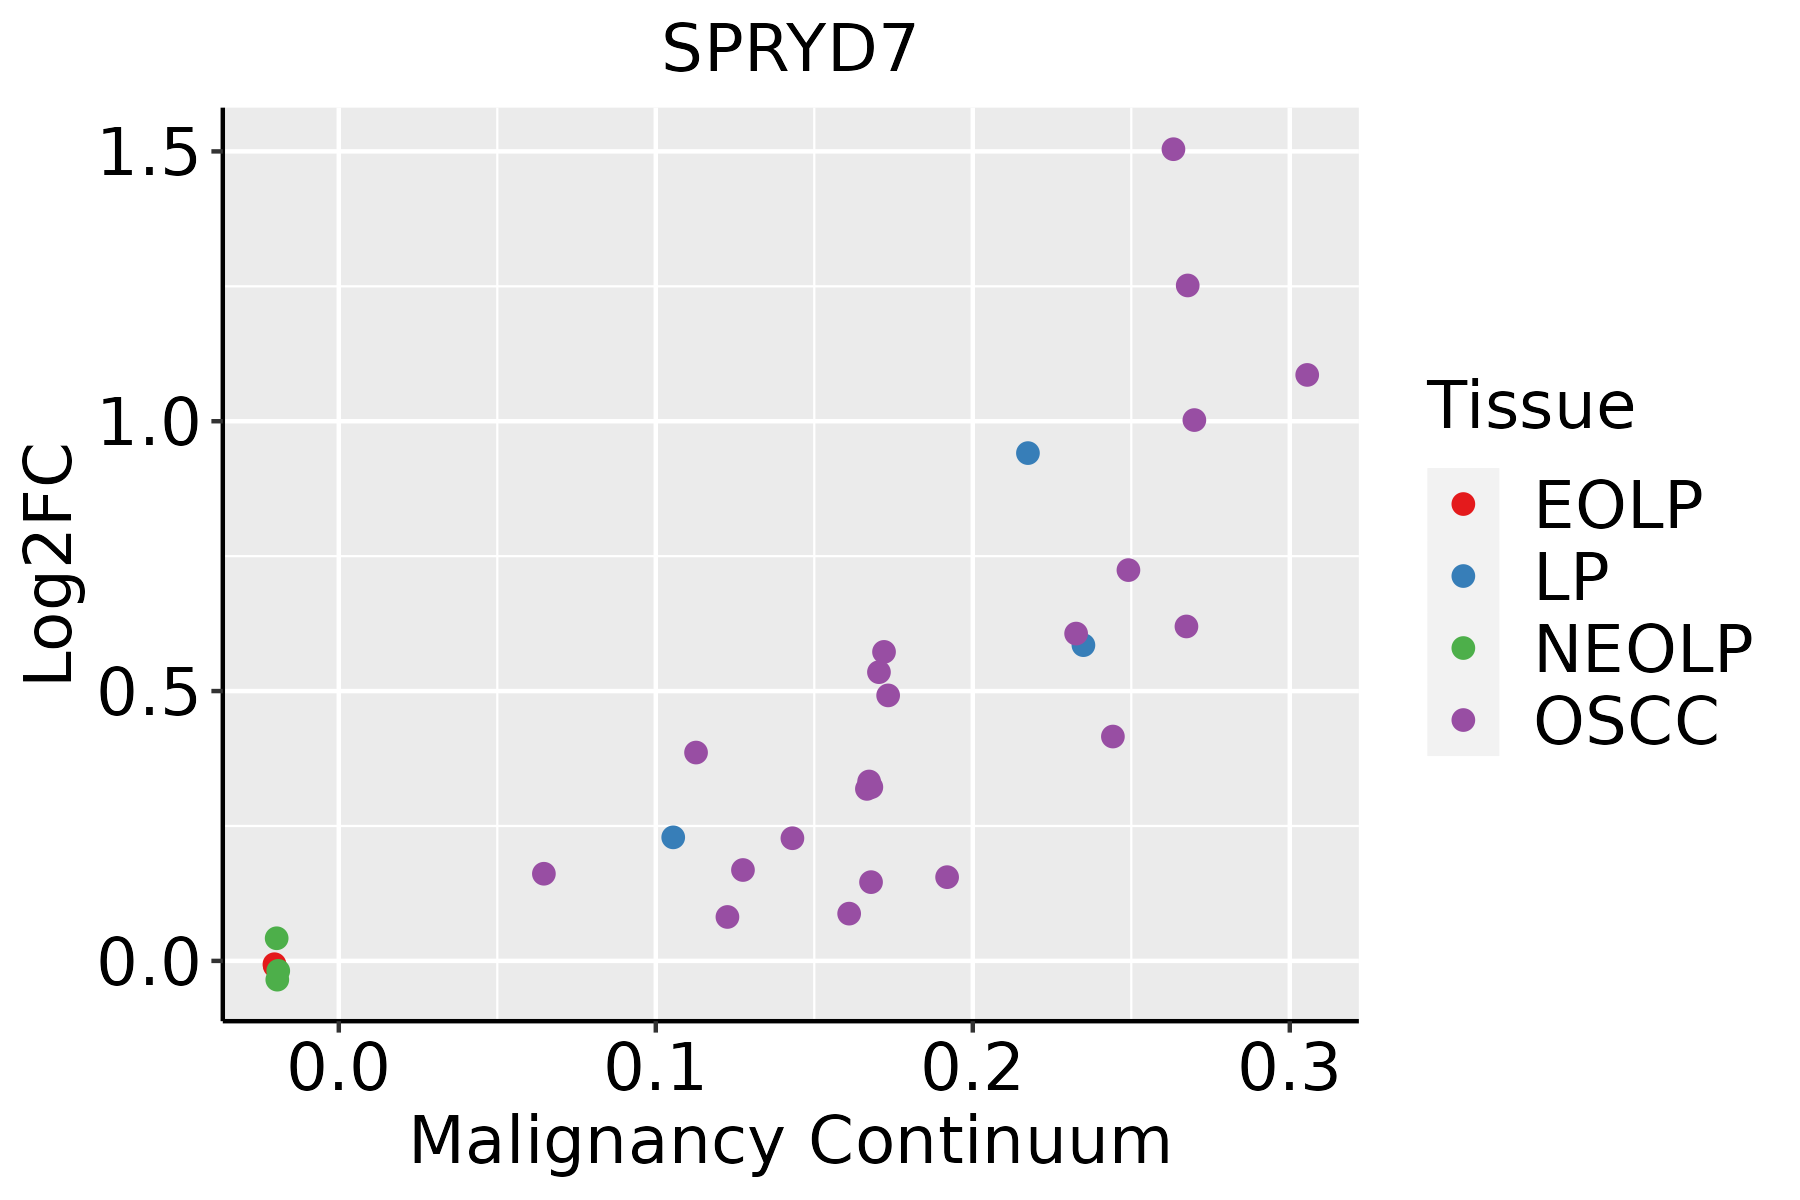 | EOLP: Erosive Oral lichen planus |
| LP: leukoplakia | ||
| NEOLP: Non-erosive oral lichen planus | ||
| OSCC: Oral squamous cell carcinoma | ||
| Skin | 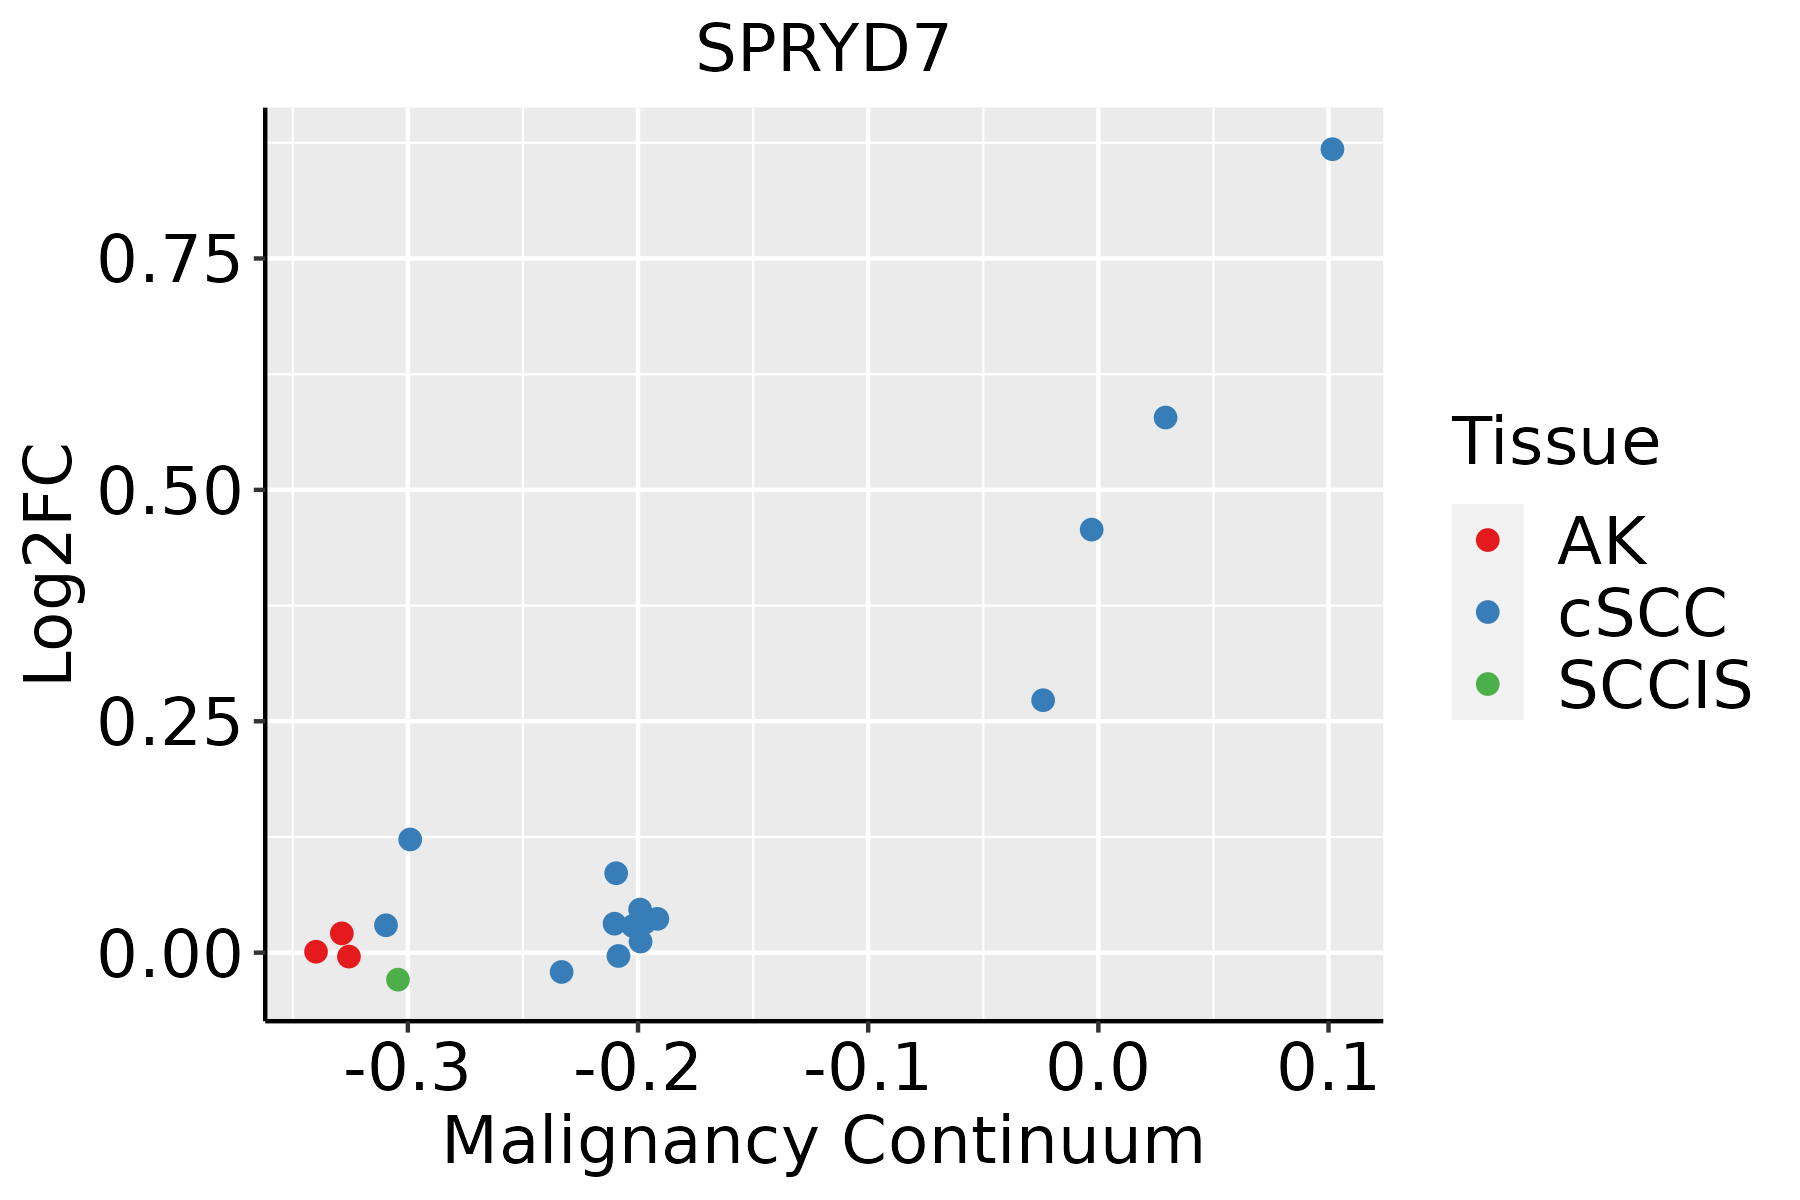 | AK: Actinic keratosis |
| cSCC: Cutaneous squamous cell carcinoma | ||
| SCCIS:squamous cell carcinoma in situ | ||
| Thyroid | 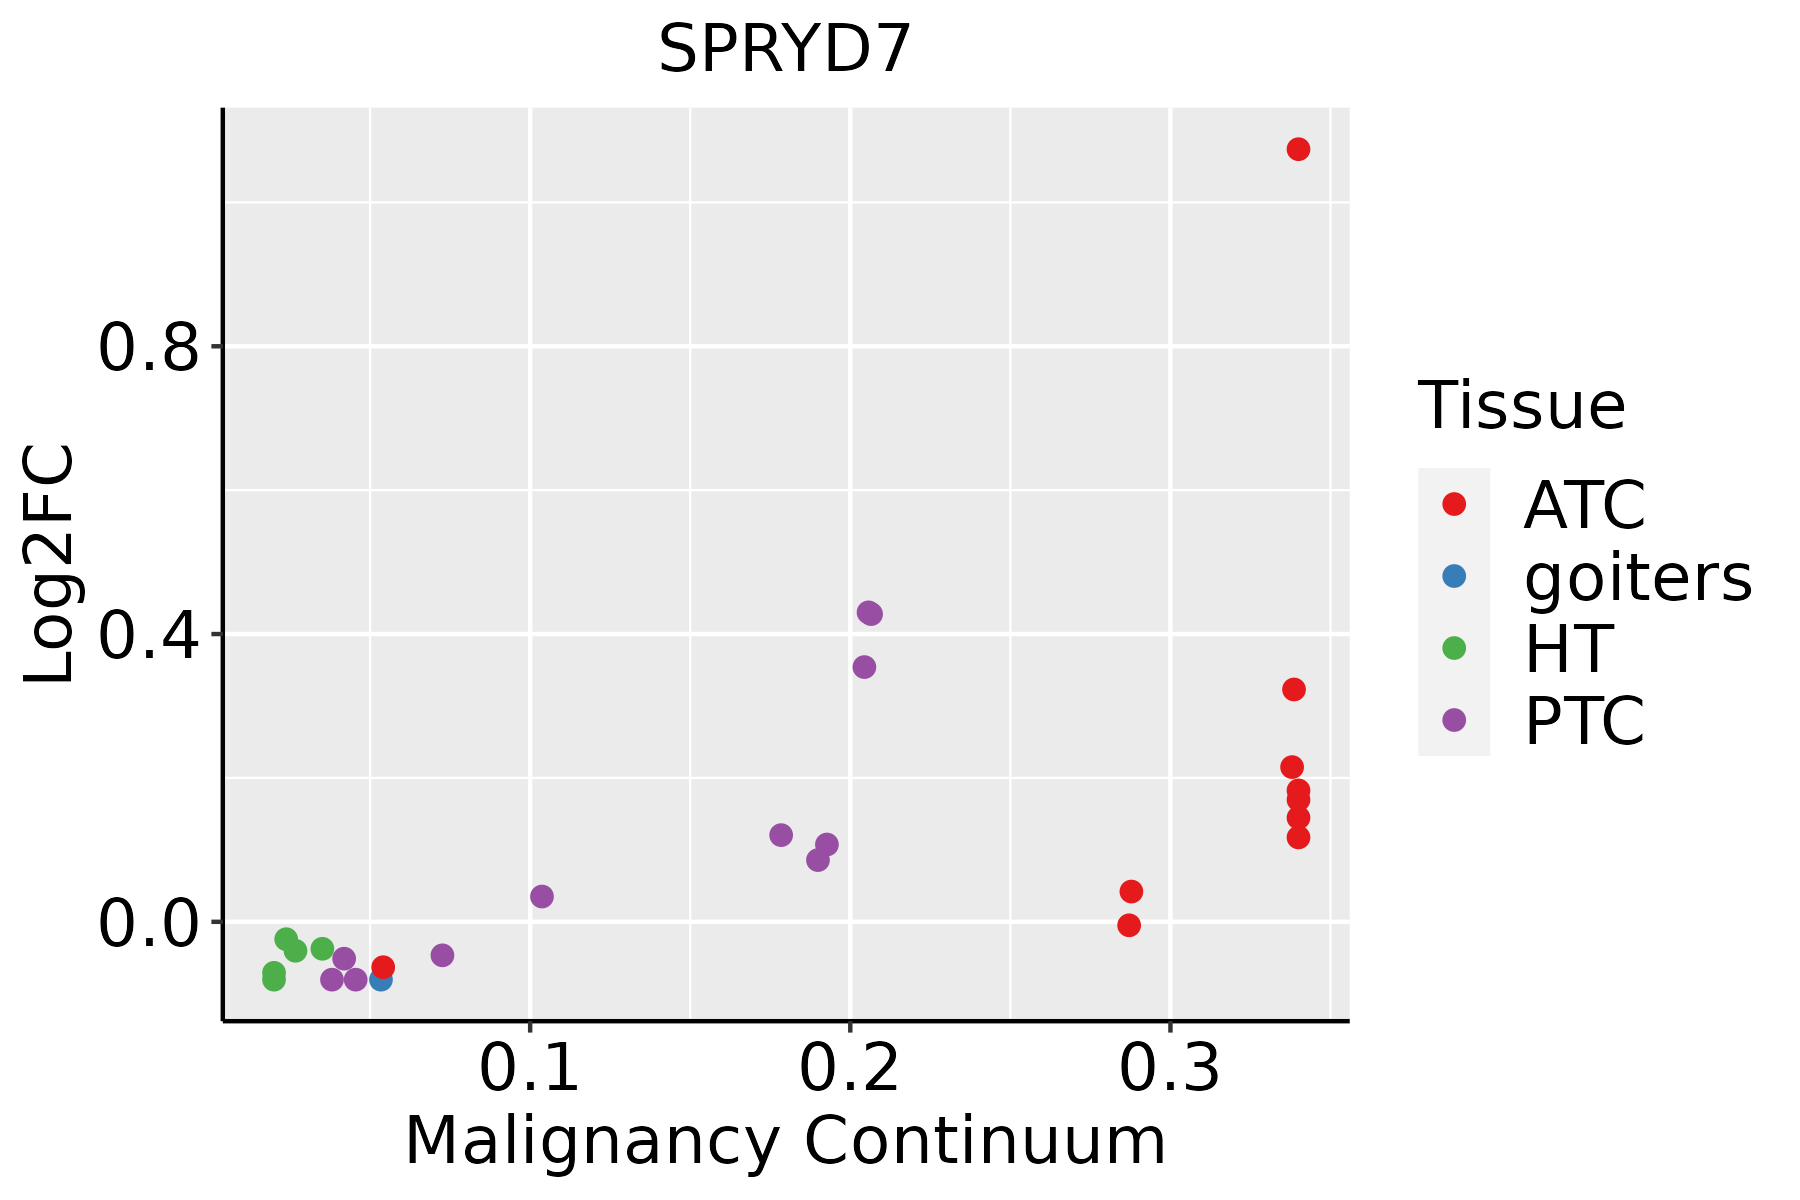 | ATC: Anaplastic thyroid cancer |
| HT: Hashimoto's thyroiditis | ||
| PTC: Papillary thyroid cancer |
| ∗log2FC in expression of this searched gene in stem-like cells from each diseased tissue sample relative to stem-like cells in normal samples in each tissue plotted against the malignancy continuum. Samples are colored based on if they are from different disease stage. |
Top |
Malignant transformation related pathway analysis |
| Find out the enriched GO biological processes and KEGG pathways involved in transition from healthy to precancer to cancer |
| Tissue | Disease Stage | Enriched GO biological Processes |
| Colorectum | AD |  |
| Colorectum | SER |  |
| Colorectum | MSS |  |
| Colorectum | MSI-H |  |
| Colorectum | FAP |  |
| ∗Top 15 enriched GO BP terms are showed in the bar plot of each disease state in each tissue. Each row represents a significant GO biological process which is colored according to the -log10(p.adjust). |
| Page: 1 2 3 4 5 6 7 8 9 |
| GO ID | Tissue | Disease Stage | Description | Gene Ratio | Bg Ratio | pvalue | p.adjust | Count |
| Page: 1 |
| Pathway ID | Tissue | Disease Stage | Description | Gene Ratio | Bg Ratio | pvalue | p.adjust | qvalue | Count |
| Page: 1 |
Top |
Cell-cell communication analysis |
| Identification of potential cell-cell interactions between two cell types and their ligand-receptor pairs for different disease states |
| Ligand | Receptor | LRpair | Pathway | Tissue | Disease Stage |
| Page: 1 |
Top |
Single-cell gene regulatory network inference analysis |
| Find out the significant the regulons (TFs) and the target genes of each regulon across cell types for different disease states |
| TF | Cell Type | Tissue | Disease Stage | Target Gene | RSS | Regulon Activity |
| ∗The dot plots of a searched regulon are shown for all cell subpopulations in each disease state of each tissue based on the regulon specific score inferred using pySCENIC and by calculating the average expression. |
| Page: 1 |
Top |
Somatic mutation of malignant transformation related genes |
| Annotation of somatic variants for genes involved in malignant transformation |
| Hugo Symbol | Variant Class | Variant Classification | dbSNP RS | HGVSc | HGVSp | HGVSp Short | SWISSPROT | BIOTYPE | SIFT | PolyPhen | Tumor Sample Barcode | Tissue | Histology | Sex | Age | Stage | Therapy Types | Drugs | Outcome |
| SPRYD7 | SNV | Missense_Mutation | rs763469553 | c.284G>A | p.Arg95Gln | p.R95Q | Q5W111 | protein_coding | tolerated(0.63) | benign(0.001) | TCGA-D8-A1JA-01 | Breast | breast invasive carcinoma | Female | <65 | III/IV | Chemotherapy | adriamycin | PD |
| SPRYD7 | SNV | Missense_Mutation | novel | c.11C>T | p.Ser4Leu | p.S4L | Q5W111 | protein_coding | tolerated(0.29) | benign(0) | TCGA-LD-A7W5-01 | Breast | breast invasive carcinoma | Female | <65 | III/IV | Chemotherapy | taxotere | SD |
| SPRYD7 | SNV | Missense_Mutation | rs772902529 | c.172N>A | p.Ala58Thr | p.A58T | Q5W111 | protein_coding | tolerated(0.14) | benign(0.082) | TCGA-AA-3845-01 | Colorectum | colon adenocarcinoma | Female | >=65 | I/II | Unknown | Unknown | PD |
| SPRYD7 | SNV | Missense_Mutation | novel | c.23N>A | p.Cys8Tyr | p.C8Y | Q5W111 | protein_coding | deleterious(0) | benign(0.063) | TCGA-A5-A0G2-01 | Endometrium | uterine corpus endometrioid carcinoma | Female | <65 | III/IV | Unknown | Unknown | SD |
| SPRYD7 | SNV | Missense_Mutation | rs772902529 | c.172N>A | p.Ala58Thr | p.A58T | Q5W111 | protein_coding | tolerated(0.14) | benign(0.082) | TCGA-AJ-A3EK-01 | Endometrium | uterine corpus endometrioid carcinoma | Female | <65 | I/II | Chemotherapy | carboplatin | CR |
| SPRYD7 | SNV | Missense_Mutation | novel | c.241N>A | p.Val81Ile | p.V81I | Q5W111 | protein_coding | tolerated(0.09) | possibly_damaging(0.622) | TCGA-AP-A1DK-01 | Endometrium | uterine corpus endometrioid carcinoma | Female | <65 | I/II | Unknown | Unknown | SD |
| SPRYD7 | SNV | Missense_Mutation | novel | c.534N>G | p.Phe178Leu | p.F178L | Q5W111 | protein_coding | deleterious(0) | probably_damaging(0.994) | TCGA-B5-A1MR-01 | Endometrium | uterine corpus endometrioid carcinoma | Female | >=65 | III/IV | Unknown | Unknown | SD |
| SPRYD7 | SNV | Missense_Mutation | novel | c.112G>A | p.Asp38Asn | p.D38N | Q5W111 | protein_coding | tolerated(0.09) | benign(0.142) | TCGA-E6-A1LX-01 | Endometrium | uterine corpus endometrioid carcinoma | Female | <65 | I/II | Unknown | Unknown | SD |
| SPRYD7 | SNV | Missense_Mutation | novel | c.374N>C | p.Gln125Pro | p.Q125P | Q5W111 | protein_coding | deleterious(0.01) | possibly_damaging(0.506) | TCGA-EC-A24G-01 | Endometrium | uterine corpus endometrioid carcinoma | Female | <65 | I/II | Chemotherapy | doxorubicin | SD |
| SPRYD7 | SNV | Missense_Mutation | c.77N>G | p.Pro26Arg | p.P26R | Q5W111 | protein_coding | deleterious(0.03) | probably_damaging(0.946) | TCGA-73-4668-01 | Lung | lung adenocarcinoma | Female | >=65 | I/II | Chemotherapy | pemetrexed | PD |
| Page: 1 2 |
Top |
Related drugs of malignant transformation related genes |
| Identification of chemicals and drugs interact with genes involved in malignant transfromation |
| (DGIdb 4.0) |
| Entrez ID | Symbol | Category | Interaction Types | Drug Claim Name | Drug Name | PMIDs |
| Page: 1 |

Copyright 2023-Present -The University of Texas Health Science Center at Houston |