
|
|||||
|
 | |
| |
| |
| |
| |
| |
|
Gene: SMUG1 |
Gene summary for SMUG1 |
| Gene information | Species | Human | Gene symbol | SMUG1 | Gene ID | 23583 |
| Gene name | single-strand-selective monofunctional uracil-DNA glycosylase 1 | |
| Gene Alias | FDG | |
| Cytomap | 12q13.13 | |
| Gene Type | protein-coding | GO ID | GO:0006139 | UniProtAcc | A0A024RAZ8 |
Top |
Malignant transformation analysis |
| Identification of the aberrant gene expression in precancerous and cancerous lesions by comparing the gene expression of stem-like cells in diseased tissues with normal stem cells |
| Entrez ID | Symbol | Replicates | Species | Organ | Tissue | Adj P-value | Log2FC | Malignancy |
| 23583 | SMUG1 | C57 | Human | Oral cavity | OSCC | 1.19e-29 | 7.41e-01 | 0.1679 |
| 23583 | SMUG1 | C06 | Human | Oral cavity | OSCC | 3.53e-04 | 1.04e+00 | 0.2699 |
| 23583 | SMUG1 | C08 | Human | Oral cavity | OSCC | 7.29e-40 | 7.66e-01 | 0.1919 |
| 23583 | SMUG1 | C09 | Human | Oral cavity | OSCC | 3.08e-03 | 1.94e-01 | 0.1431 |
| 23583 | SMUG1 | LN22 | Human | Oral cavity | OSCC | 4.44e-07 | 8.55e-01 | 0.1733 |
| 23583 | SMUG1 | LN46 | Human | Oral cavity | OSCC | 9.02e-19 | 6.39e-01 | 0.1666 |
| 23583 | SMUG1 | LP15 | Human | Oral cavity | LP | 2.71e-08 | 1.28e+00 | 0.2174 |
| 23583 | SMUG1 | SYSMH1 | Human | Oral cavity | OSCC | 6.10e-23 | 4.36e-01 | 0.1127 |
| 23583 | SMUG1 | SYSMH2 | Human | Oral cavity | OSCC | 3.87e-17 | 5.20e-01 | 0.2326 |
| 23583 | SMUG1 | SYSMH3 | Human | Oral cavity | OSCC | 6.29e-22 | 5.29e-01 | 0.2442 |
| 23583 | SMUG1 | SYSMH5 | Human | Oral cavity | OSCC | 4.25e-07 | 2.44e-01 | 0.0647 |
| 23583 | SMUG1 | SYSMH6 | Human | Oral cavity | OSCC | 1.38e-08 | 2.92e-01 | 0.1275 |
| 23583 | SMUG1 | P5_S10_cSCC | Human | Skin | cSCC | 4.67e-06 | 1.68e-01 | -0.299 |
| 23583 | SMUG1 | P1_cSCC | Human | Skin | cSCC | 1.83e-24 | 6.54e-01 | 0.0292 |
| 23583 | SMUG1 | P2_cSCC | Human | Skin | cSCC | 1.12e-14 | 3.37e-01 | -0.024 |
| 23583 | SMUG1 | P4_cSCC | Human | Skin | cSCC | 5.63e-16 | 3.87e-01 | -0.00290000000000005 |
| 23583 | SMUG1 | P10_cSCC | Human | Skin | cSCC | 3.15e-15 | 4.02e-01 | 0.1017 |
| Page: 1 2 3 4 5 |
| Tissue | Expression Dynamics | Abbreviation |
| Esophagus |  | ESCC: Esophageal squamous cell carcinoma |
| HGIN: High-grade intraepithelial neoplasias | ||
| LGIN: Low-grade intraepithelial neoplasias | ||
| Liver | 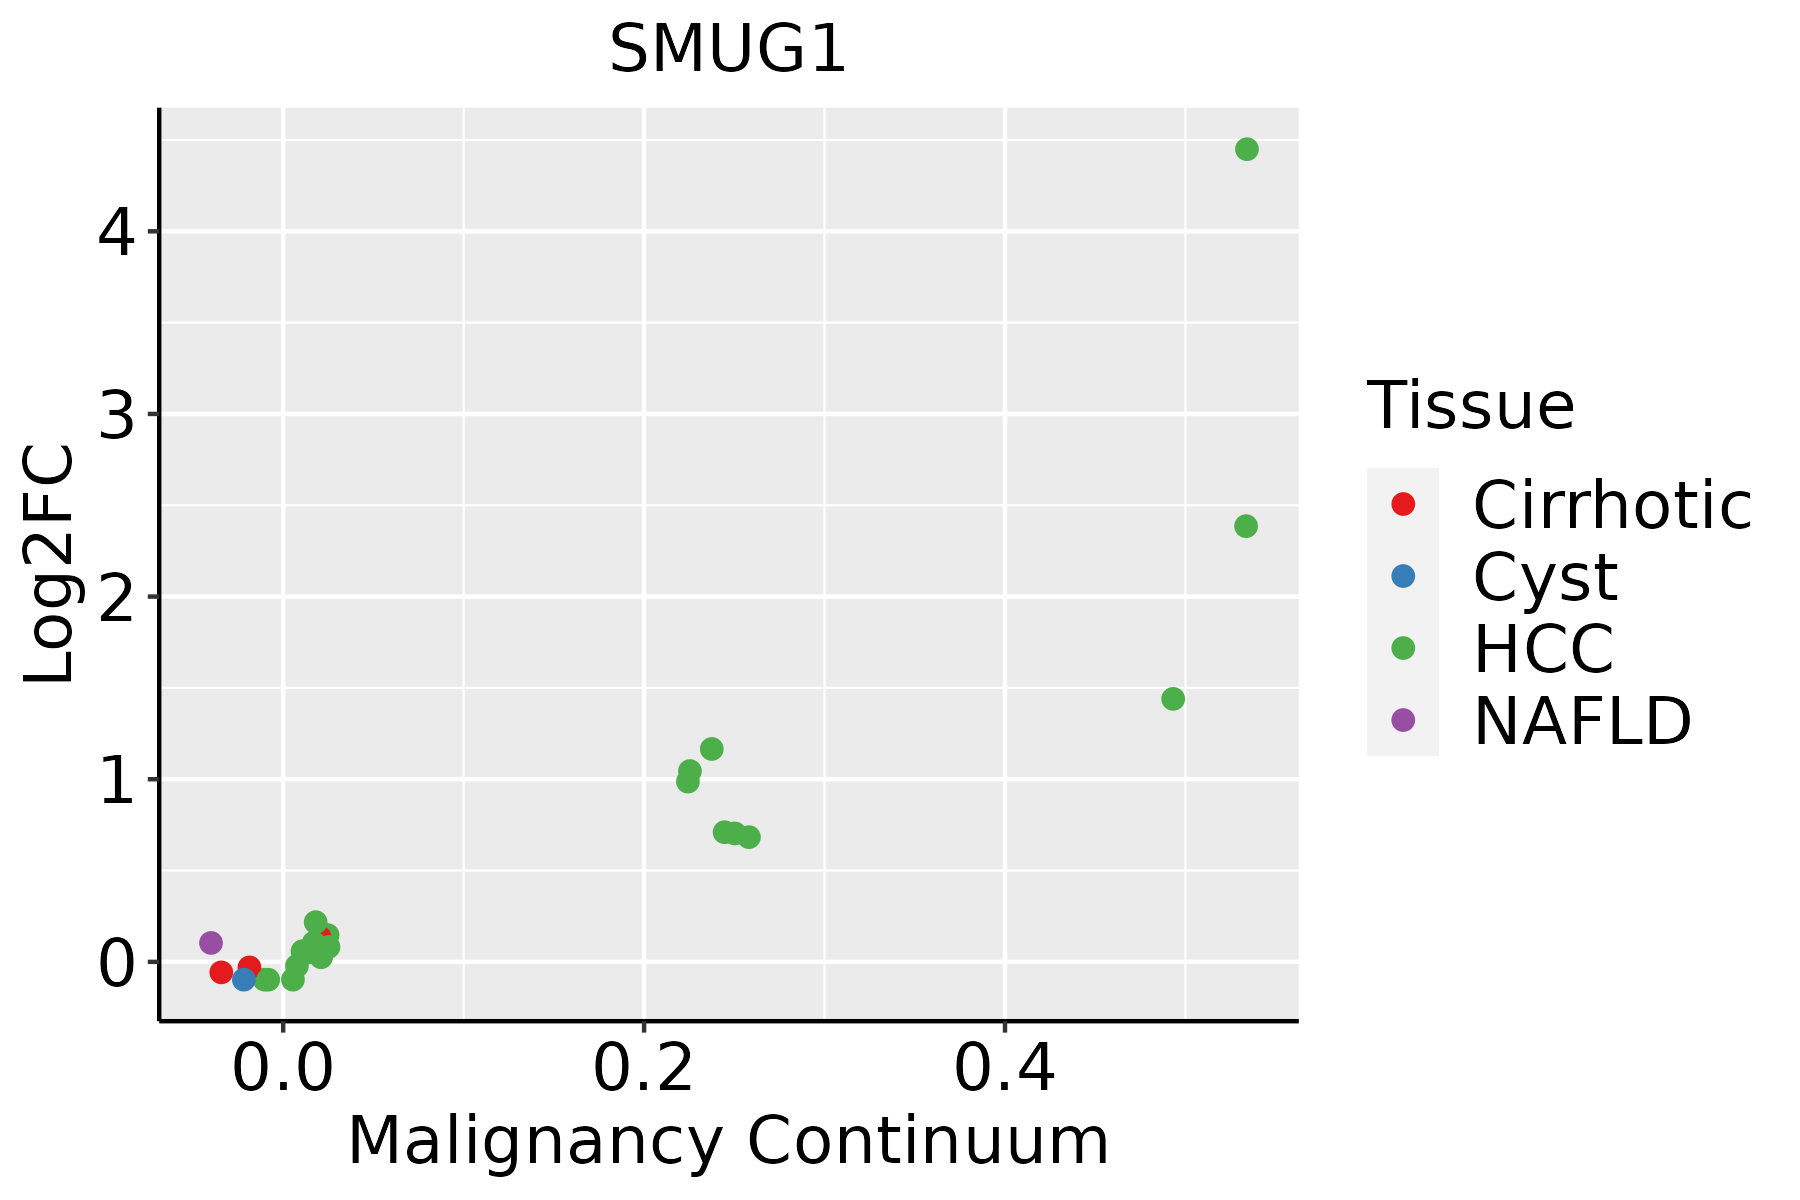 | HCC: Hepatocellular carcinoma |
| NAFLD: Non-alcoholic fatty liver disease | ||
| Oral Cavity | 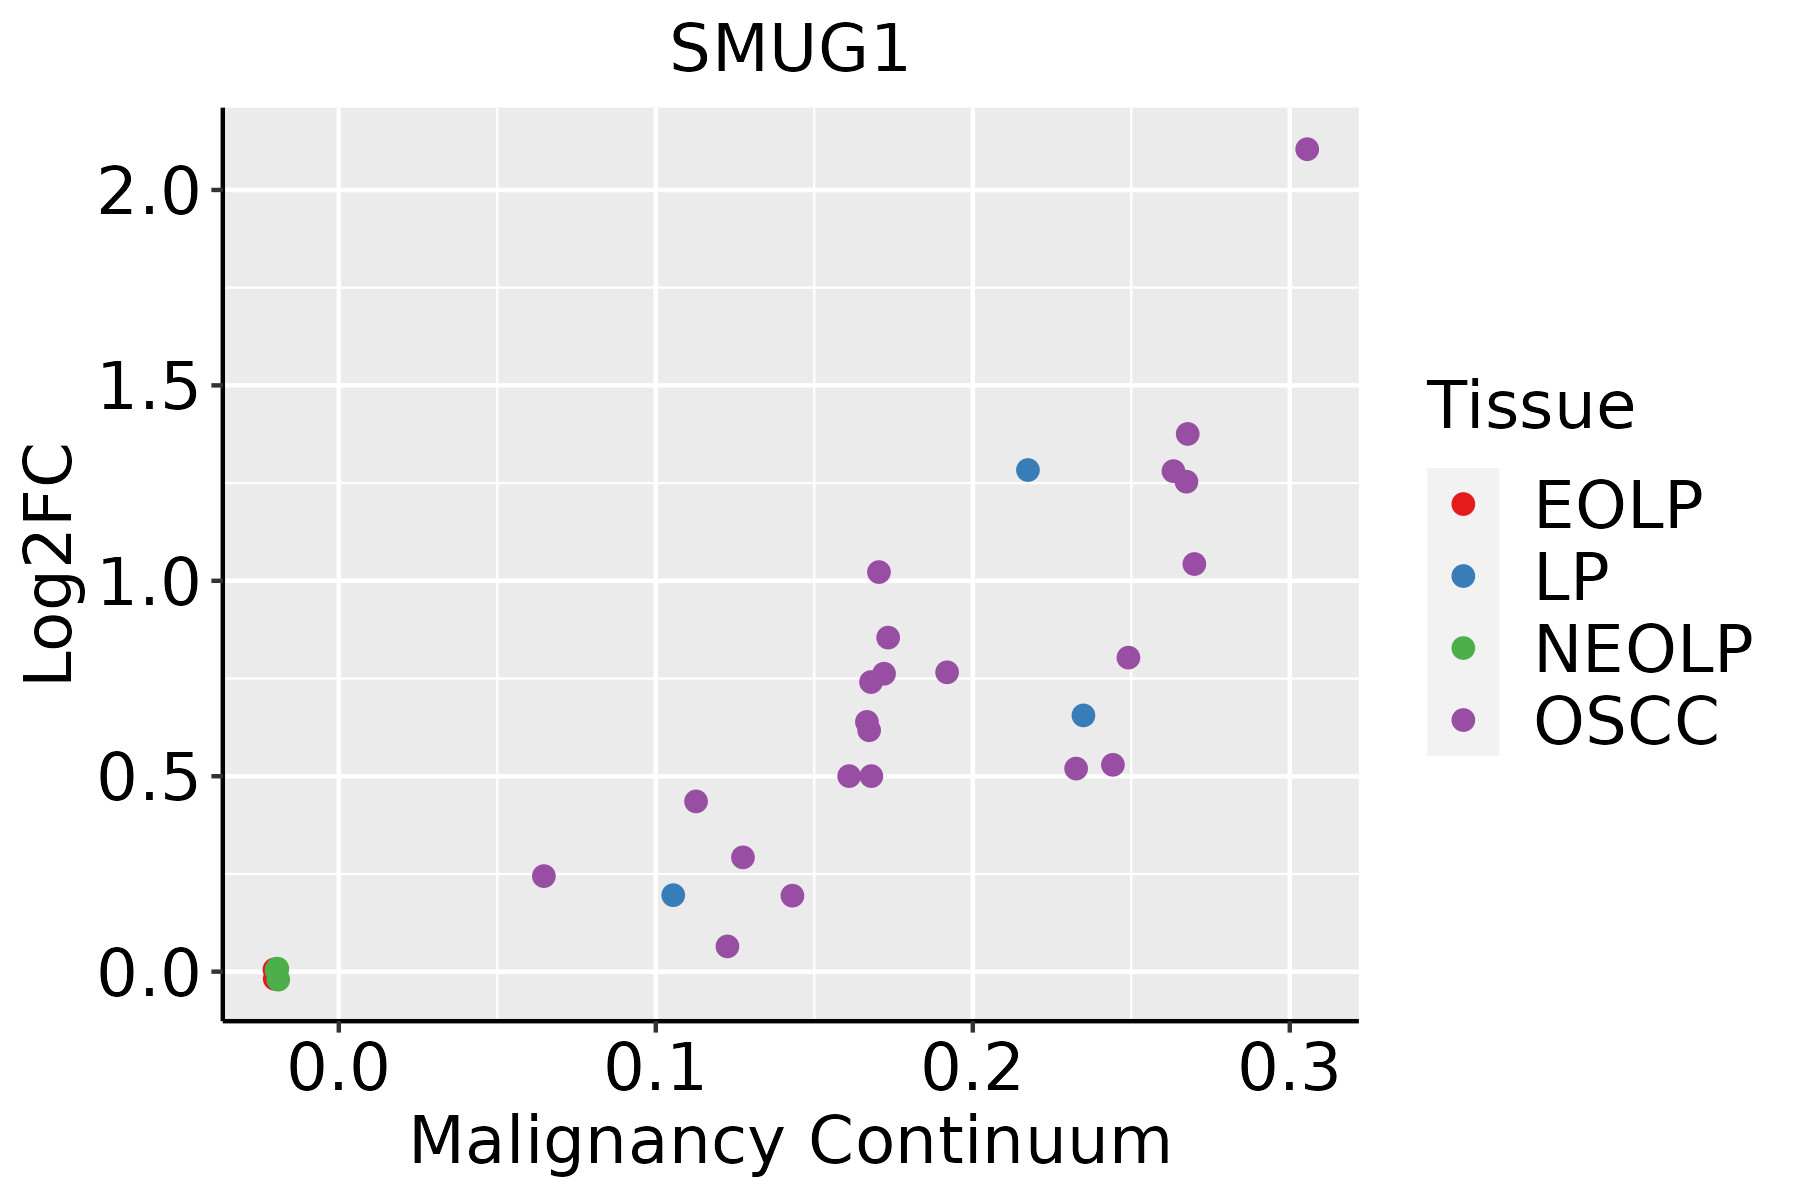 | EOLP: Erosive Oral lichen planus |
| LP: leukoplakia | ||
| NEOLP: Non-erosive oral lichen planus | ||
| OSCC: Oral squamous cell carcinoma | ||
| Skin | 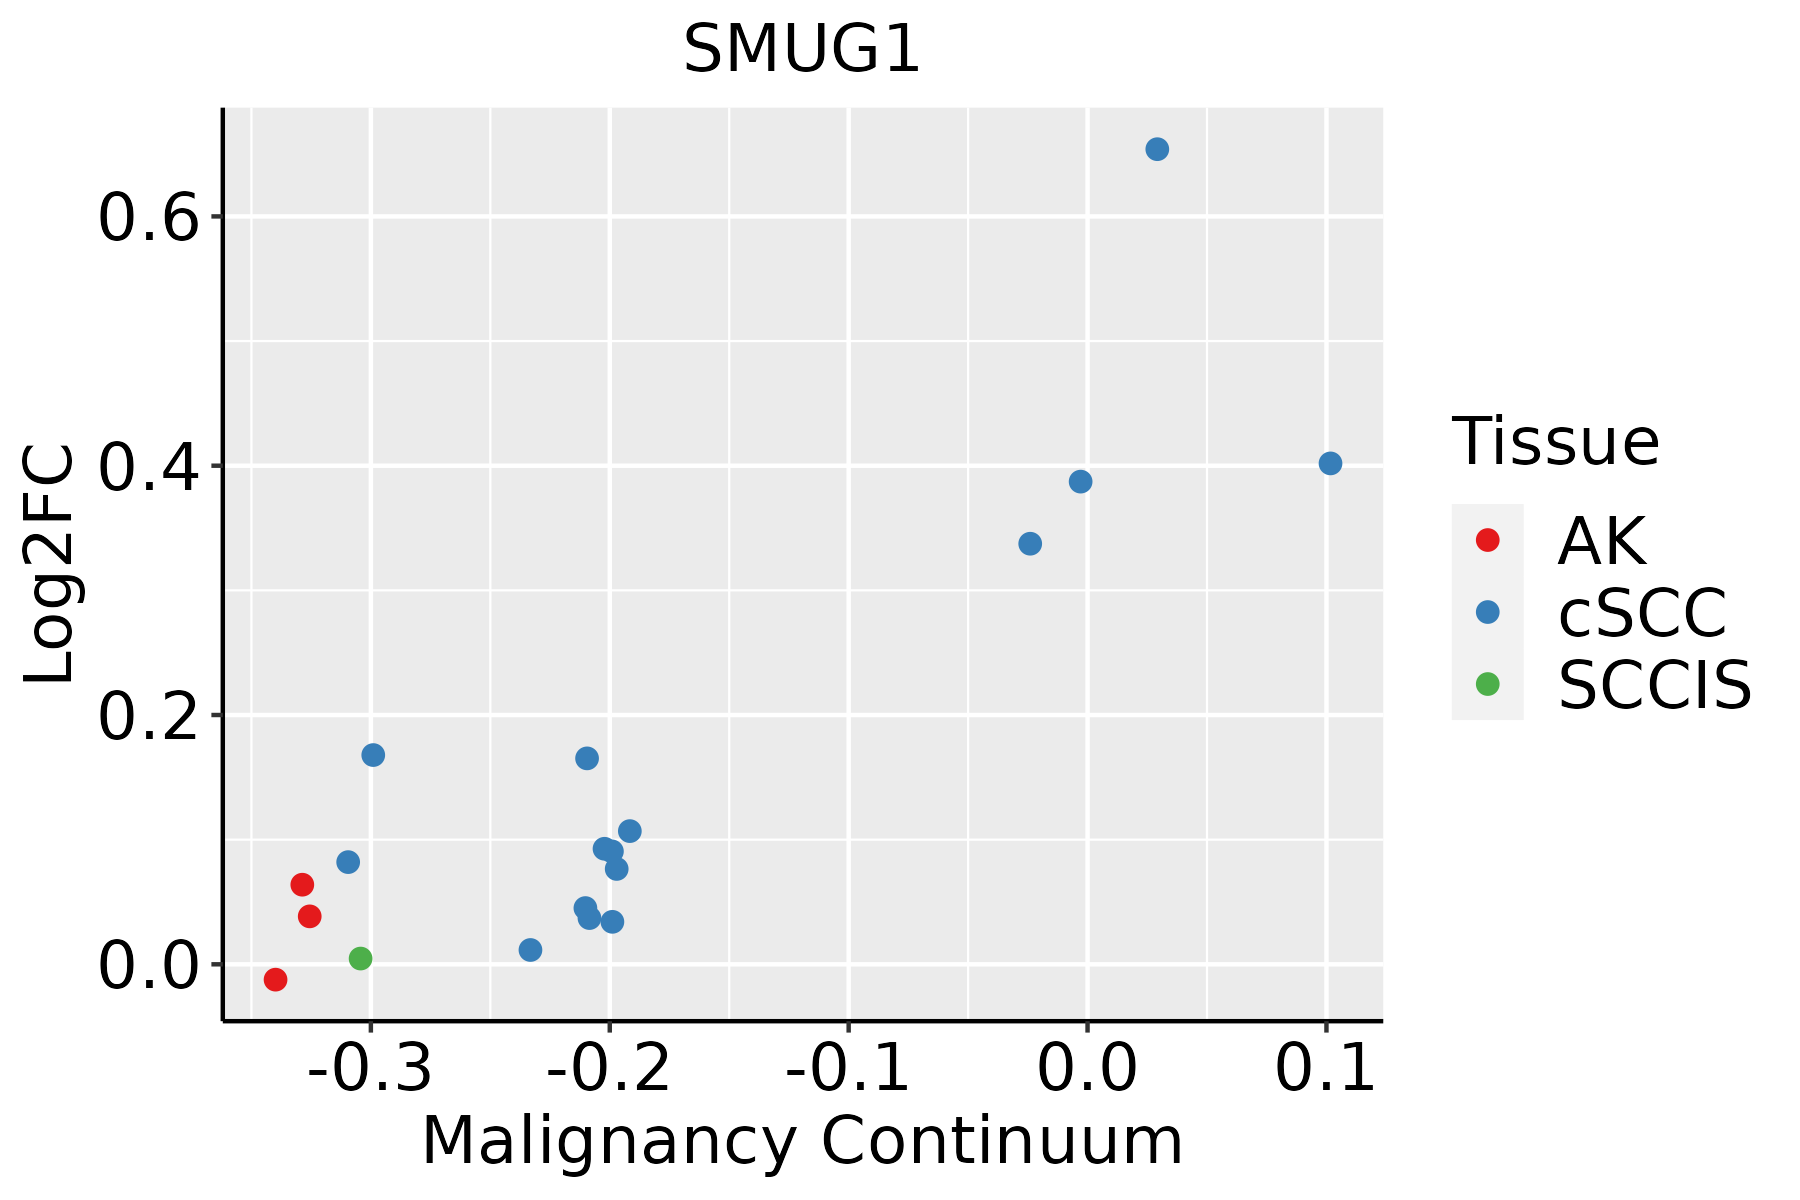 | AK: Actinic keratosis |
| cSCC: Cutaneous squamous cell carcinoma | ||
| SCCIS:squamous cell carcinoma in situ |
| ∗log2FC in expression of this searched gene in stem-like cells from each diseased tissue sample relative to stem-like cells in normal samples in each tissue plotted against the malignancy continuum. Samples are colored based on if they are from different disease stage. |
Top |
Malignant transformation related pathway analysis |
| Find out the enriched GO biological processes and KEGG pathways involved in transition from healthy to precancer to cancer |
| Tissue | Disease Stage | Enriched GO biological Processes |
| Colorectum | AD |  |
| Colorectum | SER |  |
| Colorectum | MSS |  |
| Colorectum | MSI-H |  |
| Colorectum | FAP |  |
| ∗Top 15 enriched GO BP terms are showed in the bar plot of each disease state in each tissue. Each row represents a significant GO biological process which is colored according to the -log10(p.adjust). |
| Page: 1 2 3 4 5 6 7 8 9 |
| GO ID | Tissue | Disease Stage | Description | Gene Ratio | Bg Ratio | pvalue | p.adjust | Count |
| GO:003465519 | Esophagus | HGIN | nucleobase-containing compound catabolic process | 98/2587 | 407/18723 | 1.44e-08 | 8.94e-07 | 98 |
| GO:004670017 | Esophagus | HGIN | heterocycle catabolic process | 103/2587 | 445/18723 | 5.44e-08 | 2.99e-06 | 103 |
| GO:004427018 | Esophagus | HGIN | cellular nitrogen compound catabolic process | 103/2587 | 451/18723 | 1.10e-07 | 5.56e-06 | 103 |
| GO:001943917 | Esophagus | HGIN | aromatic compound catabolic process | 105/2587 | 467/18723 | 1.89e-07 | 9.31e-06 | 105 |
| GO:190136117 | Esophagus | HGIN | organic cyclic compound catabolic process | 106/2587 | 495/18723 | 1.94e-06 | 7.13e-05 | 106 |
| GO:00196924 | Esophagus | HGIN | deoxyribose phosphate metabolic process | 16/2587 | 42/18723 | 7.90e-05 | 1.76e-03 | 16 |
| GO:00092624 | Esophagus | HGIN | deoxyribonucleotide metabolic process | 16/2587 | 44/18723 | 1.51e-04 | 2.97e-03 | 16 |
| GO:00093944 | Esophagus | HGIN | 2'-deoxyribonucleotide metabolic process | 15/2587 | 40/18723 | 1.62e-04 | 3.16e-03 | 15 |
| GO:00092643 | Esophagus | HGIN | deoxyribonucleotide catabolic process | 12/2587 | 30/18723 | 3.62e-04 | 5.68e-03 | 12 |
| GO:00463863 | Esophagus | HGIN | deoxyribose phosphate catabolic process | 12/2587 | 31/18723 | 5.17e-04 | 7.46e-03 | 12 |
| GO:000911720 | Esophagus | HGIN | nucleotide metabolic process | 92/2587 | 489/18723 | 1.11e-03 | 1.36e-02 | 92 |
| GO:000675320 | Esophagus | HGIN | nucleoside phosphate metabolic process | 93/2587 | 497/18723 | 1.25e-03 | 1.49e-02 | 93 |
| GO:00092233 | Esophagus | HGIN | pyrimidine deoxyribonucleotide catabolic process | 8/2587 | 19/18723 | 2.40e-03 | 2.41e-02 | 8 |
| GO:0006285 | Esophagus | HGIN | base-excision repair, AP site formation | 6/2587 | 12/18723 | 3.03e-03 | 2.88e-02 | 6 |
| GO:00092193 | Esophagus | HGIN | pyrimidine deoxyribonucleotide metabolic process | 9/2587 | 24/18723 | 3.33e-03 | 3.12e-02 | 9 |
| GO:00062442 | Esophagus | HGIN | pyrimidine nucleotide catabolic process | 8/2587 | 21/18723 | 5.00e-03 | 4.19e-02 | 8 |
| GO:0034655110 | Esophagus | ESCC | nucleobase-containing compound catabolic process | 272/8552 | 407/18723 | 2.92e-18 | 2.90e-16 | 272 |
| GO:004670018 | Esophagus | ESCC | heterocycle catabolic process | 286/8552 | 445/18723 | 1.12e-15 | 7.47e-14 | 286 |
| GO:004427019 | Esophagus | ESCC | cellular nitrogen compound catabolic process | 288/8552 | 451/18723 | 3.03e-15 | 1.79e-13 | 288 |
| GO:001943918 | Esophagus | ESCC | aromatic compound catabolic process | 295/8552 | 467/18723 | 1.09e-14 | 5.98e-13 | 295 |
| Page: 1 2 3 4 5 6 |
| Pathway ID | Tissue | Disease Stage | Description | Gene Ratio | Bg Ratio | pvalue | p.adjust | qvalue | Count |
| hsa034104 | Esophagus | ESCC | Base excision repair | 38/4205 | 44/8465 | 3.59e-07 | 2.62e-06 | 1.34e-06 | 38 |
| hsa0341011 | Esophagus | ESCC | Base excision repair | 38/4205 | 44/8465 | 3.59e-07 | 2.62e-06 | 1.34e-06 | 38 |
| hsa03410 | Oral cavity | OSCC | Base excision repair | 32/3704 | 44/8465 | 9.11e-05 | 3.25e-04 | 1.65e-04 | 32 |
| hsa034101 | Oral cavity | OSCC | Base excision repair | 32/3704 | 44/8465 | 9.11e-05 | 3.25e-04 | 1.65e-04 | 32 |
| hsa034102 | Oral cavity | LP | Base excision repair | 23/2418 | 44/8465 | 7.66e-04 | 3.75e-03 | 2.42e-03 | 23 |
| hsa034103 | Oral cavity | LP | Base excision repair | 23/2418 | 44/8465 | 7.66e-04 | 3.75e-03 | 2.42e-03 | 23 |
| Page: 1 |
Top |
Cell-cell communication analysis |
| Identification of potential cell-cell interactions between two cell types and their ligand-receptor pairs for different disease states |
| Ligand | Receptor | LRpair | Pathway | Tissue | Disease Stage |
| Page: 1 |
Top |
Single-cell gene regulatory network inference analysis |
| Find out the significant the regulons (TFs) and the target genes of each regulon across cell types for different disease states |
| TF | Cell Type | Tissue | Disease Stage | Target Gene | RSS | Regulon Activity |
| ∗The dot plots of a searched regulon are shown for all cell subpopulations in each disease state of each tissue based on the regulon specific score inferred using pySCENIC and by calculating the average expression. |
| Page: 1 |
Top |
Somatic mutation of malignant transformation related genes |
| Annotation of somatic variants for genes involved in malignant transformation |
| Hugo Symbol | Variant Class | Variant Classification | dbSNP RS | HGVSc | HGVSp | HGVSp Short | SWISSPROT | BIOTYPE | SIFT | PolyPhen | Tumor Sample Barcode | Tissue | Histology | Sex | Age | Stage | Therapy Types | Drugs | Outcome |
| SMUG1 | SNV | Missense_Mutation | novel | c.589N>A | p.Ala197Thr | p.A197T | Q53HV7 | protein_coding | tolerated(0.08) | possibly_damaging(0.746) | TCGA-A2-A0CR-01 | Breast | breast invasive carcinoma | Female | <65 | I/II | Chemotherapy | adriamycin | CR |
| SMUG1 | SNV | Missense_Mutation | novel | c.680N>T | p.Gly227Val | p.G227V | Q53HV7 | protein_coding | tolerated(0.09) | benign(0.013) | TCGA-AR-A1AY-01 | Breast | breast invasive carcinoma | Female | >=65 | I/II | Unspecific | Doxorubicin | SD |
| SMUG1 | insertion | Frame_Shift_Ins | novel | c.403_404insGGAGCAGAGCAGGTCTTGAGACCACCTTAATGAGGAACACATGGTCT | p.Glu135GlyfsTer18 | p.E135Gfs*18 | Q53HV7 | protein_coding | TCGA-A8-A06X-01 | Breast | breast invasive carcinoma | Female | >=65 | I/II | Unknown | Unknown | SD | ||
| SMUG1 | deletion | Frame_Shift_Del | novel | c.765delN | p.Lys256ArgfsTer4 | p.K256Rfs*4 | Q53HV7 | protein_coding | TCGA-D8-A27V-01 | Breast | breast invasive carcinoma | Female | <65 | I/II | Hormone Therapy | tamoxiphen | SD | ||
| SMUG1 | SNV | Missense_Mutation | c.85G>C | p.Glu29Gln | p.E29Q | Q53HV7 | protein_coding | tolerated(0.19) | benign(0.003) | TCGA-JX-A3Q0-01 | Cervix | cervical & endocervical cancer | Female | <65 | III/IV | Unknown | Unknown | SD | |
| SMUG1 | SNV | Missense_Mutation | rs547497060 | c.197N>A | p.Arg66His | p.R66H | Q53HV7 | protein_coding | tolerated(0.24) | benign(0) | TCGA-AA-3977-01 | Colorectum | colon adenocarcinoma | Male | >=65 | I/II | Unknown | Unknown | SD |
| SMUG1 | SNV | Missense_Mutation | rs371582477 | c.196N>T | p.Arg66Cys | p.R66C | Q53HV7 | protein_coding | tolerated(0.09) | benign(0.001) | TCGA-AA-A01Z-01 | Colorectum | colon adenocarcinoma | Male | >=65 | I/II | Unknown | Unknown | PD |
| SMUG1 | SNV | Missense_Mutation | c.434T>C | p.Phe145Ser | p.F145S | Q53HV7 | protein_coding | tolerated(0.07) | probably_damaging(0.983) | TCGA-AA-A02R-01 | Colorectum | colon adenocarcinoma | Female | >=65 | I/II | Unknown | Unknown | PD | |
| SMUG1 | SNV | Missense_Mutation | rs541683930 | c.524G>A | p.Arg175His | p.R175H | Q53HV7 | protein_coding | tolerated(0.11) | probably_damaging(0.928) | TCGA-AZ-4313-01 | Colorectum | colon adenocarcinoma | Female | <65 | I/II | Unknown | Unknown | SD |
| SMUG1 | SNV | Missense_Mutation | c.149N>A | p.Pro50His | p.P50H | Q53HV7 | protein_coding | deleterious(0.01) | possibly_damaging(0.738) | TCGA-QG-A5Z2-01 | Colorectum | colon adenocarcinoma | Male | <65 | I/II | Unknown | Unknown | SD |
| Page: 1 2 3 4 |
Top |
Related drugs of malignant transformation related genes |
| Identification of chemicals and drugs interact with genes involved in malignant transfromation |
| (DGIdb 4.0) |
| Entrez ID | Symbol | Category | Interaction Types | Drug Claim Name | Drug Name | PMIDs |
| Page: 1 |

Copyright 2023-Present -The University of Texas Health Science Center at Houston |