Schematic overview of the cellular and molecular mechanisms involved in the cancer progression, including the proposed cellular and molecular mechanisms in cancer cells trajectory. AT1: alveolar type 1 cells; AT2: alveolar type 2 cells; AAH: atypical adenomatous hyperplasia; AIS: adenocarcinoma in situ; MIA: minimally invasive adenocarcinoma; IA: invasive adenocarcinoma; EMT: epithelial-mesenchymal transition

Home

Download

Statistics

Help

Contact

Center for Computational Systems Medicine
leaf

Gene summary

leaf

Malignant transformation analysis

leaf

Malignant transformation related pathway analysis

leaf

Cell-cell communication analysis

leaf

Single-cell gene regulatory network inference analysis

leaf

Somatic mutation of malignant transformation related genes

leaf

Related drugs of malignant transformation related genes

Gene: SHROOM3

Gene summary for SHROOM3

check button Gene summary.

Gene informationSpeciesHuman
Gene symbol

SHROOM3

Gene ID

57619

Gene nameshroom family member 3
Gene AliasAPXL3
Cytomap4q21.1
Gene Typeprotein-coding
GO ID

GO:0000902

UniProtAcc

B3KY47


Top

Malignant transformation analysis

check button Identification of the aberrant gene expression in precancerous and cancerous lesions by comparing the gene expression of stem-like cells in diseased tissues with normal stem cells
check button Malignant transformation involving gene list.
Entrez IDSymbolReplicatesSpeciesOrganTissueAdj P-valueLog2FCMalignancy
57619SHROOM3S015HumanLiverHCC7.81e-04-5.69e-010.2375
57619SHROOM3S016HumanLiverHCC9.53e-11-5.79e-010.2243
57619SHROOM3S028HumanLiverHCC9.02e-042.32e-010.2503
57619SHROOM3S029HumanLiverHCC2.77e-022.39e-010.2581
57619SHROOM3TD9HumanLungIAC7.97e-151.32e+000.088
57619SHROOM3RNA-P10T2-P10T2-1HumanLungAAH4.48e-049.43e-01-0.1271
57619SHROOM3RNA-P10T2-P10T2-2HumanLungAAH1.09e-061.06e+00-0.1406
57619SHROOM3RNA-P10T2-P10T2-3HumanLungAAH1.53e-061.11e+00-0.1408
57619SHROOM3RNA-P10T2-P10T2-4HumanLungAAH3.94e-038.94e-01-0.138
57619SHROOM3RNA-P17T-P17T-2HumanLungIAC2.05e-055.93e-010.3371
57619SHROOM3RNA-P17T-P17T-4HumanLungIAC6.13e-098.27e-010.343
57619SHROOM3RNA-P17T-P17T-6HumanLungIAC1.22e-088.50e-010.3385
57619SHROOM3RNA-P17T-P17T-8HumanLungIAC5.47e-119.22e-010.3329
57619SHROOM3RNA-P23T2-P23T2-1HumanLungMIAC4.33e-041.26e+00-0.037
57619SHROOM3RNA-P23T2-P23T2-2HumanLungMIAC3.85e-039.97e-01-0.028
57619SHROOM3RNA-P23T2-P23T2-4HumanLungMIAC7.72e-041.21e+00-0.0272
57619SHROOM3RNA-P24T2-P24T2-2HumanLungIAC2.94e-051.47e+000.0057
57619SHROOM3RNA-P25T1-P25T1-1HumanLungAIS3.07e-331.31e+00-0.2116
57619SHROOM3RNA-P25T1-P25T1-2HumanLungAIS1.92e-151.23e+00-0.1941
57619SHROOM3RNA-P25T1-P25T1-3HumanLungAIS1.29e-151.17e+00-0.2107
Page: 1 2 3 4 5 6 7 8 

check button Transcriptomic changes along malignancy continuum.
TissueExpression DynamicsAbbreviation
Colorectum (GSE201348)The image shows the transcriptomic changes along malignancy continuum.log2FC in expression of this searched gene in stem-like cells from each diseased tissue sample relative to stem-like cells in normal samples in each tissue plotted against the malignancy continuum. Samples are colored based on if they are from different disease stage.FAP: Familial adenomatous polyposis
CRC: Colorectal cancer
Colorectum (HTA11)The image shows the transcriptomic changes along malignancy continuum.log2FC in expression of this searched gene in stem-like cells from each diseased tissue sample relative to stem-like cells in normal samples in each tissue plotted against the malignancy continuum. Samples are colored based on if they are from different disease stage.AD: Adenomas
SER: Sessile serrated lesions
MSI-H: Microsatellite-high colorectal cancer
MSS: Microsatellite stable colorectal cancer
EndometriumThe image shows the transcriptomic changes along malignancy continuum.log2FC in expression of this searched gene in stem-like cells from each diseased tissue sample relative to stem-like cells in normal samples in each tissue plotted against the malignancy continuum. Samples are colored based on if they are from different disease stage.
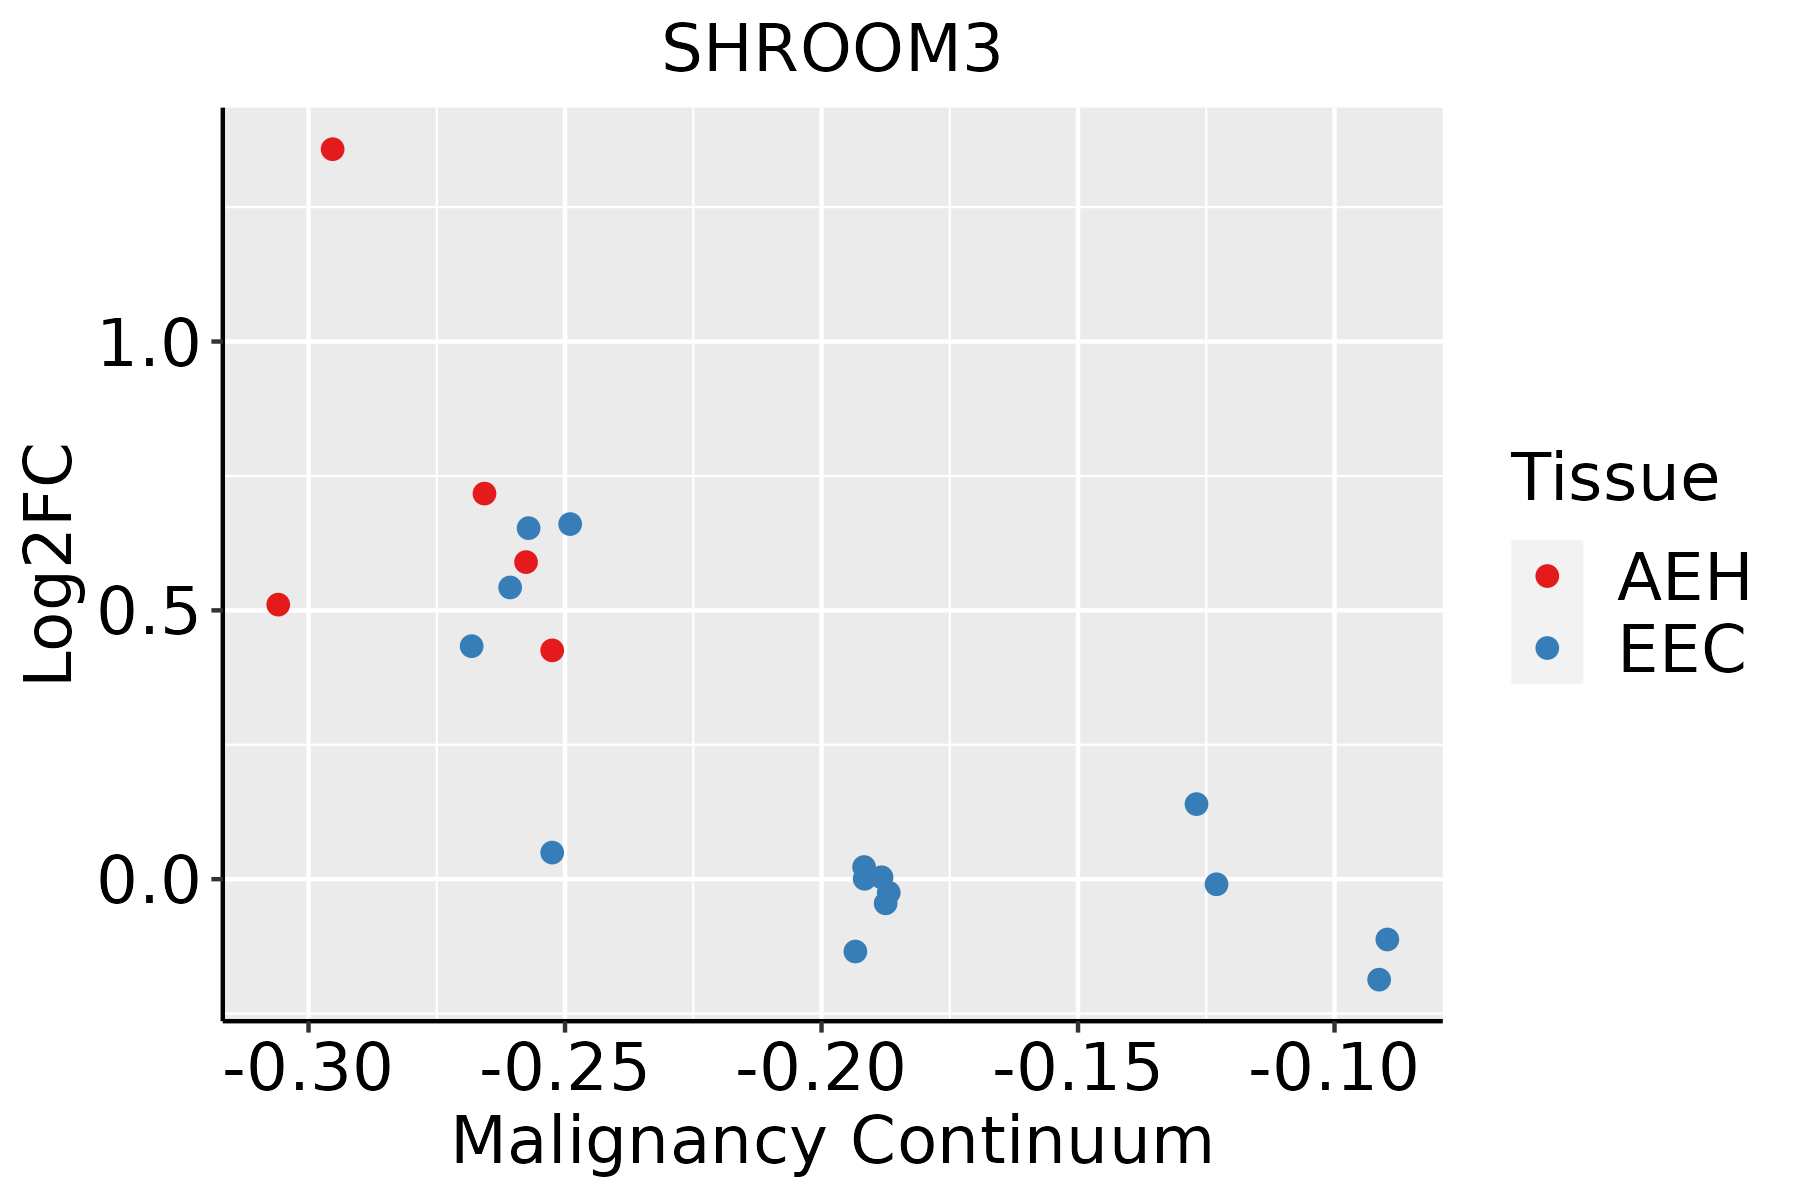
AEH: Atypical endometrial hyperplasia
EEC: Endometrioid Cancer
EsophagusThe image shows the transcriptomic changes along malignancy continuum.log2FC in expression of this searched gene in stem-like cells from each diseased tissue sample relative to stem-like cells in normal samples in each tissue plotted against the malignancy continuum. Samples are colored based on if they are from different disease stage.
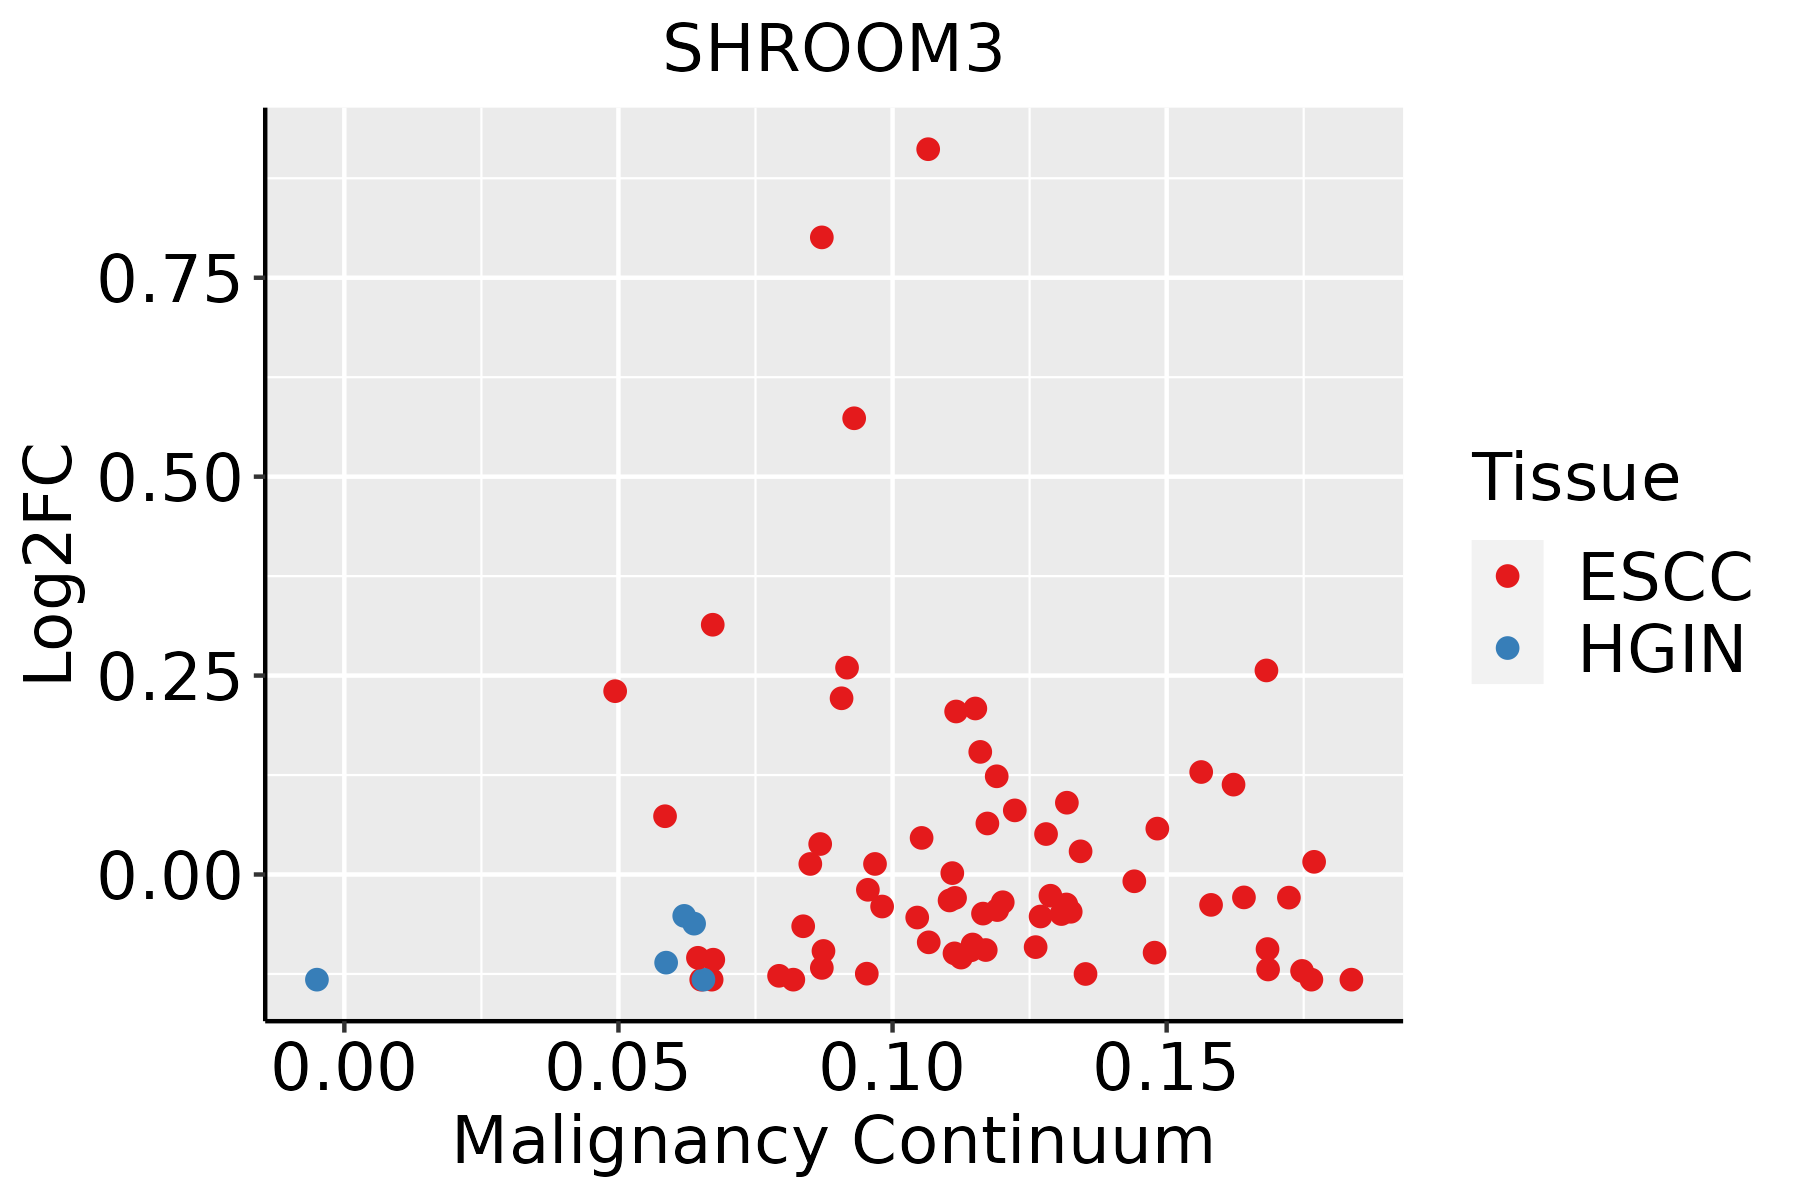
ESCC: Esophageal squamous cell carcinoma
HGIN: High-grade intraepithelial neoplasias
LGIN: Low-grade intraepithelial neoplasias
GCThe image shows the transcriptomic changes along malignancy continuum.log2FC in expression of this searched gene in stem-like cells from each diseased tissue sample relative to stem-like cells in normal samples in each tissue plotted against the malignancy continuum. Samples are colored based on if they are from different disease stage.CAG: Chronic atrophic gastritis
CAG with IM: Chronic atrophic gastritis with intestinal metaplasia
CSG: Chronic superficial gastritis
GC: Gastric cancer
SIM: Severe intestinal metaplasia
WIM: Wild intestinal metaplasia
LiverThe image shows the transcriptomic changes along malignancy continuum.log2FC in expression of this searched gene in stem-like cells from each diseased tissue sample relative to stem-like cells in normal samples in each tissue plotted against the malignancy continuum. Samples are colored based on if they are from different disease stage.HCC: Hepatocellular carcinoma
NAFLD: Non-alcoholic fatty liver disease
LungThe image shows the transcriptomic changes along malignancy continuum.log2FC in expression of this searched gene in stem-like cells from each diseased tissue sample relative to stem-like cells in normal samples in each tissue plotted against the malignancy continuum. Samples are colored based on if they are from different disease stage.
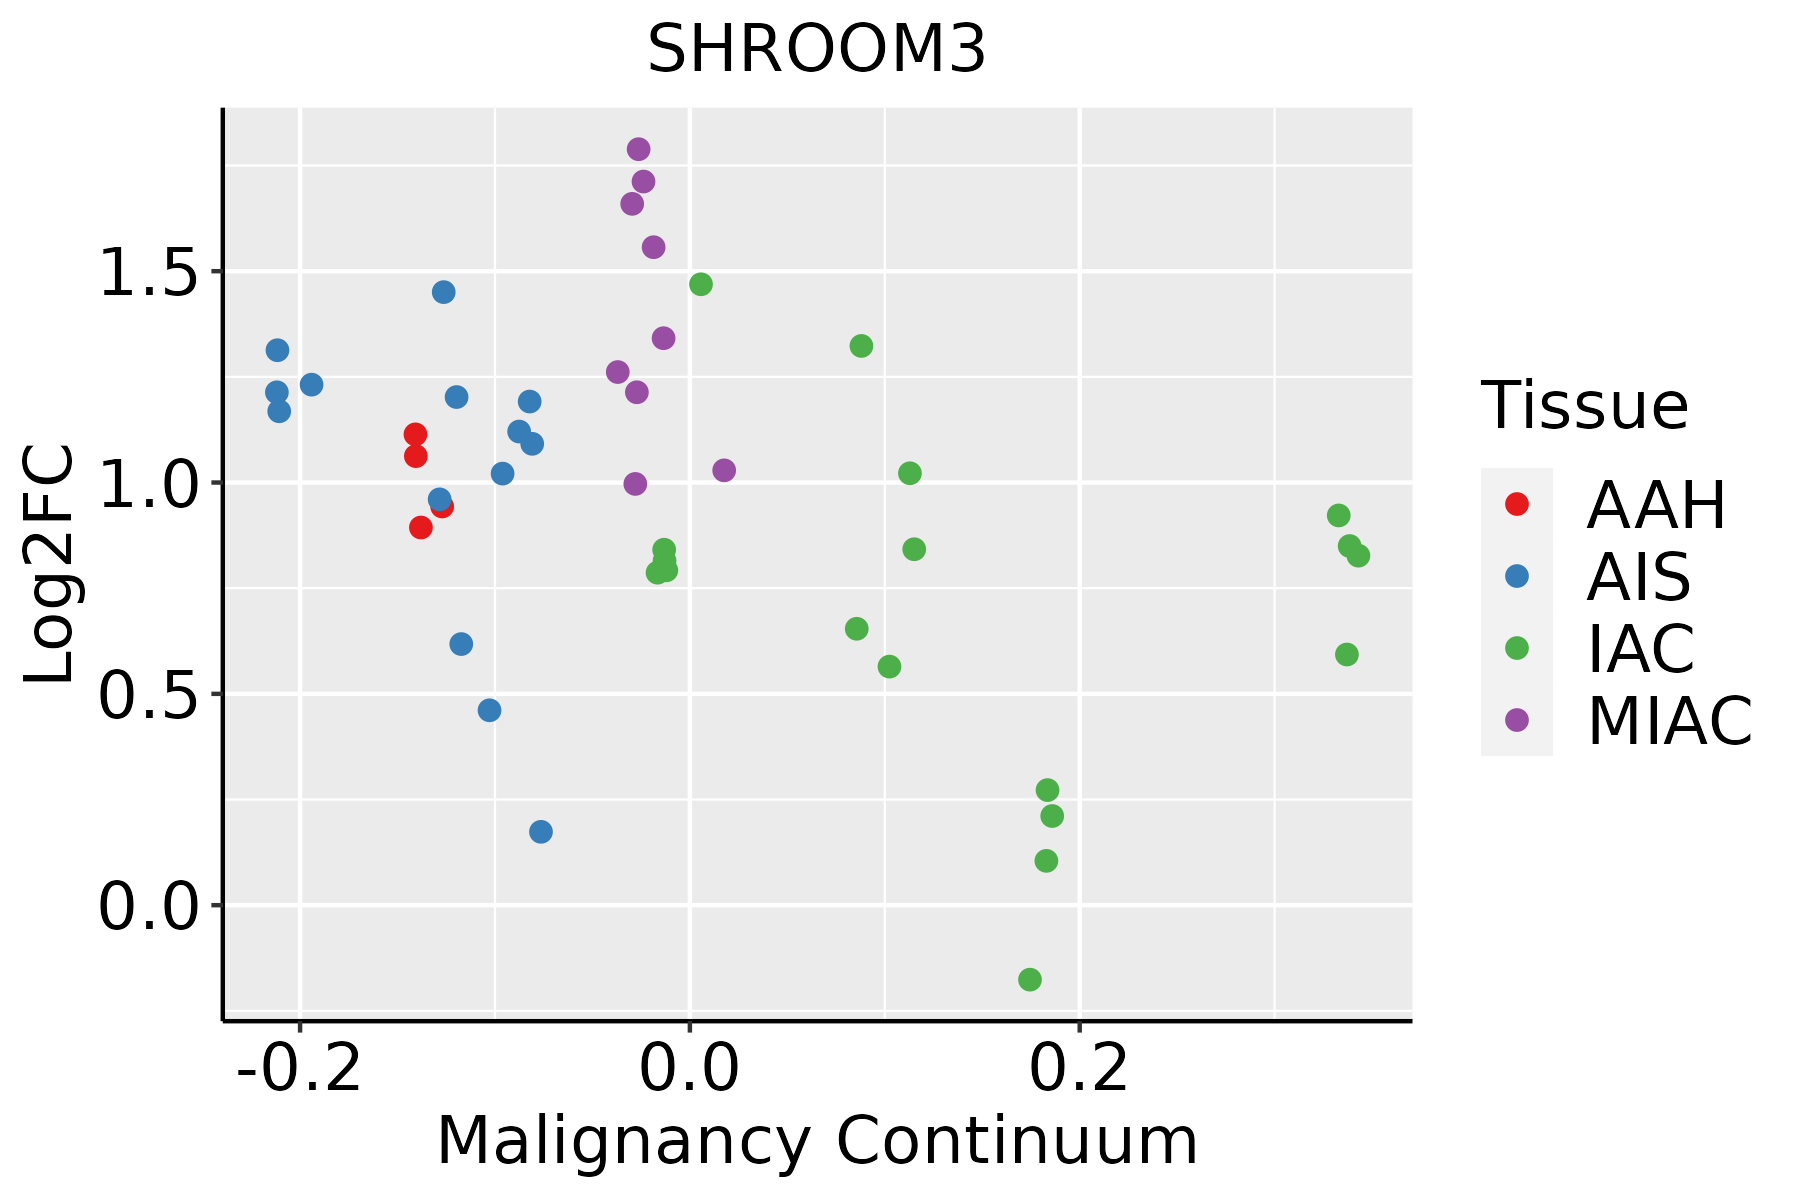
AAH: Atypical adenomatous hyperplasia
AIS: Adenocarcinoma in situ
IAC: Invasive lung adenocarcinoma
MIA: Minimally invasive adenocarcinoma
ProstateThe image shows the transcriptomic changes along malignancy continuum.log2FC in expression of this searched gene in stem-like cells from each diseased tissue sample relative to stem-like cells in normal samples in each tissue plotted against the malignancy continuum. Samples are colored based on if they are from different disease stage.
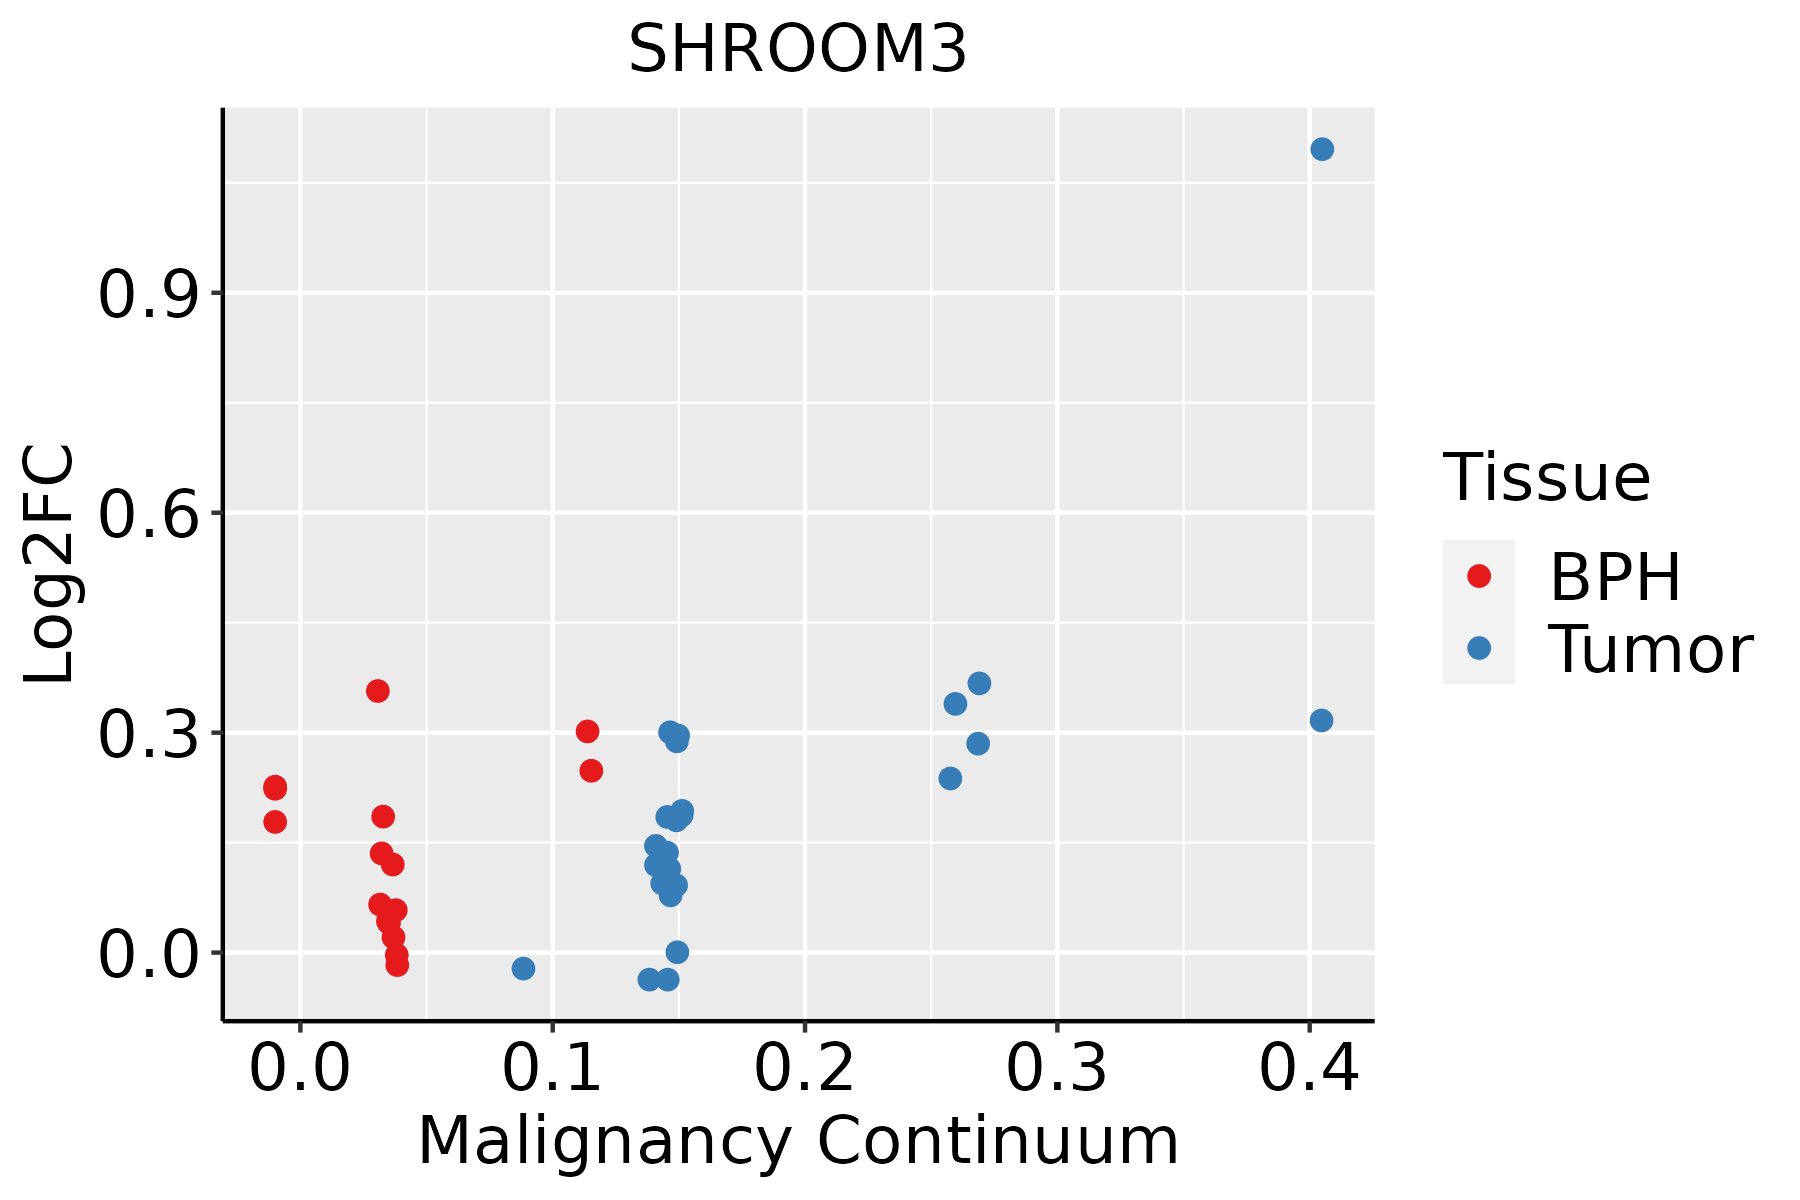
BPH: Benign Prostatic Hyperplasia
ThyroidThe image shows the transcriptomic changes along malignancy continuum.log2FC in expression of this searched gene in stem-like cells from each diseased tissue sample relative to stem-like cells in normal samples in each tissue plotted against the malignancy continuum. Samples are colored based on if they are from different disease stage.ATC: Anaplastic thyroid cancer
HT: Hashimoto's thyroiditis
PTC: Papillary thyroid cancer
∗log2FC in expression of this searched gene in stem-like cells from each diseased tissue sample relative to stem-like cells in normal samples in each tissue plotted against the malignancy continuum. Samples are colored based on if they are from different disease stage.

Top

Malignant transformation related pathway analysis

check buttonFind out the enriched GO biological processes and KEGG pathways involved in transition from healthy to precancer to cancer
check button Figure of enriched GO biological processes.
TissueDisease StageEnriched GO biological Processes
ColorectumADGO analysis - Figure of enriched GO biological processes: Top 15 enriched GO BP terms are showed in the bar plot of each disease state in each tissue. Each row represents a significant GO biological process which is colored according to the -log10(p.adjust).
ColorectumSERGO analysis - Figure of enriched GO biological processes: Top 15 enriched GO BP terms are showed in the bar plot of each disease state in each tissue. Each row represents a significant GO biological process which is colored according to the -log10(p.adjust).
ColorectumMSSGO analysis - Figure of enriched GO biological processes: Top 15 enriched GO BP terms are showed in the bar plot of each disease state in each tissue. Each row represents a significant GO biological process which is colored according to the -log10(p.adjust).
ColorectumMSI-HGO analysis - Figure of enriched GO biological processes: Top 15 enriched GO BP terms are showed in the bar plot of each disease state in each tissue. Each row represents a significant GO biological process which is colored according to the -log10(p.adjust).
ColorectumFAPGO analysis - Figure of enriched GO biological processes: Top 15 enriched GO BP terms are showed in the bar plot of each disease state in each tissue. Each row represents a significant GO biological process which is colored according to the -log10(p.adjust).
∗Top 15 enriched GO BP terms are showed in the bar plot of each disease state in each tissue. Each row represents a significant GO biological process which is colored according to the -log10(p.adjust).
Page: 1 2 3 4 5 6 7 8 9 

check button Enriched GO biological processes.
GO IDTissueDisease StageDescriptionGene RatioBg Ratiopvaluep.adjustCount
GO:0007015ColorectumADactin filament organization167/3918442/187231.65e-167.94e-14167
GO:0002064ColorectumADepithelial cell development89/3918220/187232.98e-113.52e-0989
GO:0022604ColorectumADregulation of cell morphogenesis109/3918309/187233.08e-092.07e-07109
GO:0008360ColorectumADregulation of cell shape56/3918154/187237.01e-061.73e-0456
GO:0060562ColorectumADepithelial tube morphogenesis93/3918325/187235.65e-046.00e-0393
GO:0014020ColorectumADprimary neural tube formation33/391894/187231.02e-039.50e-0333
GO:0001841ColorectumADneural tube formation35/3918102/187231.16e-031.05e-0235
GO:0001843ColorectumADneural tube closure30/391888/187232.83e-032.12e-0230
GO:0060606ColorectumADtube closure30/391889/187233.42e-032.49e-0230
GO:0035148ColorectumADtube formation45/3918148/187234.13e-032.87e-0245
GO:0001838ColorectumADembryonic epithelial tube formation38/3918121/187234.40e-033.01e-0238
GO:0072175ColorectumADepithelial tube formation40/3918132/187236.98e-034.29e-0240
GO:0021915ColorectumADneural tube development45/3918152/187237.05e-034.31e-0245
GO:00070151ColorectumSERactin filament organization134/2897442/187231.39e-155.70e-13134
GO:00226041ColorectumSERregulation of cell morphogenesis89/2897309/187231.51e-091.52e-0789
GO:00020641ColorectumSERepithelial cell development64/2897220/187231.96e-071.10e-0564
GO:00083601ColorectumSERregulation of cell shape43/2897154/187235.47e-051.30e-0343
GO:00018411ColorectumSERneural tube formation26/2897102/187235.87e-034.29e-0226
GO:00070152ColorectumMSSactin filament organization146/3467442/187231.16e-132.67e-11146
GO:00020642ColorectumMSSepithelial cell development81/3467220/187231.02e-101.06e-0881
Page: 1 2 3 4 5 6 7 8 9 10 11 

check button Enriched KEGG pathways.
Pathway IDTissueDisease StageDescriptionGene RatioBg Ratiopvaluep.adjustqvalueCount
Page: 1 

Top

Cell-cell communication analysis

check buttonIdentification of potential cell-cell interactions between two cell types and their ligand-receptor pairs for different disease states
LigandReceptorLRpairPathwayTissueDisease Stage
Page: 1 

Top

Single-cell gene regulatory network inference analysis

check buttonFind out the significant the regulons (TFs) and the target genes of each regulon across cell types for different disease states
TFCell TypeTissueDisease StageTarget GeneRSSRegulon Activity
∗The dot plots of a searched regulon are shown for all cell subpopulations in each disease state of each tissue based on the regulon specific score inferred using pySCENIC and by calculating the average expression.
Page: 1 

Top

Somatic mutation of malignant transformation related genes

check buttonAnnotation of somatic variants for genes involved in malignant transformation
Hugo SymbolVariant ClassVariant ClassificationdbSNP RSHGVScHGVSpHGVSp ShortSWISSPROTBIOTYPESIFTPolyPhenTumor Sample BarcodeTissueHistologySexAgeStageTherapy TypesDrugsOutcome
SHROOM3SNVMissense_Mutationnovelc.2479N>Cp.Glu827Glnp.E827QQ8TF72protein_codingdeleterious(0.05)possibly_damaging(0.462)TCGA-3C-AALI-01Breastbreast invasive carcinomaFemale<65I/IIUnspecificPoly EComplete Response
SHROOM3SNVMissense_Mutationnovelc.1815C>Gp.Cys605Trpp.C605WQ8TF72protein_codingtolerated(0.18)possibly_damaging(0.506)TCGA-A7-A0CJ-01Breastbreast invasive carcinomaFemale<65I/IIChemotherapycytoxanSD
SHROOM3SNVMissense_Mutationc.739N>Ap.Asp247Asnp.D247NQ8TF72protein_codingdeleterious(0)possibly_damaging(0.902)TCGA-AC-A23H-01Breastbreast invasive carcinomaFemale>=65I/IIUnknownUnknownPD
SHROOM3SNVMissense_Mutationc.16G>Ap.Glu6Lysp.E6KQ8TF72protein_codingdeleterious_low_confidence(0.01)benign(0.326)TCGA-BH-A0DZ-01Breastbreast invasive carcinomaFemale<65I/IIChemotherapydocetaxelSD
SHROOM3SNVMissense_Mutationc.223G>Ap.Glu75Lysp.E75KQ8TF72protein_codingdeleterious(0)probably_damaging(0.96)TCGA-E2-A152-01Breastbreast invasive carcinomaFemale<65I/IITargeted Molecular therapytrastuzumabPD
SHROOM3SNVMissense_Mutationrs752151821c.4702C>Tp.Arg1568Cysp.R1568CQ8TF72protein_codingtolerated(0.21)benign(0)TCGA-E2-A152-01Breastbreast invasive carcinomaFemale<65I/IITargeted Molecular therapytrastuzumabPD
SHROOM3SNVMissense_Mutationnovelc.2431N>Gp.Pro811Alap.P811AQ8TF72protein_codingtolerated(0.08)benign(0.051)TCGA-LL-A6FP-01Breastbreast invasive carcinomaFemale>=65I/IIHormone TherapyarimidexSD
SHROOM3insertionFrame_Shift_Insnovelc.1347_1348insAAACp.His450LysfsTer3p.H450Kfs*3Q8TF72protein_codingTCGA-A7-A0CG-01Breastbreast invasive carcinomaFemale>=65I/IIUnknownUnknownSD
SHROOM3insertionNonsense_Mutationnovelc.1349_1350insATCTCAGTCCTGAATTTATGGATCp.His450delinsGlnSerGlnSerTerIleTyrGlySerp.H450delinsQSQS*IYGSQ8TF72protein_codingTCGA-A7-A0CG-01Breastbreast invasive carcinomaFemale>=65I/IIUnknownUnknownSD
SHROOM3insertionFrame_Shift_Insnovelc.4596_4597insAp.Pro1533ThrfsTer10p.P1533Tfs*10Q8TF72protein_codingTCGA-A8-A07F-01Breastbreast invasive carcinomaFemale>=65I/IIHormone TherapytamoxiphenSD
Page: 1 2 3 4 5 6 7 8 9 10 11 12 13 14 15 16 17 

Top

Related drugs of malignant transformation related genes

check buttonIdentification of chemicals and drugs interact with genes involved in malignant transfromation
(DGIdb 4.0)
Entrez IDSymbolCategoryInteraction TypesDrug Claim NameDrug NamePMIDs
Page: 1