
|
|||||
|
 | |
| |
| |
| |
| |
| |
|
Gene: SH3D19 |
Gene summary for SH3D19 |
| Gene information | Species | Human | Gene symbol | SH3D19 | Gene ID | 152503 |
| Gene name | SH3 domain containing 19 | |
| Gene Alias | EBP | |
| Cytomap | 4q31.3 | |
| Gene Type | protein-coding | GO ID | GO:0000902 | UniProtAcc | Q5HYK7 |
Top |
Malignant transformation analysis |
| Identification of the aberrant gene expression in precancerous and cancerous lesions by comparing the gene expression of stem-like cells in diseased tissues with normal stem cells |
| Entrez ID | Symbol | Replicates | Species | Organ | Tissue | Adj P-value | Log2FC | Malignancy |
| 152503 | SH3D19 | 048752_1579-all-cells | Human | Prostate | BPH | 2.56e-69 | 1.18e+00 | 0.1008 |
| 152503 | SH3D19 | 052095_1628-all-cells | Human | Prostate | BPH | 3.40e-34 | 7.81e-01 | 0.1032 |
| 152503 | SH3D19 | 052097_1595-all-cells | Human | Prostate | BPH | 3.44e-68 | 1.19e+00 | 0.0972 |
| 152503 | SH3D19 | 052099_1652-all-cells | Human | Prostate | BPH | 1.04e-55 | 1.07e+00 | 0.1038 |
| 152503 | SH3D19 | Dong_P1 | Human | Prostate | Tumor | 2.97e-04 | -2.56e-02 | 0.035 |
| 152503 | SH3D19 | Dong_P3 | Human | Prostate | Tumor | 3.29e-06 | 9.37e-02 | 0.0278 |
| 152503 | SH3D19 | Dong_P5 | Human | Prostate | Tumor | 2.69e-14 | -2.60e-02 | 0.053 |
| 152503 | SH3D19 | Pat01-B | Human | Stomach | GC | 5.08e-31 | 6.53e-01 | 0.5754 |
| 152503 | SH3D19 | Pat02-B | Human | Stomach | GC | 3.92e-31 | 3.90e-01 | 0.0368 |
| 152503 | SH3D19 | Pat03-B | Human | Stomach | GC | 3.20e-24 | 4.15e-01 | 0.3693 |
| 152503 | SH3D19 | Pat04-B | Human | Stomach | GC | 2.10e-18 | 3.74e-01 | -0.1483 |
| 152503 | SH3D19 | Pat05-B | Human | Stomach | GC | 1.71e-08 | 3.25e-01 | -0.0353 |
| 152503 | SH3D19 | Pat06-B | Human | Stomach | GC | 2.21e-22 | 2.82e-01 | -0.1961 |
| 152503 | SH3D19 | Pat07-B | Human | Stomach | GC | 3.48e-08 | 5.01e-01 | 0.0935 |
| 152503 | SH3D19 | Pat09-B | Human | Stomach | GC | 2.01e-02 | 9.09e-02 | -0.0359 |
| 152503 | SH3D19 | Pat10-B | Human | Stomach | GC | 9.76e-04 | 4.34e-01 | 0.084 |
| 152503 | SH3D19 | Pat11-B | Human | Stomach | GC | 7.22e-05 | 1.52e-01 | -0.182 |
| 152503 | SH3D19 | Pat12-B | Human | Stomach | GC | 3.67e-20 | 3.49e-01 | 0.0325 |
| 152503 | SH3D19 | Pat13-B | Human | Stomach | GC | 2.23e-09 | 3.45e-01 | 0.0555 |
| 152503 | SH3D19 | Pat15-B | Human | Stomach | GC | 1.45e-04 | 2.32e-01 | -0.0778 |
| Page: 1 2 3 4 5 6 |
| Tissue | Expression Dynamics | Abbreviation |
| Cervix | 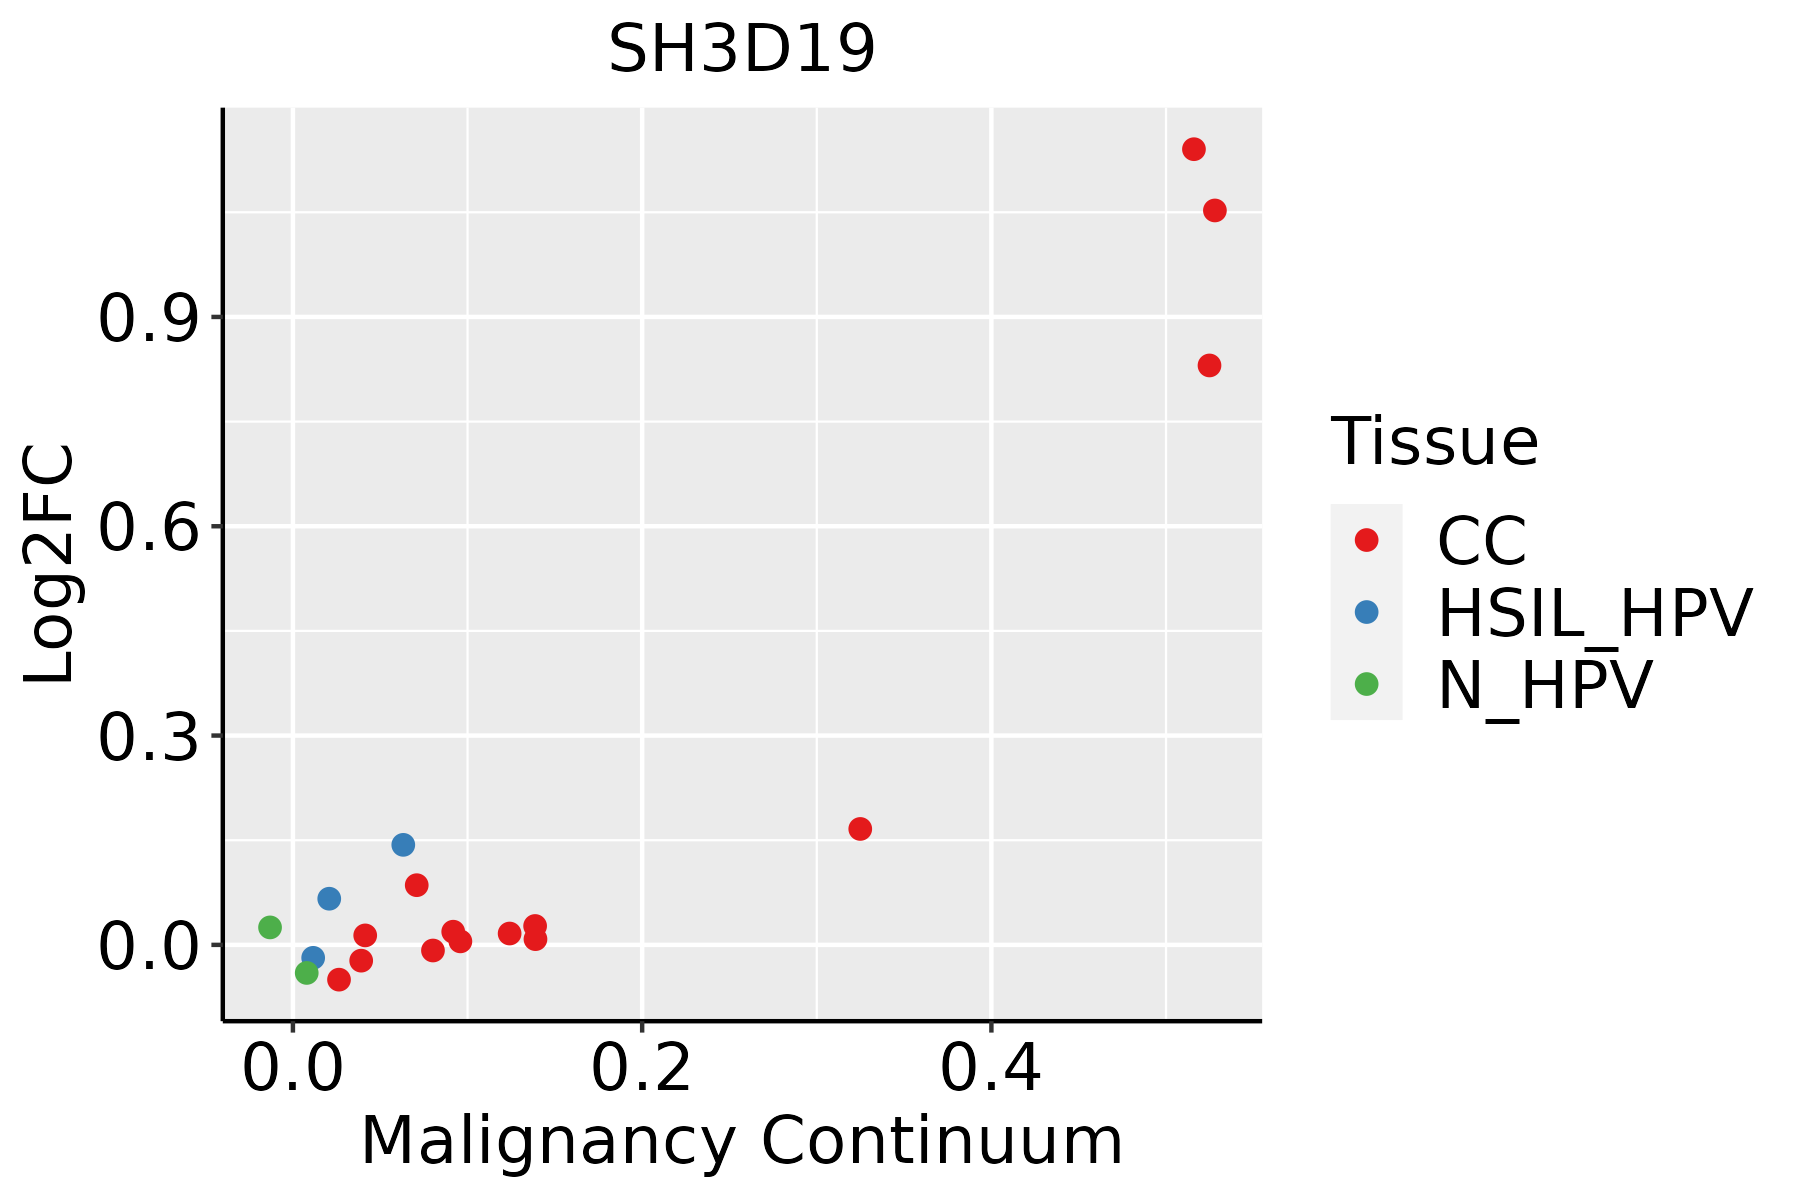 | CC: Cervix cancer |
| HSIL_HPV: HPV-infected high-grade squamous intraepithelial lesions | ||
| N_HPV: HPV-infected normal cervix | ||
| Colorectum (GSE201348) |  | FAP: Familial adenomatous polyposis |
| CRC: Colorectal cancer | ||
| Colorectum (HTA11) |  | AD: Adenomas |
| SER: Sessile serrated lesions | ||
| MSI-H: Microsatellite-high colorectal cancer | ||
| MSS: Microsatellite stable colorectal cancer | ||
| GC | 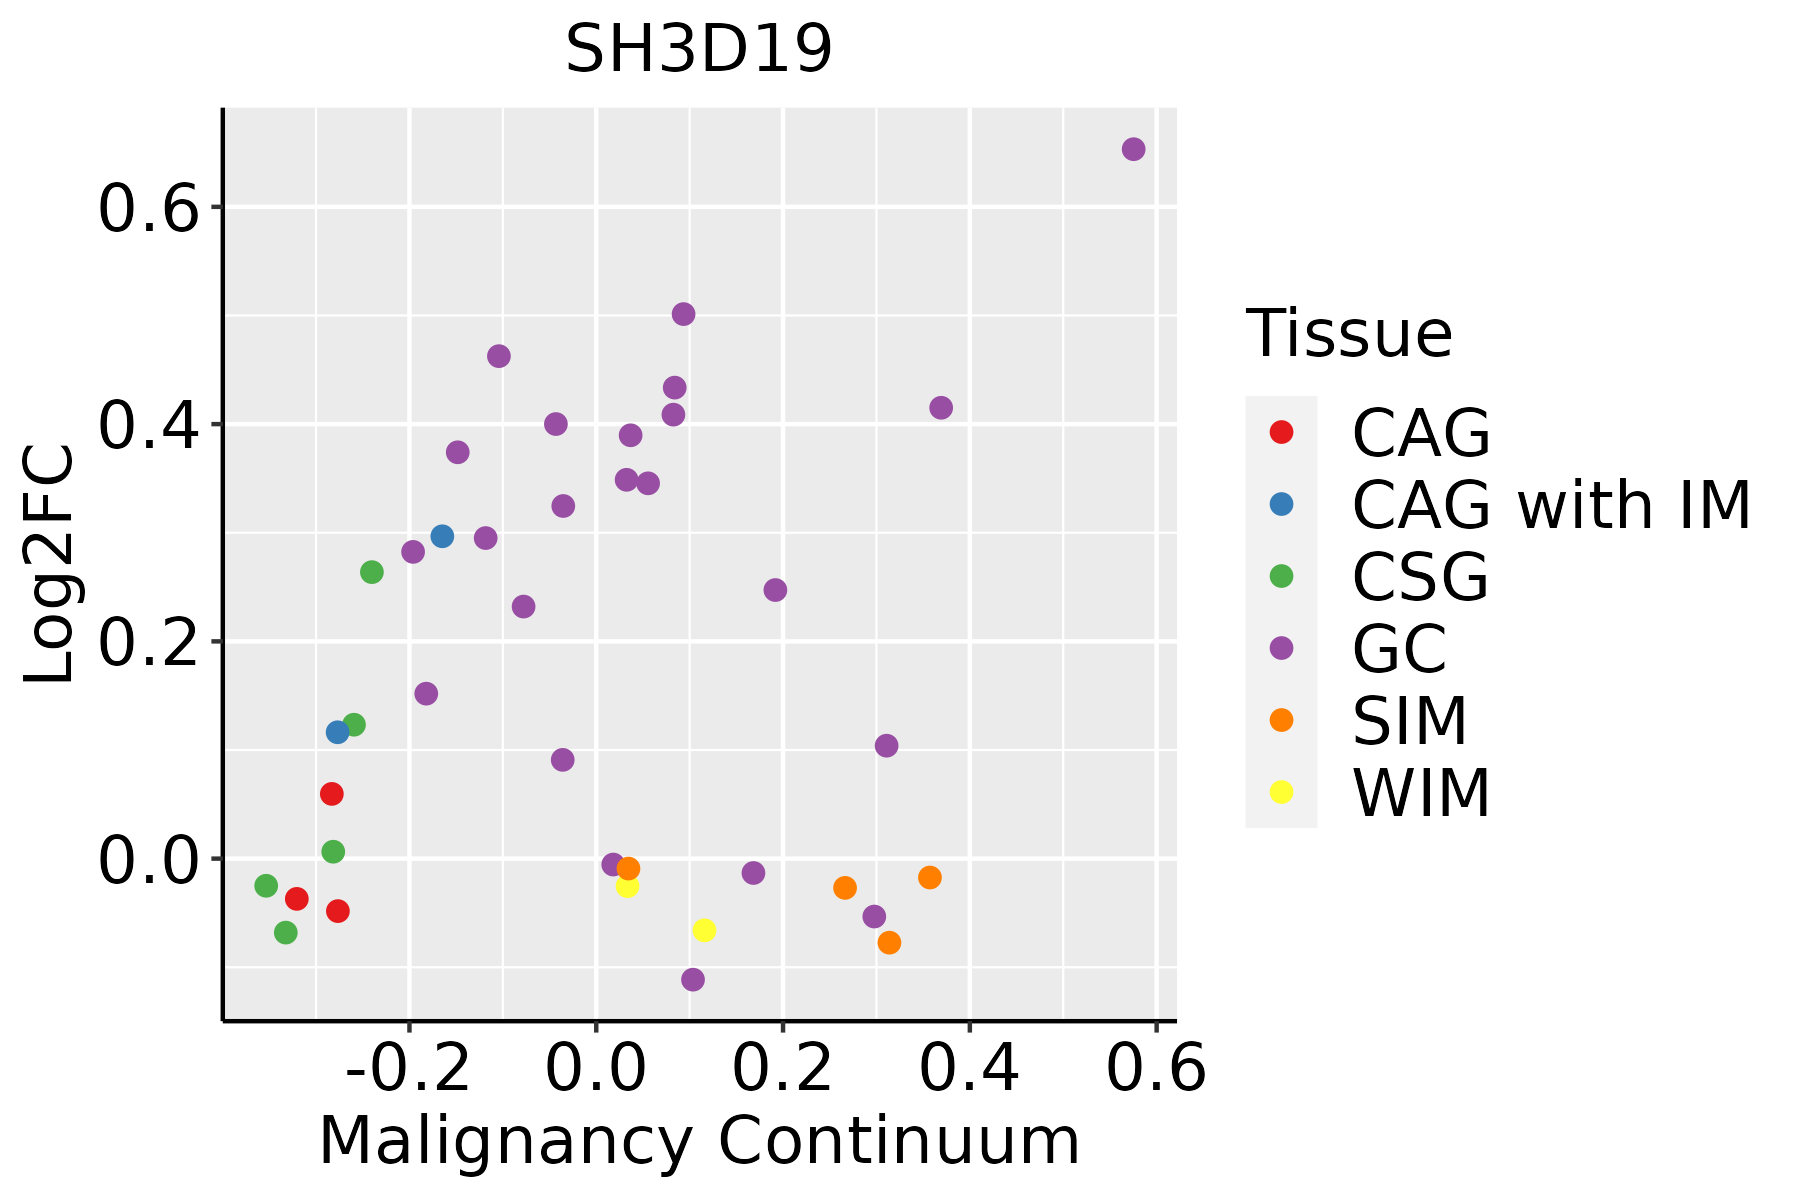 | CAG: Chronic atrophic gastritis |
| CAG with IM: Chronic atrophic gastritis with intestinal metaplasia | ||
| CSG: Chronic superficial gastritis | ||
| GC: Gastric cancer | ||
| SIM: Severe intestinal metaplasia | ||
| WIM: Wild intestinal metaplasia | ||
| Liver | 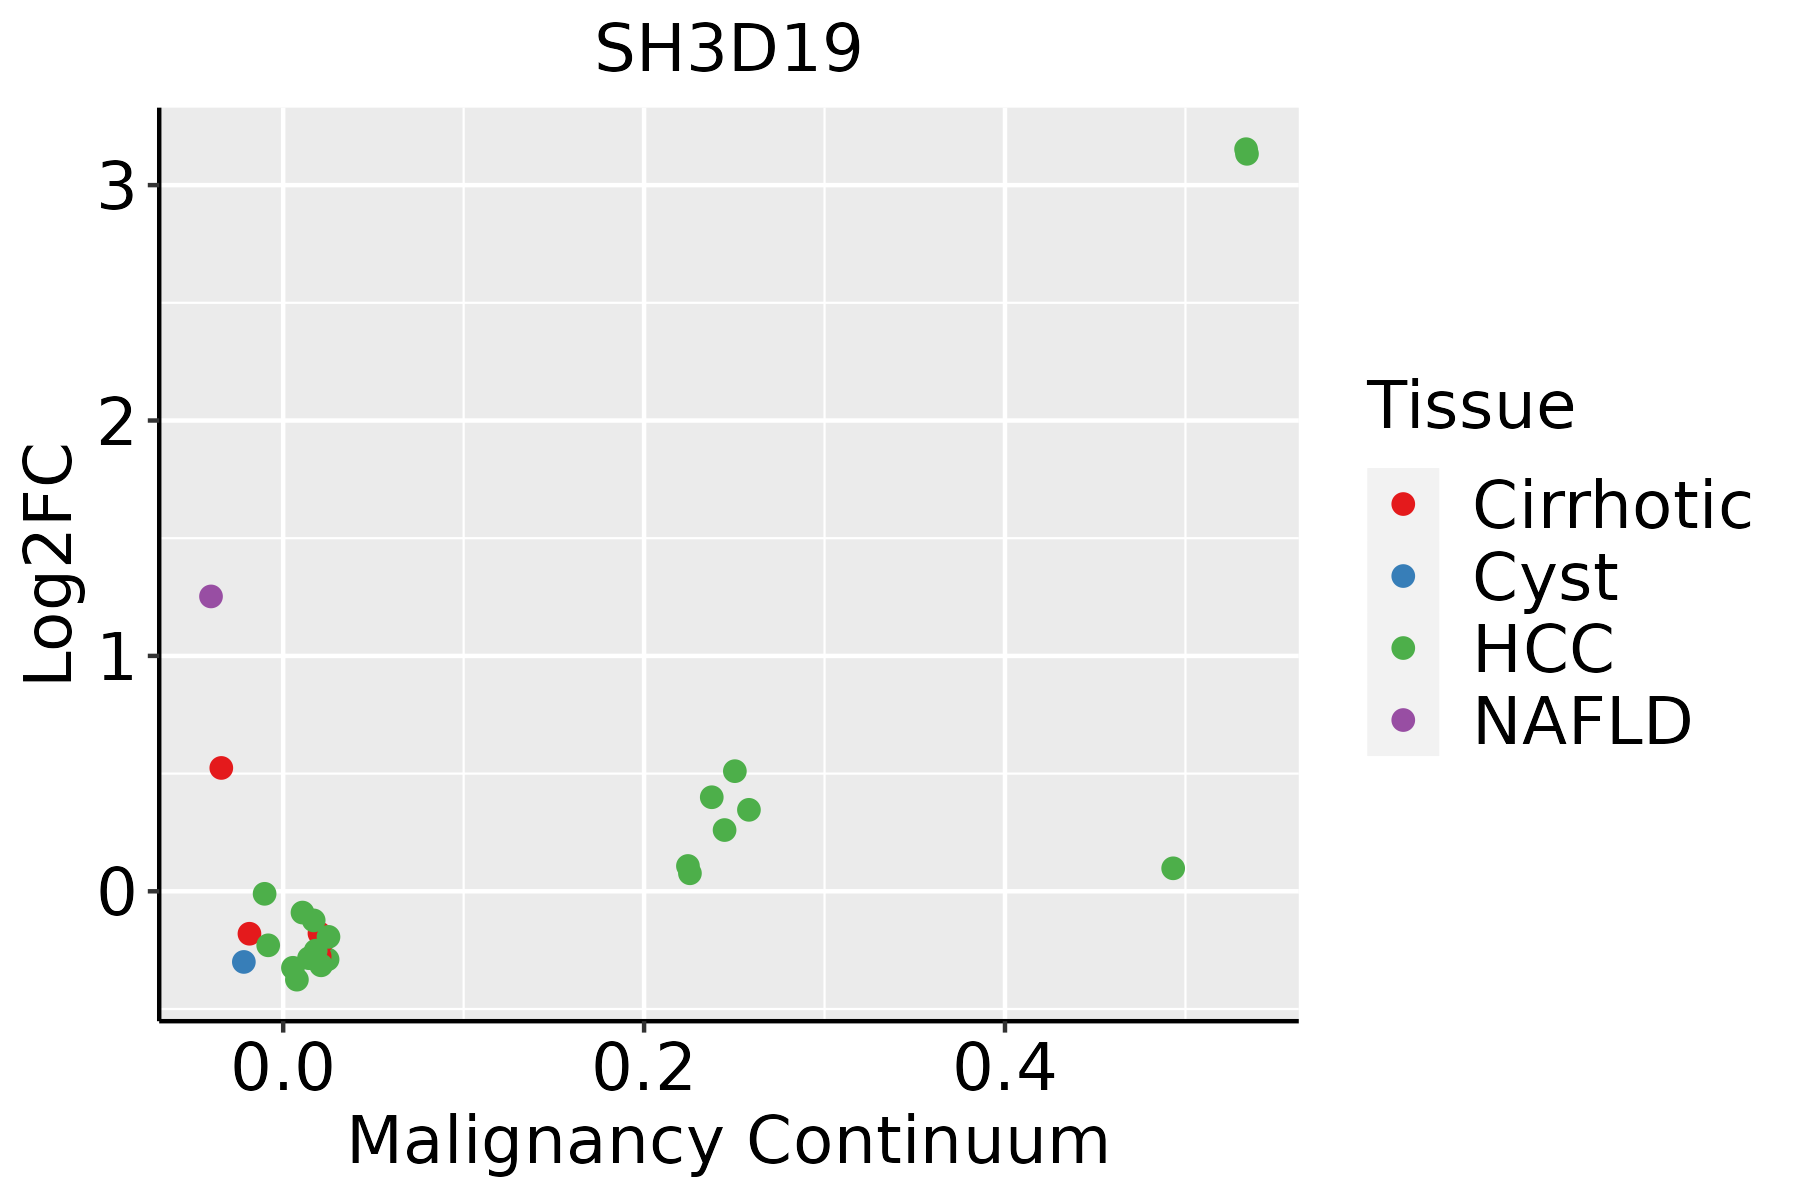 | HCC: Hepatocellular carcinoma |
| NAFLD: Non-alcoholic fatty liver disease | ||
| Lung | 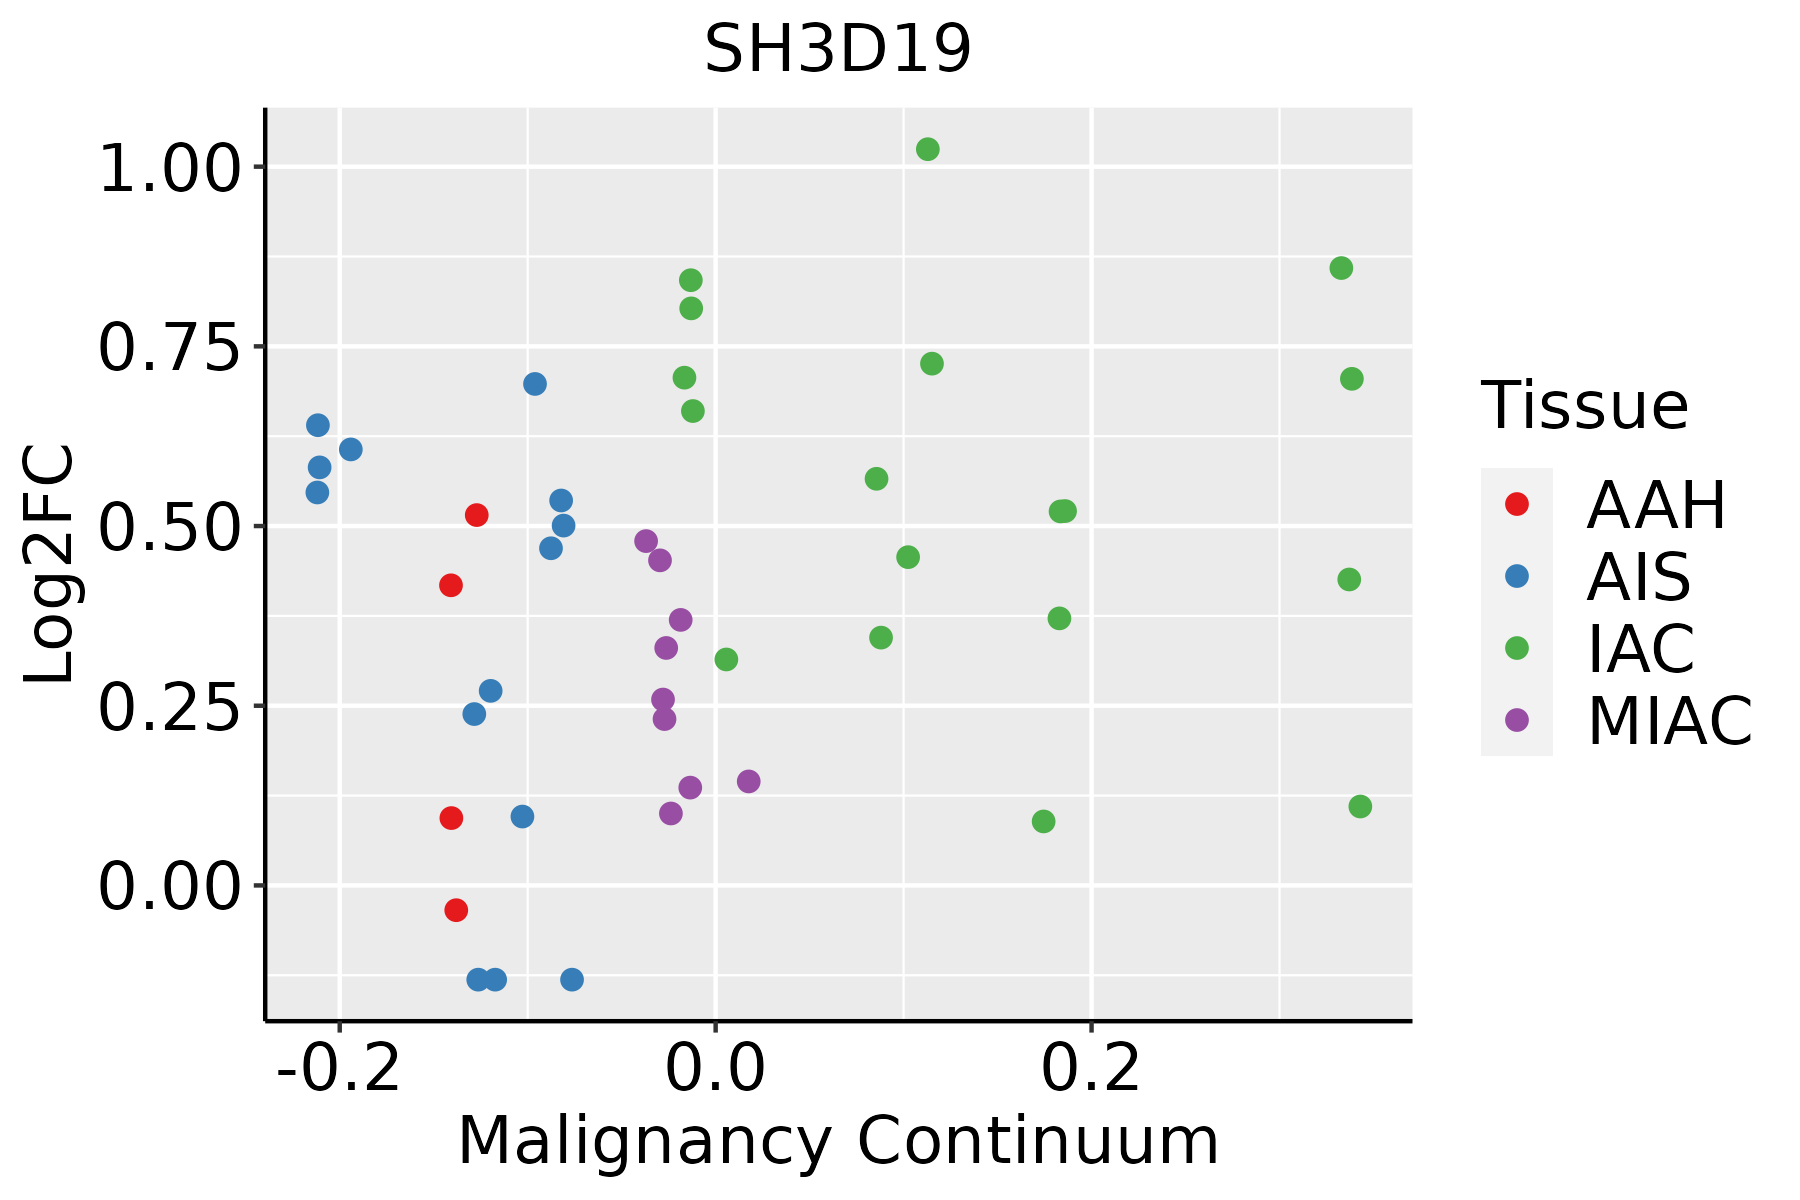 | AAH: Atypical adenomatous hyperplasia |
| AIS: Adenocarcinoma in situ | ||
| IAC: Invasive lung adenocarcinoma | ||
| MIA: Minimally invasive adenocarcinoma | ||
| Prostate | 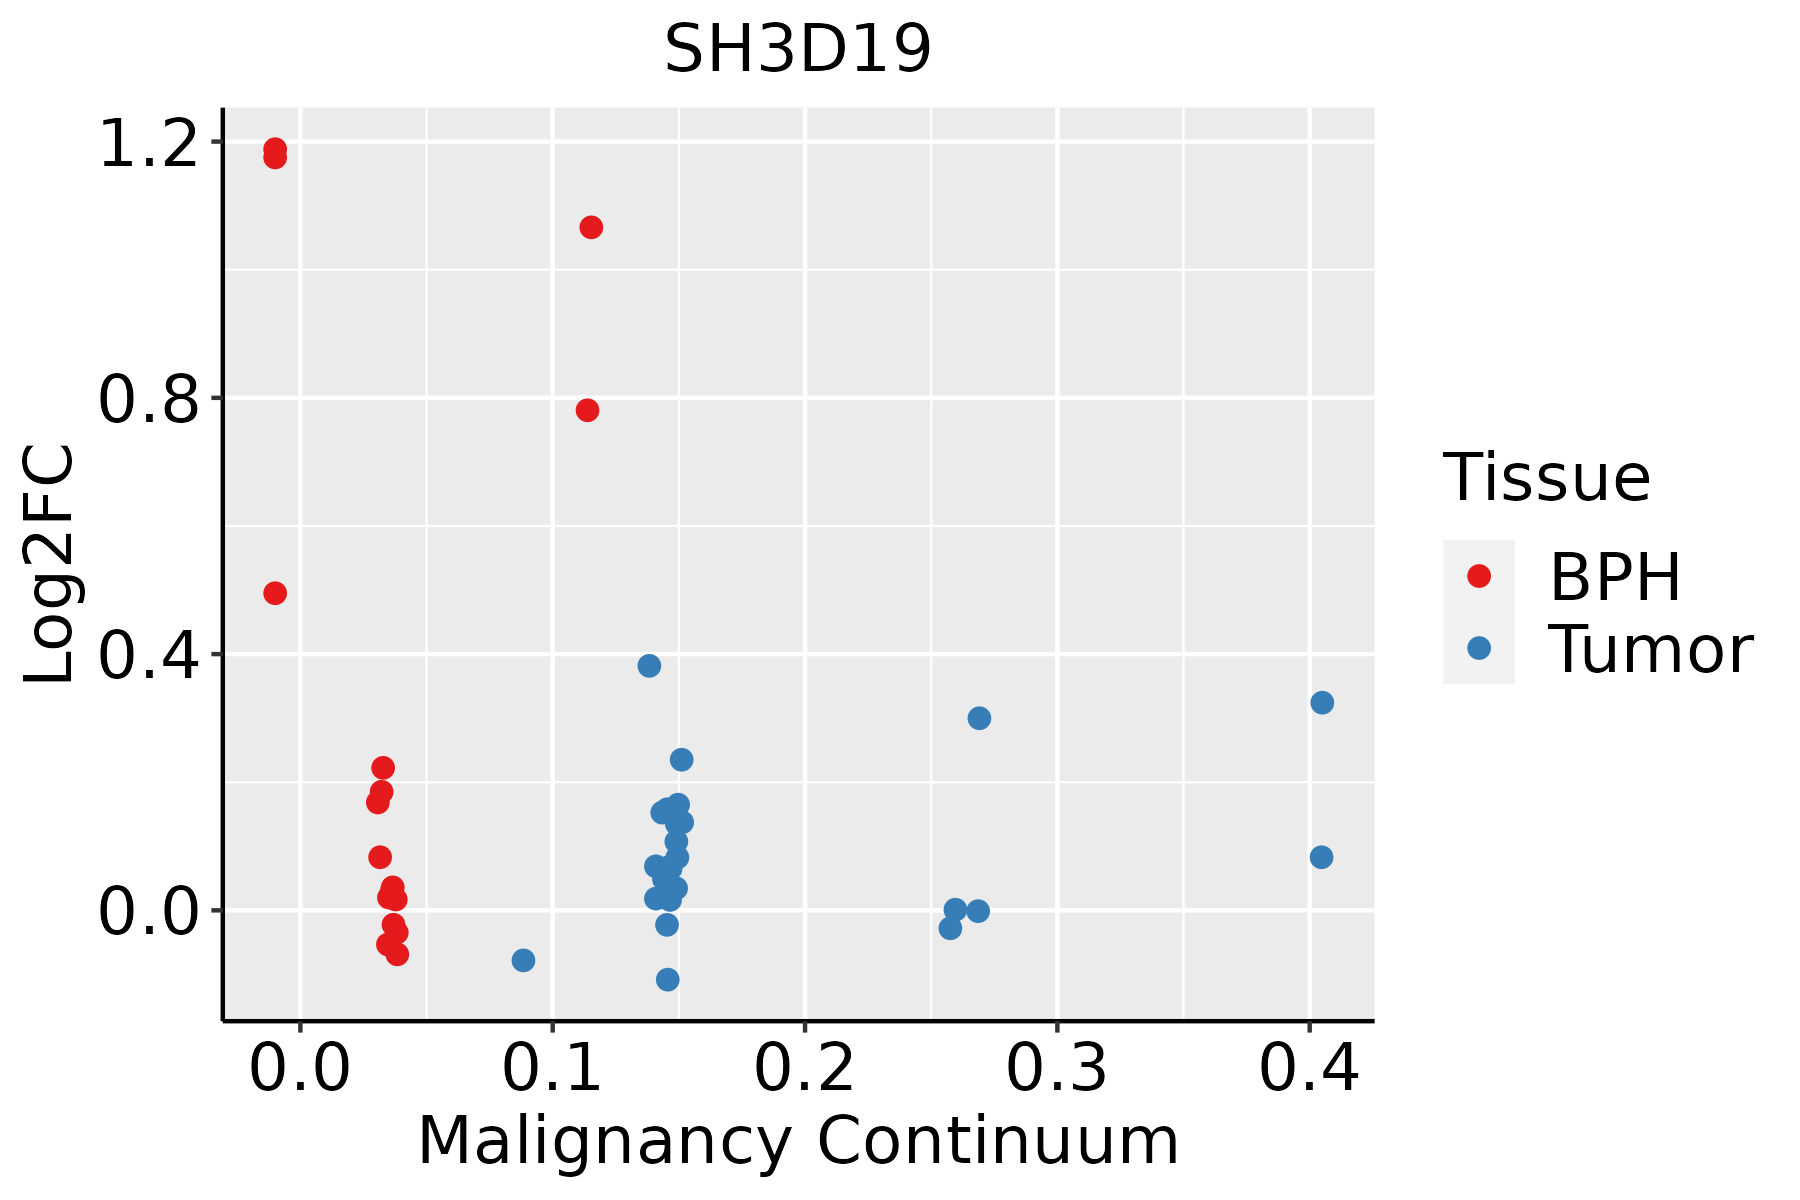 | BPH: Benign Prostatic Hyperplasia |
| Thyroid |  | ATC: Anaplastic thyroid cancer |
| HT: Hashimoto's thyroiditis | ||
| PTC: Papillary thyroid cancer |
| ∗log2FC in expression of this searched gene in stem-like cells from each diseased tissue sample relative to stem-like cells in normal samples in each tissue plotted against the malignancy continuum. Samples are colored based on if they are from different disease stage. |
Top |
Malignant transformation related pathway analysis |
| Find out the enriched GO biological processes and KEGG pathways involved in transition from healthy to precancer to cancer |
| Tissue | Disease Stage | Enriched GO biological Processes |
| Colorectum | AD |  |
| Colorectum | SER |  |
| Colorectum | MSS |  |
| Colorectum | MSI-H |  |
| Colorectum | FAP |  |
| ∗Top 15 enriched GO BP terms are showed in the bar plot of each disease state in each tissue. Each row represents a significant GO biological process which is colored according to the -log10(p.adjust). |
| Page: 1 2 3 4 5 6 7 8 9 |
| GO ID | Tissue | Disease Stage | Description | Gene Ratio | Bg Ratio | pvalue | p.adjust | Count |
| GO:004217610 | Cervix | CC | regulation of protein catabolic process | 104/2311 | 391/18723 | 9.39e-15 | 9.36e-12 | 104 |
| GO:002260410 | Cervix | CC | regulation of cell morphogenesis | 84/2311 | 309/18723 | 1.00e-12 | 4.29e-10 | 84 |
| GO:004586210 | Cervix | CC | positive regulation of proteolysis | 95/2311 | 372/18723 | 1.84e-12 | 6.86e-10 | 95 |
| GO:004573210 | Cervix | CC | positive regulation of protein catabolic process | 65/2311 | 231/18723 | 7.44e-11 | 1.39e-08 | 65 |
| GO:000989610 | Cervix | CC | positive regulation of catabolic process | 109/2311 | 492/18723 | 5.26e-10 | 6.99e-08 | 109 |
| GO:003133110 | Cervix | CC | positive regulation of cellular catabolic process | 91/2311 | 427/18723 | 9.64e-08 | 5.25e-06 | 91 |
| GO:0042176 | Colorectum | AD | regulation of protein catabolic process | 160/3918 | 391/18723 | 1.06e-19 | 7.34e-17 | 160 |
| GO:0009896 | Colorectum | AD | positive regulation of catabolic process | 180/3918 | 492/18723 | 4.33e-16 | 1.94e-13 | 180 |
| GO:0031331 | Colorectum | AD | positive regulation of cellular catabolic process | 156/3918 | 427/18723 | 4.68e-14 | 1.05e-11 | 156 |
| GO:0045732 | Colorectum | AD | positive regulation of protein catabolic process | 92/3918 | 231/18723 | 3.85e-11 | 4.47e-09 | 92 |
| GO:0045862 | Colorectum | AD | positive regulation of proteolysis | 129/3918 | 372/18723 | 4.04e-10 | 3.46e-08 | 129 |
| GO:0022604 | Colorectum | AD | regulation of cell morphogenesis | 109/3918 | 309/18723 | 3.08e-09 | 2.07e-07 | 109 |
| GO:0033619 | Colorectum | AD | membrane protein proteolysis | 21/3918 | 57/18723 | 4.16e-03 | 2.88e-02 | 21 |
| GO:00421761 | Colorectum | SER | regulation of protein catabolic process | 126/2897 | 391/18723 | 5.33e-17 | 2.52e-14 | 126 |
| GO:00457321 | Colorectum | SER | positive regulation of protein catabolic process | 77/2897 | 231/18723 | 9.91e-12 | 1.90e-09 | 77 |
| GO:00098961 | Colorectum | SER | positive regulation of catabolic process | 132/2897 | 492/18723 | 4.16e-11 | 6.72e-09 | 132 |
| GO:00458621 | Colorectum | SER | positive regulation of proteolysis | 106/2897 | 372/18723 | 8.40e-11 | 1.20e-08 | 106 |
| GO:00313311 | Colorectum | SER | positive regulation of cellular catabolic process | 114/2897 | 427/18723 | 1.22e-09 | 1.27e-07 | 114 |
| GO:00226041 | Colorectum | SER | regulation of cell morphogenesis | 89/2897 | 309/18723 | 1.51e-09 | 1.52e-07 | 89 |
| GO:00421762 | Colorectum | MSS | regulation of protein catabolic process | 145/3467 | 391/18723 | 2.03e-18 | 1.17e-15 | 145 |
| Page: 1 2 3 4 5 6 7 |
| Pathway ID | Tissue | Disease Stage | Description | Gene Ratio | Bg Ratio | pvalue | p.adjust | qvalue | Count |
| Page: 1 |
Top |
Cell-cell communication analysis |
| Identification of potential cell-cell interactions between two cell types and their ligand-receptor pairs for different disease states |
| Ligand | Receptor | LRpair | Pathway | Tissue | Disease Stage |
| Page: 1 |
Top |
Single-cell gene regulatory network inference analysis |
| Find out the significant the regulons (TFs) and the target genes of each regulon across cell types for different disease states |
| TF | Cell Type | Tissue | Disease Stage | Target Gene | RSS | Regulon Activity |
| ∗The dot plots of a searched regulon are shown for all cell subpopulations in each disease state of each tissue based on the regulon specific score inferred using pySCENIC and by calculating the average expression. |
| Page: 1 |
Top |
Somatic mutation of malignant transformation related genes |
| Annotation of somatic variants for genes involved in malignant transformation |
| Hugo Symbol | Variant Class | Variant Classification | dbSNP RS | HGVSc | HGVSp | HGVSp Short | SWISSPROT | BIOTYPE | SIFT | PolyPhen | Tumor Sample Barcode | Tissue | Histology | Sex | Age | Stage | Therapy Types | Drugs | Outcome |
| SH3D19 | SNV | Missense_Mutation | c.719N>T | p.Thr240Ile | p.T240I | Q5HYK7 | protein_coding | tolerated(0.07) | benign(0.005) | TCGA-A2-A0EO-01 | Breast | breast invasive carcinoma | Female | <65 | I/II | Hormone Therapy | tamoxiphen | SD | |
| SH3D19 | SNV | Missense_Mutation | novel | c.1747N>G | p.Ile583Val | p.I583V | Q5HYK7 | protein_coding | tolerated(0.6) | possibly_damaging(0.685) | TCGA-A2-A4RW-01 | Breast | breast invasive carcinoma | Female | <65 | III/IV | Unknown | Unknown | SD |
| SH3D19 | SNV | Missense_Mutation | rs531866009 | c.671C>A | p.Ser224Tyr | p.S224Y | Q5HYK7 | protein_coding | tolerated(0.33) | benign(0.001) | TCGA-AN-A046-01 | Breast | breast invasive carcinoma | Female | >=65 | I/II | Unknown | Unknown | SD |
| SH3D19 | SNV | Missense_Mutation | c.44N>A | p.Ser15Tyr | p.S15Y | Q5HYK7 | protein_coding | deleterious(0) | probably_damaging(0.998) | TCGA-B6-A0X0-01 | Breast | breast invasive carcinoma | Female | <65 | I/II | Unknown | Unknown | SD | |
| SH3D19 | SNV | Missense_Mutation | c.1660N>A | p.Asp554Asn | p.D554N | Q5HYK7 | protein_coding | tolerated(0.14) | benign(0.186) | TCGA-BH-A18P-01 | Breast | breast invasive carcinoma | Female | <65 | I/II | Unknown | Unknown | PD | |
| SH3D19 | SNV | Missense_Mutation | c.2293N>T | p.Asp765Tyr | p.D765Y | Q5HYK7 | protein_coding | deleterious(0) | possibly_damaging(0.764) | TCGA-E9-A1NA-01 | Breast | breast invasive carcinoma | Female | <65 | I/II | Chemotherapy | cyclophosphamide | SD | |
| SH3D19 | SNV | Missense_Mutation | c.1804N>C | p.Glu602Gln | p.E602Q | Q5HYK7 | protein_coding | deleterious(0.04) | possibly_damaging(0.525) | TCGA-EX-A3L1-01 | Cervix | cervical & endocervical cancer | Female | <65 | I/II | Chemotherapy | cisplatin | CR | |
| SH3D19 | SNV | Missense_Mutation | c.1439G>C | p.Arg480Thr | p.R480T | Q5HYK7 | protein_coding | tolerated(0.4) | benign(0.045) | TCGA-Q1-A73O-01 | Cervix | cervical & endocervical cancer | Female | <65 | I/II | Chemotherapy | cisplatin | CR | |
| SH3D19 | SNV | Missense_Mutation | c.985A>G | p.Asn329Asp | p.N329D | Q5HYK7 | protein_coding | tolerated(0.78) | benign(0) | TCGA-AA-3663-01 | Colorectum | colon adenocarcinoma | Male | <65 | I/II | Unknown | Unknown | SD | |
| SH3D19 | SNV | Missense_Mutation | c.2158G>T | p.Ala720Ser | p.A720S | Q5HYK7 | protein_coding | deleterious(0.03) | possibly_damaging(0.511) | TCGA-AA-3811-01 | Colorectum | colon adenocarcinoma | Female | >=65 | III/IV | Unknown | Unknown | PD |
| Page: 1 2 3 4 5 6 7 |
Top |
Related drugs of malignant transformation related genes |
| Identification of chemicals and drugs interact with genes involved in malignant transfromation |
| (DGIdb 4.0) |
| Entrez ID | Symbol | Category | Interaction Types | Drug Claim Name | Drug Name | PMIDs |
| Page: 1 |

Copyright 2023-Present -The University of Texas Health Science Center at Houston |