Schematic overview of the cellular and molecular mechanisms involved in the cancer progression, including the proposed cellular and molecular mechanisms in cancer cells trajectory. AT1: alveolar type 1 cells; AT2: alveolar type 2 cells; AAH: atypical adenomatous hyperplasia; AIS: adenocarcinoma in situ; MIA: minimally invasive adenocarcinoma; IA: invasive adenocarcinoma; EMT: epithelial-mesenchymal transition

Home

Download

Statistics

Help

Contact

Center for Computational Systems Medicine
leaf

Gene summary

leaf

Malignant transformation analysis

leaf

Malignant transformation related pathway analysis

leaf

Cell-cell communication analysis

leaf

Single-cell gene regulatory network inference analysis

leaf

Somatic mutation of malignant transformation related genes

leaf

Related drugs of malignant transformation related genes

Gene: SFSWAP

Gene summary for SFSWAP

check button Gene summary.

Gene informationSpeciesHuman
Gene symbol

SFSWAP

Gene ID

6433

Gene namesplicing factor SWAP
Gene AliasSFRS8
Cytomap12q24.33
Gene Typeprotein-coding
GO ID

GO:0000245

UniProtAcc

Q12872


Top

Malignant transformation analysis

check button Identification of the aberrant gene expression in precancerous and cancerous lesions by comparing the gene expression of stem-like cells in diseased tissues with normal stem cells
check button Malignant transformation involving gene list.
Entrez IDSymbolReplicatesSpeciesOrganTissueAdj P-valueLog2FCMalignancy
6433SFSWAPC57HumanOral cavityOSCC1.08e-032.19e-010.1679
6433SFSWAPC06HumanOral cavityOSCC6.95e-036.38e-010.2699
6433SFSWAPC08HumanOral cavityOSCC8.32e-103.06e-010.1919
6433SFSWAPLN22HumanOral cavityOSCC2.26e-049.09e-010.1733
6433SFSWAPLN46HumanOral cavityOSCC3.24e-032.81e-010.1666
6433SFSWAPEOLP-1HumanOral cavityEOLP1.20e-092.02e-01-0.0202
6433SFSWAPNEOLP-3HumanOral cavityNEOLP5.46e-031.32e-01-0.0191
6433SFSWAPSYSMH1HumanOral cavityOSCC1.86e-173.45e-010.1127
6433SFSWAPSYSMH2HumanOral cavityOSCC3.39e-226.61e-010.2326
6433SFSWAPSYSMH3HumanOral cavityOSCC7.72e-276.22e-010.2442
6433SFSWAPSYSMH4HumanOral cavityOSCC2.00e-045.96e-020.1226
6433SFSWAPSYSMH5HumanOral cavityOSCC2.63e-072.31e-010.0647
6433SFSWAPSYSMH6HumanOral cavityOSCC4.51e-051.96e-010.1275
6433SFSWAPP1_S1_AKHumanSkinAK1.66e-062.62e-01-0.3399
6433SFSWAPP2_S3_AKHumanSkinAK6.90e-052.20e-01-0.3287
6433SFSWAPP4_S8_cSCCHumanSkincSCC5.53e-153.20e-01-0.3095
6433SFSWAPP5_S10_cSCCHumanSkincSCC2.43e-112.28e-01-0.299
6433SFSWAPP1_cSCCHumanSkincSCC2.69e-206.61e-010.0292
6433SFSWAPP2_cSCCHumanSkincSCC3.72e-123.70e-01-0.024
6433SFSWAPP4_cSCCHumanSkincSCC7.14e-184.76e-01-0.00290000000000005
Page: 1 2 3 4 5 6 

check button Transcriptomic changes along malignancy continuum.
TissueExpression DynamicsAbbreviation
EsophagusThe image shows the transcriptomic changes along malignancy continuum.log2FC in expression of this searched gene in stem-like cells from each diseased tissue sample relative to stem-like cells in normal samples in each tissue plotted against the malignancy continuum. Samples are colored based on if they are from different disease stage.
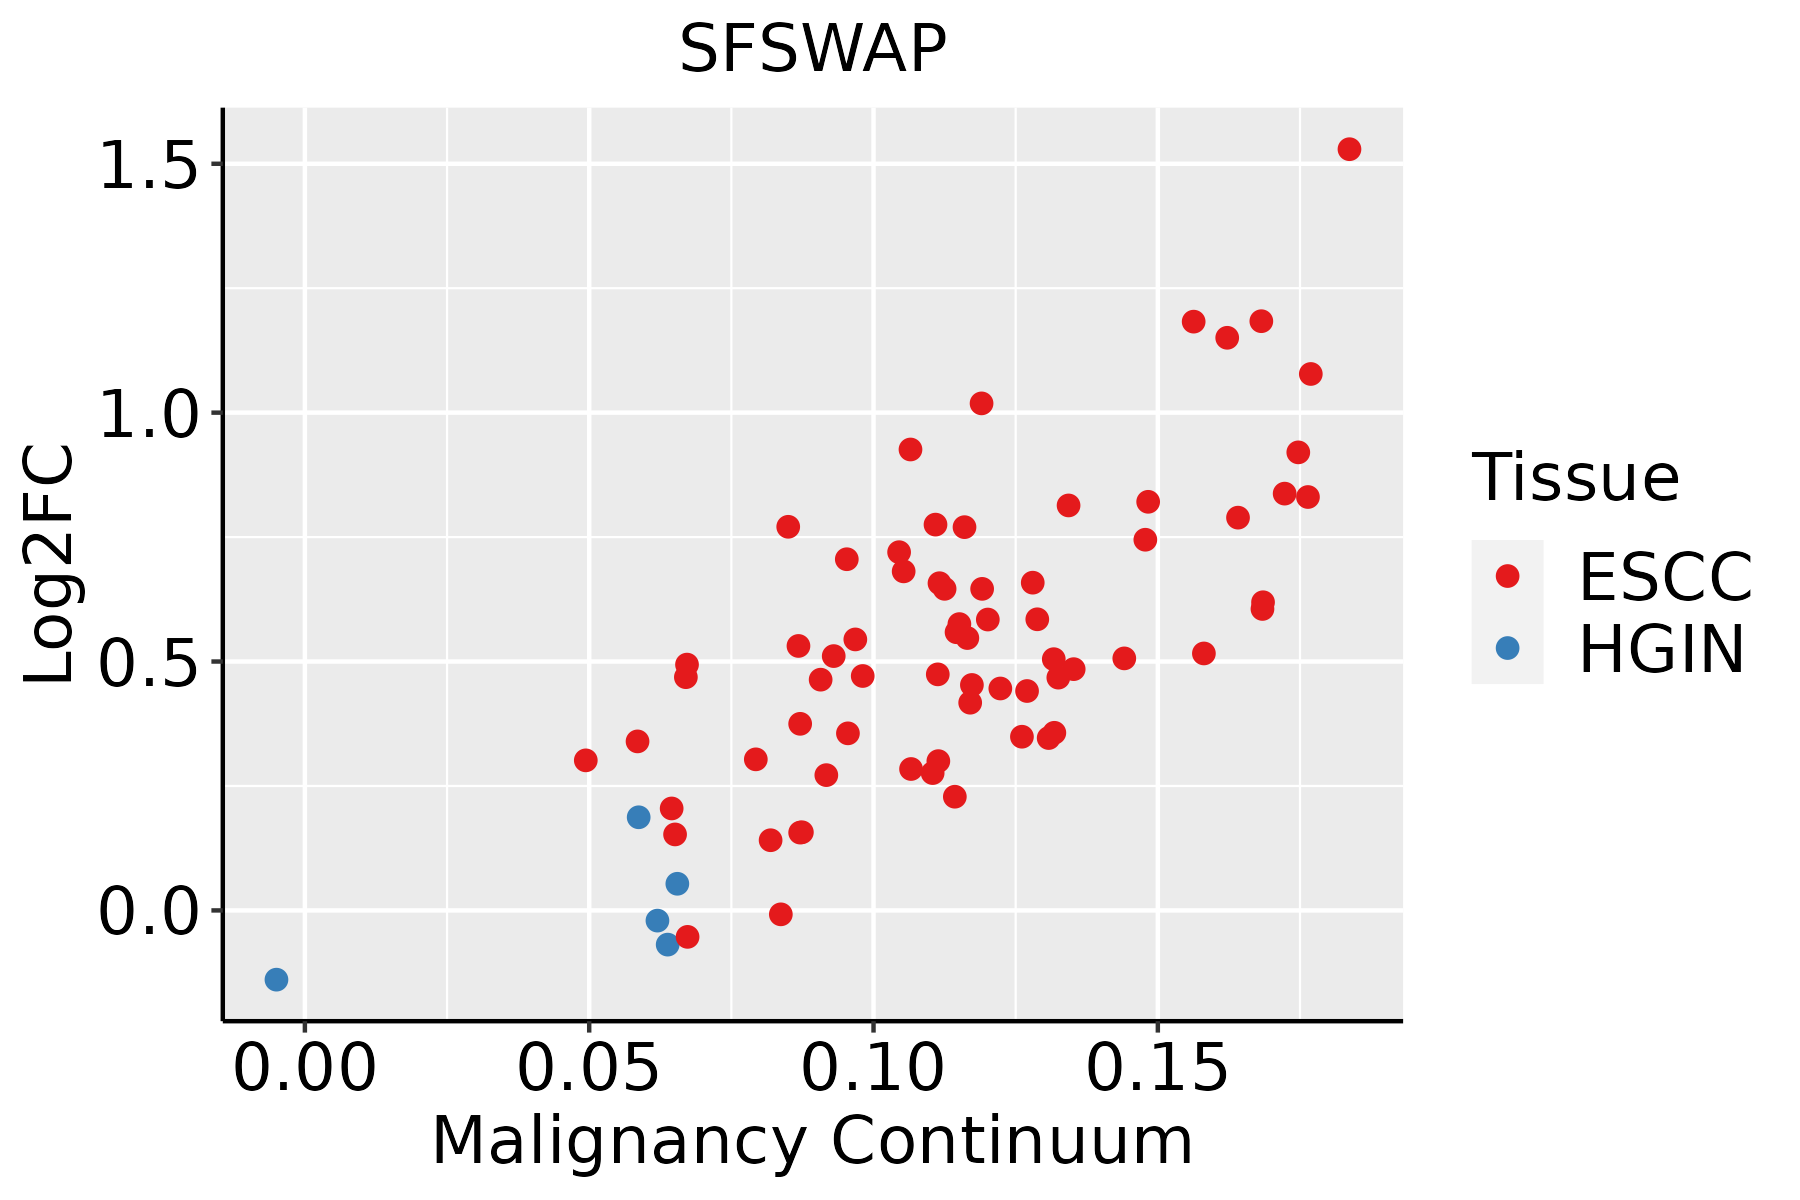
ESCC: Esophageal squamous cell carcinoma
HGIN: High-grade intraepithelial neoplasias
LGIN: Low-grade intraepithelial neoplasias
LiverThe image shows the transcriptomic changes along malignancy continuum.log2FC in expression of this searched gene in stem-like cells from each diseased tissue sample relative to stem-like cells in normal samples in each tissue plotted against the malignancy continuum. Samples are colored based on if they are from different disease stage.
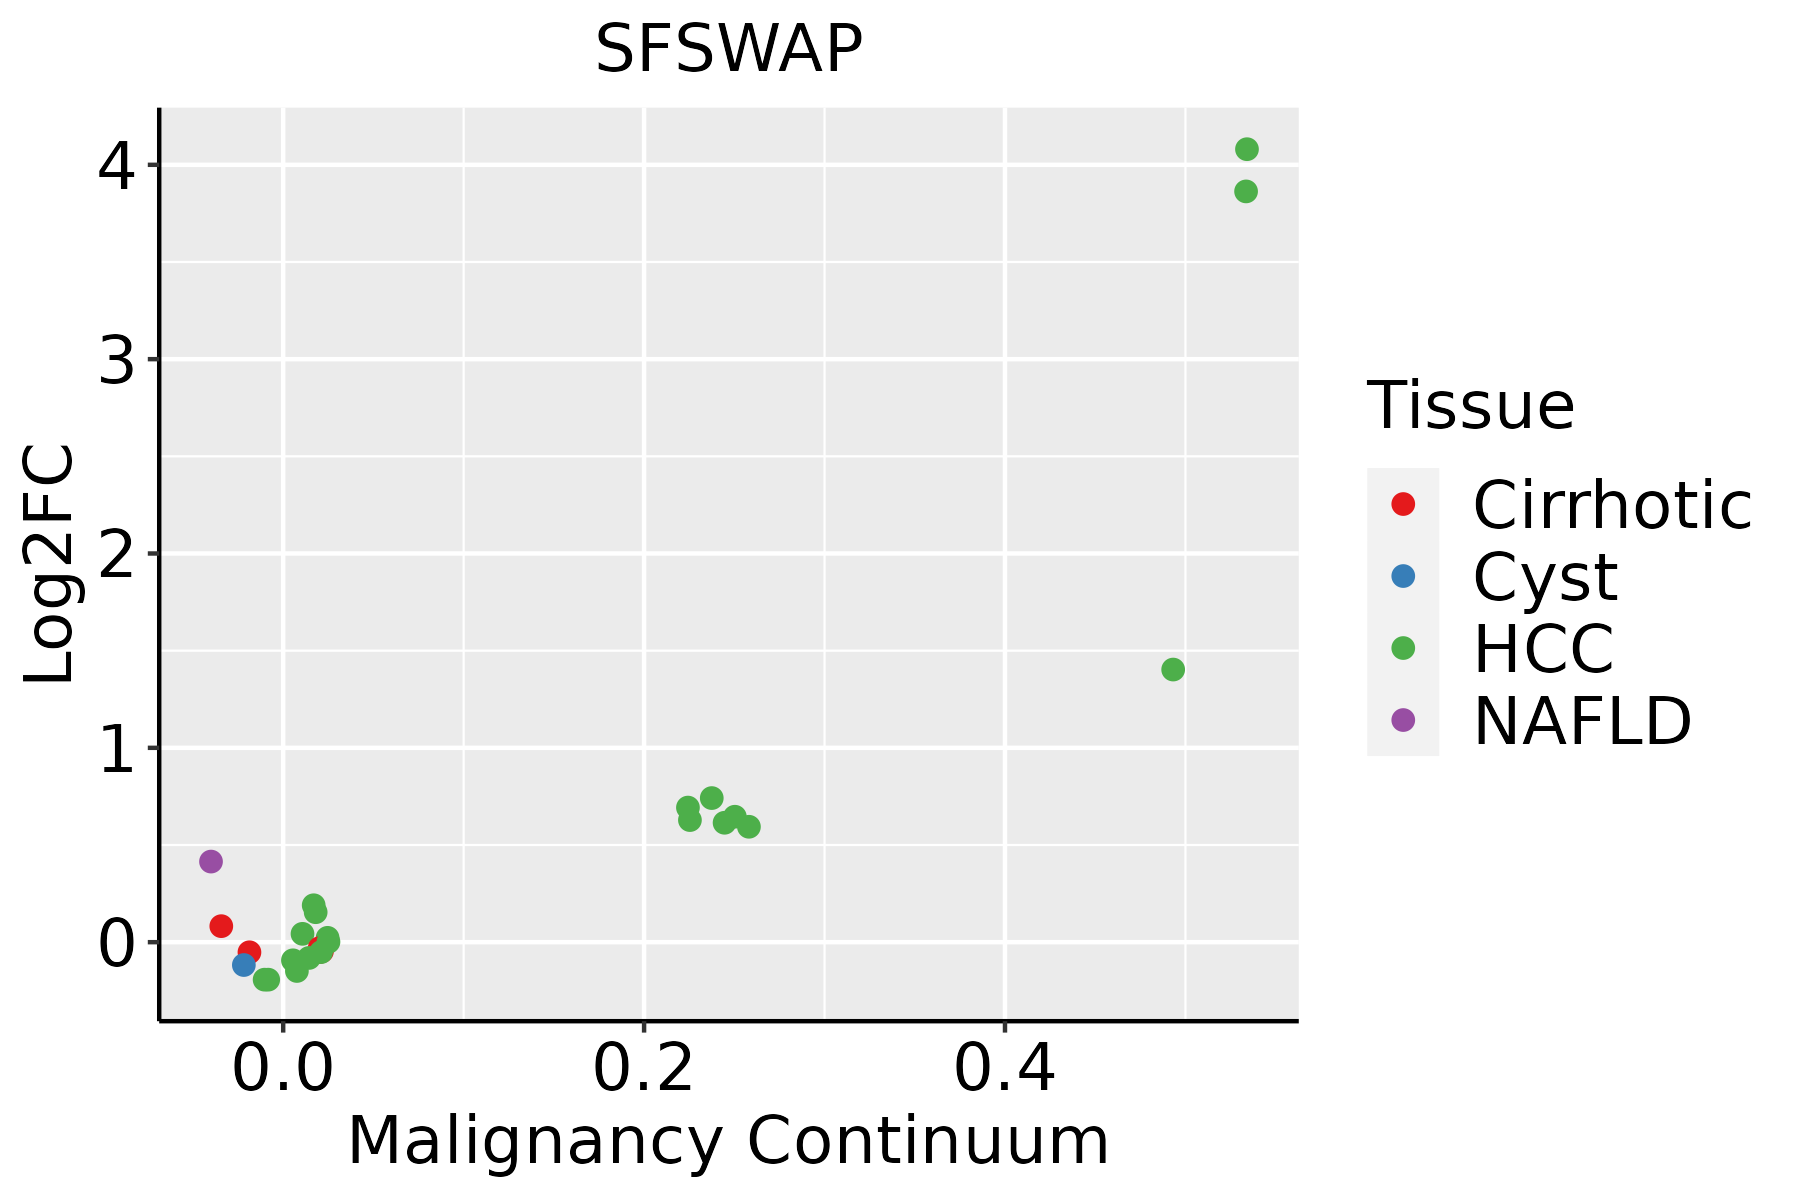
HCC: Hepatocellular carcinoma
NAFLD: Non-alcoholic fatty liver disease
Oral CavityThe image shows the transcriptomic changes along malignancy continuum.log2FC in expression of this searched gene in stem-like cells from each diseased tissue sample relative to stem-like cells in normal samples in each tissue plotted against the malignancy continuum. Samples are colored based on if they are from different disease stage.
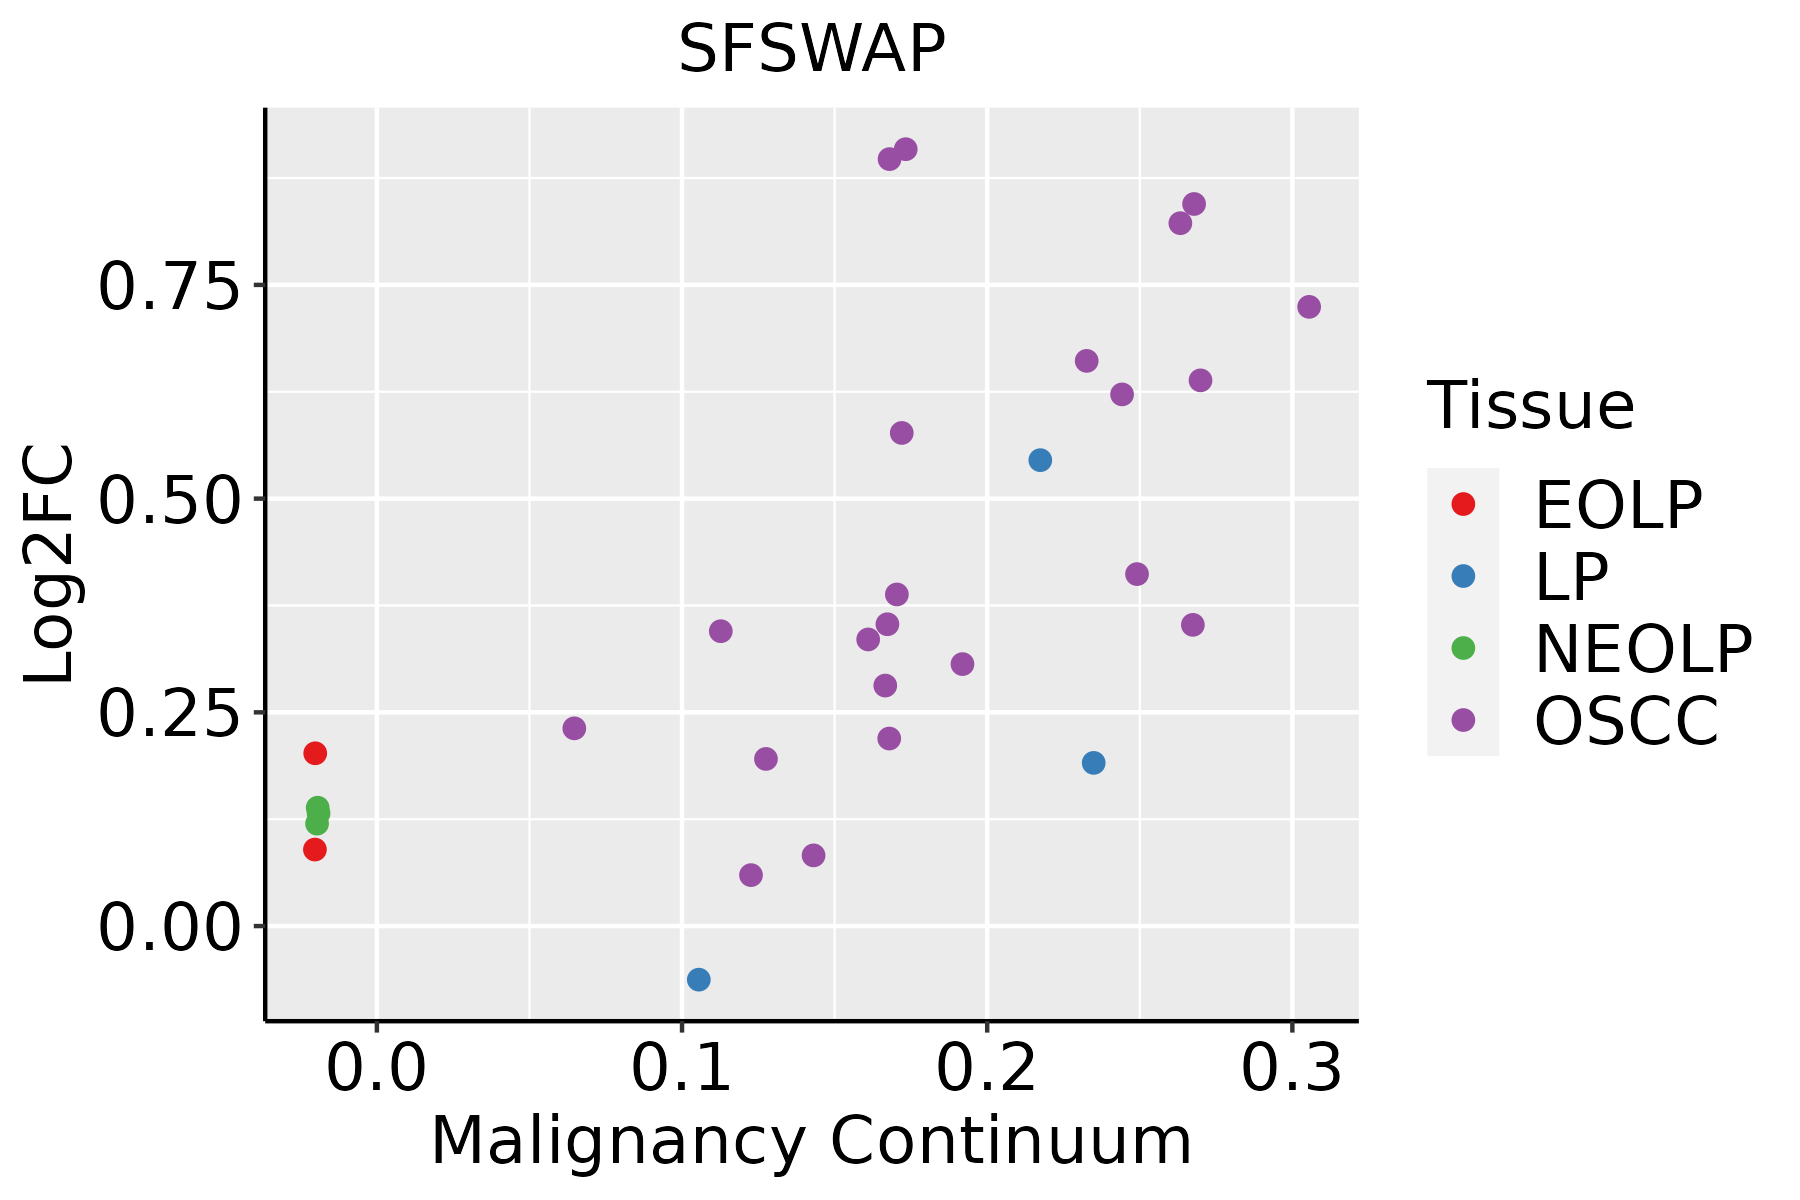
EOLP: Erosive Oral lichen planus
LP: leukoplakia
NEOLP: Non-erosive oral lichen planus
OSCC: Oral squamous cell carcinoma
SkinThe image shows the transcriptomic changes along malignancy continuum.log2FC in expression of this searched gene in stem-like cells from each diseased tissue sample relative to stem-like cells in normal samples in each tissue plotted against the malignancy continuum. Samples are colored based on if they are from different disease stage.
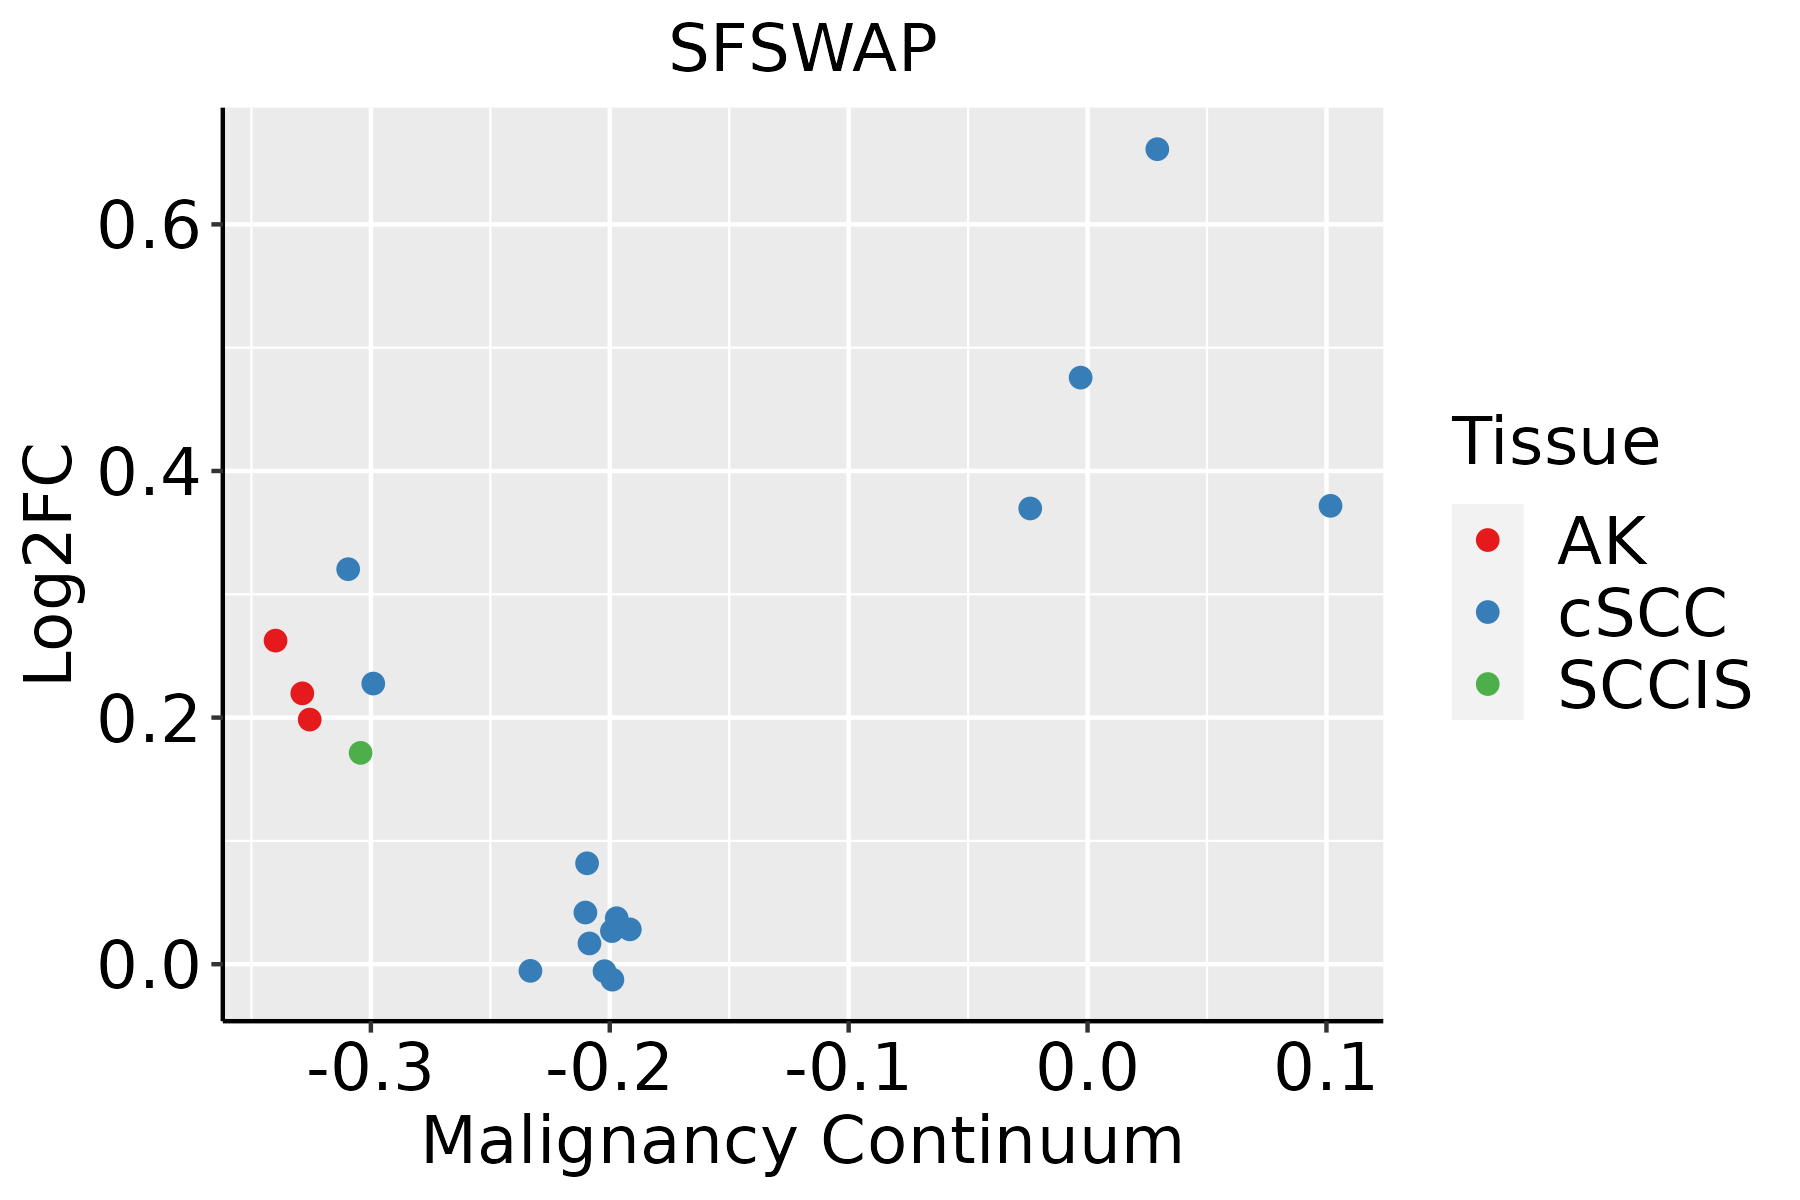
AK: Actinic keratosis
cSCC: Cutaneous squamous cell carcinoma
SCCIS:squamous cell carcinoma in situ
ThyroidThe image shows the transcriptomic changes along malignancy continuum.log2FC in expression of this searched gene in stem-like cells from each diseased tissue sample relative to stem-like cells in normal samples in each tissue plotted against the malignancy continuum. Samples are colored based on if they are from different disease stage.
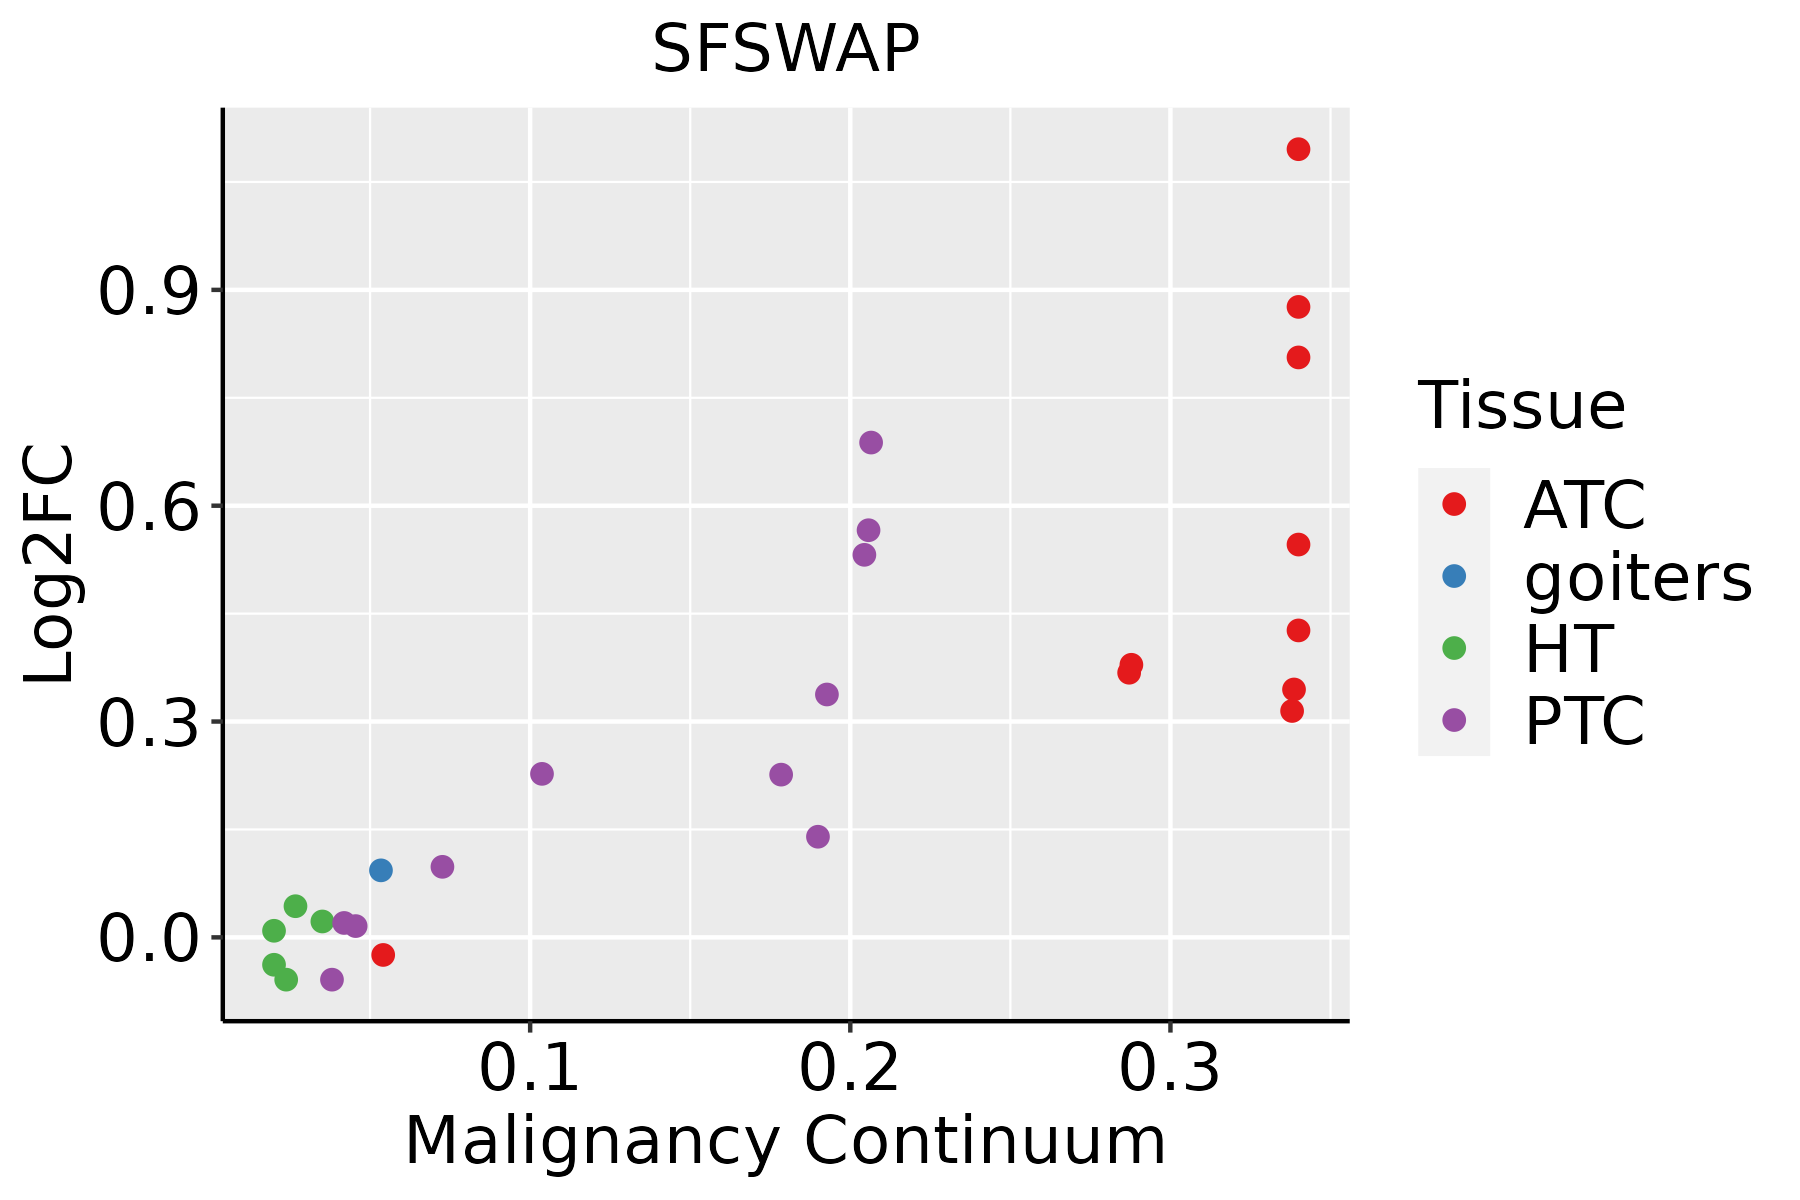
ATC: Anaplastic thyroid cancer
HT: Hashimoto's thyroiditis
PTC: Papillary thyroid cancer
∗log2FC in expression of this searched gene in stem-like cells from each diseased tissue sample relative to stem-like cells in normal samples in each tissue plotted against the malignancy continuum. Samples are colored based on if they are from different disease stage.

Top

Malignant transformation related pathway analysis

check buttonFind out the enriched GO biological processes and KEGG pathways involved in transition from healthy to precancer to cancer
check button Figure of enriched GO biological processes.
TissueDisease StageEnriched GO biological Processes
ColorectumADGO analysis - Figure of enriched GO biological processes: Top 15 enriched GO BP terms are showed in the bar plot of each disease state in each tissue. Each row represents a significant GO biological process which is colored according to the -log10(p.adjust).
ColorectumSERGO analysis - Figure of enriched GO biological processes: Top 15 enriched GO BP terms are showed in the bar plot of each disease state in each tissue. Each row represents a significant GO biological process which is colored according to the -log10(p.adjust).
ColorectumMSSGO analysis - Figure of enriched GO biological processes: Top 15 enriched GO BP terms are showed in the bar plot of each disease state in each tissue. Each row represents a significant GO biological process which is colored according to the -log10(p.adjust).
ColorectumMSI-HGO analysis - Figure of enriched GO biological processes: Top 15 enriched GO BP terms are showed in the bar plot of each disease state in each tissue. Each row represents a significant GO biological process which is colored according to the -log10(p.adjust).
ColorectumFAPGO analysis - Figure of enriched GO biological processes: Top 15 enriched GO BP terms are showed in the bar plot of each disease state in each tissue. Each row represents a significant GO biological process which is colored according to the -log10(p.adjust).
∗Top 15 enriched GO BP terms are showed in the bar plot of each disease state in each tissue. Each row represents a significant GO biological process which is colored according to the -log10(p.adjust).
Page: 1 2 3 4 5 6 7 8 9 

check button Enriched GO biological processes.
GO IDTissueDisease StageDescriptionGene RatioBg Ratiopvaluep.adjustCount
GO:0022613111EsophagusESCCribonucleoprotein complex biogenesis365/8552463/187231.74e-491.11e-45365
GO:0008380111EsophagusESCCRNA splicing336/8552434/187231.74e-423.67e-39336
GO:0000375111EsophagusESCCRNA splicing, via transesterification reactions248/8552324/187233.05e-301.49e-27248
GO:0000377111EsophagusESCCRNA splicing, via transesterification reactions with bulged adenosine as nucleophile244/8552320/187232.52e-291.07e-26244
GO:0000398111EsophagusESCCmRNA splicing, via spliceosome244/8552320/187232.52e-291.07e-26244
GO:1903311110EsophagusESCCregulation of mRNA metabolic process210/8552288/187233.25e-215.56e-19210
GO:0071826111EsophagusESCCribonucleoprotein complex subunit organization166/8552227/187232.94e-172.42e-15166
GO:0043484111EsophagusESCCregulation of RNA splicing116/8552148/187233.18e-162.38e-14116
GO:0050684110EsophagusESCCregulation of mRNA processing109/8552137/187233.51e-162.59e-14109
GO:0022618111EsophagusESCCribonucleoprotein complex assembly159/8552220/187238.19e-165.71e-14159
GO:0048024111EsophagusESCCregulation of mRNA splicing, via spliceosome78/8552101/187238.72e-112.66e-0978
GO:005068615EsophagusESCCnegative regulation of mRNA processing26/855229/187238.98e-071.15e-0526
GO:000038019EsophagusESCCalternative mRNA splicing, via spliceosome55/855277/187234.07e-064.38e-0555
GO:0033119111EsophagusESCCnegative regulation of RNA splicing22/855225/187231.33e-051.21e-0422
GO:1903312111EsophagusESCCnegative regulation of mRNA metabolic process62/855292/187232.08e-051.80e-0462
GO:004802517EsophagusESCCnegative regulation of mRNA splicing, via spliceosome17/855220/187233.43e-042.01e-0317
GO:000024514EsophagusESCCspliceosomal complex assembly48/855279/187234.93e-031.89e-0248
GO:002261322LiverHCCribonucleoprotein complex biogenesis355/7958463/187237.76e-524.92e-48355
GO:000838022LiverHCCRNA splicing313/7958434/187231.36e-361.73e-33313
GO:000037522LiverHCCRNA splicing, via transesterification reactions228/7958324/187231.47e-244.06e-22228
Page: 1 2 3 4 5 6 7 8 

check button Enriched KEGG pathways.
Pathway IDTissueDisease StageDescriptionGene RatioBg Ratiopvaluep.adjustqvalueCount
Page: 1 

Top

Cell-cell communication analysis

check buttonIdentification of potential cell-cell interactions between two cell types and their ligand-receptor pairs for different disease states
LigandReceptorLRpairPathwayTissueDisease Stage
Page: 1 

Top

Single-cell gene regulatory network inference analysis

check buttonFind out the significant the regulons (TFs) and the target genes of each regulon across cell types for different disease states
TFCell TypeTissueDisease StageTarget GeneRSSRegulon Activity
∗The dot plots of a searched regulon are shown for all cell subpopulations in each disease state of each tissue based on the regulon specific score inferred using pySCENIC and by calculating the average expression.
Page: 1 

Top

Somatic mutation of malignant transformation related genes

check buttonAnnotation of somatic variants for genes involved in malignant transformation
Hugo SymbolVariant ClassVariant ClassificationdbSNP RSHGVScHGVSpHGVSp ShortSWISSPROTBIOTYPESIFTPolyPhenTumor Sample BarcodeTissueHistologySexAgeStageTherapy TypesDrugsOutcome
SFSWAPSNVMissense_Mutationnovelc.1058C>Gp.Ser353Cysp.S353CQ12872protein_codingdeleterious(0.01)possibly_damaging(0.741)TCGA-A8-A07U-01Breastbreast invasive carcinomaFemale>=65III/IVChemotherapy5-fluorouracilSD
SFSWAPSNVMissense_Mutationc.1903G>Cp.Glu635Glnp.E635QQ12872protein_codingdeleterious(0.01)probably_damaging(0.996)TCGA-AN-A0XW-01Breastbreast invasive carcinomaFemale<65III/IVUnknownUnknownSD
SFSWAPSNVMissense_Mutationnovelc.1015A>Tp.Thr339Serp.T339SQ12872protein_codingtolerated(0.48)benign(0.007)TCGA-AR-A256-01Breastbreast invasive carcinomaFemale<65I/IIChemotherapydoxorubicinPD
SFSWAPSNVMissense_Mutationnovelc.1136G>Tp.Cys379Phep.C379FQ12872protein_codingdeleterious(0.01)probably_damaging(0.997)TCGA-B6-A2IU-01Breastbreast invasive carcinomaFemale<65I/IIUnknownUnknownPD
SFSWAPSNVMissense_Mutationnovelc.865N>Ap.Asp289Asnp.D289NQ12872protein_codingdeleterious(0.03)probably_damaging(0.962)TCGA-D8-A1J8-01Breastbreast invasive carcinomaFemale>=65I/IIHormone TherapynolvadexSD
SFSWAPSNVMissense_Mutationc.1903N>Ap.Glu635Lysp.E635KQ12872protein_codingdeleterious(0.04)probably_damaging(0.99)TCGA-D8-A1J8-01Breastbreast invasive carcinomaFemale>=65I/IIHormone TherapynolvadexSD
SFSWAPSNVMissense_Mutationnovelc.204N>Tp.Lys68Asnp.K68NQ12872protein_codingtolerated(0.33)benign(0.054)TCGA-E2-A1IK-01Breastbreast invasive carcinomaFemale>=65I/IIHormone TherapyarimidexSD
SFSWAPSNVMissense_Mutationc.1157N>Ap.Gly386Glup.G386EQ12872protein_codingdeleterious(0)probably_damaging(1)TCGA-EW-A1J5-01Breastbreast invasive carcinomaFemale<65I/IIChemotherapyadriamycinSD
SFSWAPinsertionFrame_Shift_Insnovelc.1704_1705insATATTTTTGCCATCTCCTAATAAAGAp.Gly569IlefsTer13p.G569Ifs*13Q12872protein_codingTCGA-AN-A049-01Breastbreast invasive carcinomaFemale<65I/IIUnknownUnknownSD
SFSWAPinsertionNonsense_Mutationnovelc.2939_2940insAGTATAAp.Thr981ValfsTer2p.T981Vfs*2Q12872protein_codingTCGA-AN-A0FX-01Breastbreast invasive carcinomaFemale<65I/IIUnknownUnknownSD
Page: 1 2 3 4 5 6 7 8 9 10 11 12 13 14 

Top

Related drugs of malignant transformation related genes

check buttonIdentification of chemicals and drugs interact with genes involved in malignant transfromation
(DGIdb 4.0)
Entrez IDSymbolCategoryInteraction TypesDrug Claim NameDrug NamePMIDs
Page: 1