
|
|||||
|
 | |
| |
| |
| |
| |
| |
|
Gene: SERTAD1 |
Gene summary for SERTAD1 |
| Gene information | Species | Human | Gene symbol | SERTAD1 | Gene ID | 29950 |
| Gene name | SERTA domain containing 1 | |
| Gene Alias | SEI1 | |
| Cytomap | 19q13.2 | |
| Gene Type | protein-coding | GO ID | GO:0000079 | UniProtAcc | Q53GC0 |
Top |
Malignant transformation analysis |
| Identification of the aberrant gene expression in precancerous and cancerous lesions by comparing the gene expression of stem-like cells in diseased tissues with normal stem cells |
| Entrez ID | Symbol | Replicates | Species | Organ | Tissue | Adj P-value | Log2FC | Malignancy |
| 29950 | SERTAD1 | S015 | Human | Liver | HCC | 2.07e-09 | 1.36e+00 | 0.2375 |
| 29950 | SERTAD1 | S016 | Human | Liver | HCC | 1.46e-07 | 1.29e+00 | 0.2243 |
| 29950 | SERTAD1 | S029 | Human | Liver | HCC | 1.88e-03 | 8.13e-01 | 0.2581 |
| 29950 | SERTAD1 | C04 | Human | Oral cavity | OSCC | 1.13e-28 | 1.90e+00 | 0.2633 |
| 29950 | SERTAD1 | C21 | Human | Oral cavity | OSCC | 6.24e-19 | 1.05e+00 | 0.2678 |
| 29950 | SERTAD1 | C30 | Human | Oral cavity | OSCC | 1.95e-34 | 2.15e+00 | 0.3055 |
| 29950 | SERTAD1 | C38 | Human | Oral cavity | OSCC | 2.12e-22 | 2.28e+00 | 0.172 |
| 29950 | SERTAD1 | C43 | Human | Oral cavity | OSCC | 5.32e-88 | 1.97e+00 | 0.1704 |
| 29950 | SERTAD1 | C46 | Human | Oral cavity | OSCC | 2.49e-33 | 1.84e+00 | 0.1673 |
| 29950 | SERTAD1 | C51 | Human | Oral cavity | OSCC | 4.76e-08 | 1.01e+00 | 0.2674 |
| 29950 | SERTAD1 | C57 | Human | Oral cavity | OSCC | 1.79e-32 | 1.61e+00 | 0.1679 |
| 29950 | SERTAD1 | C06 | Human | Oral cavity | OSCC | 1.37e-12 | 2.52e+00 | 0.2699 |
| 29950 | SERTAD1 | C07 | Human | Oral cavity | OSCC | 2.92e-09 | 1.52e+00 | 0.2491 |
| 29950 | SERTAD1 | C08 | Human | Oral cavity | OSCC | 1.39e-28 | 1.32e+00 | 0.1919 |
| 29950 | SERTAD1 | C09 | Human | Oral cavity | OSCC | 1.66e-63 | 2.05e+00 | 0.1431 |
| 29950 | SERTAD1 | LN22 | Human | Oral cavity | OSCC | 1.71e-17 | 3.34e+00 | 0.1733 |
| 29950 | SERTAD1 | LN38 | Human | Oral cavity | OSCC | 1.61e-06 | 1.76e+00 | 0.168 |
| 29950 | SERTAD1 | LN46 | Human | Oral cavity | OSCC | 3.33e-40 | 2.56e+00 | 0.1666 |
| 29950 | SERTAD1 | LP15 | Human | Oral cavity | LP | 5.72e-11 | 2.35e+00 | 0.2174 |
| 29950 | SERTAD1 | LP16 | Human | Oral cavity | LP | 4.42e-02 | 1.29e+00 | 0.1055 |
| Page: 1 2 3 4 5 6 7 8 9 10 |
| Tissue | Expression Dynamics | Abbreviation |
| Cervix |  | CC: Cervix cancer |
| HSIL_HPV: HPV-infected high-grade squamous intraepithelial lesions | ||
| N_HPV: HPV-infected normal cervix | ||
| Esophagus | 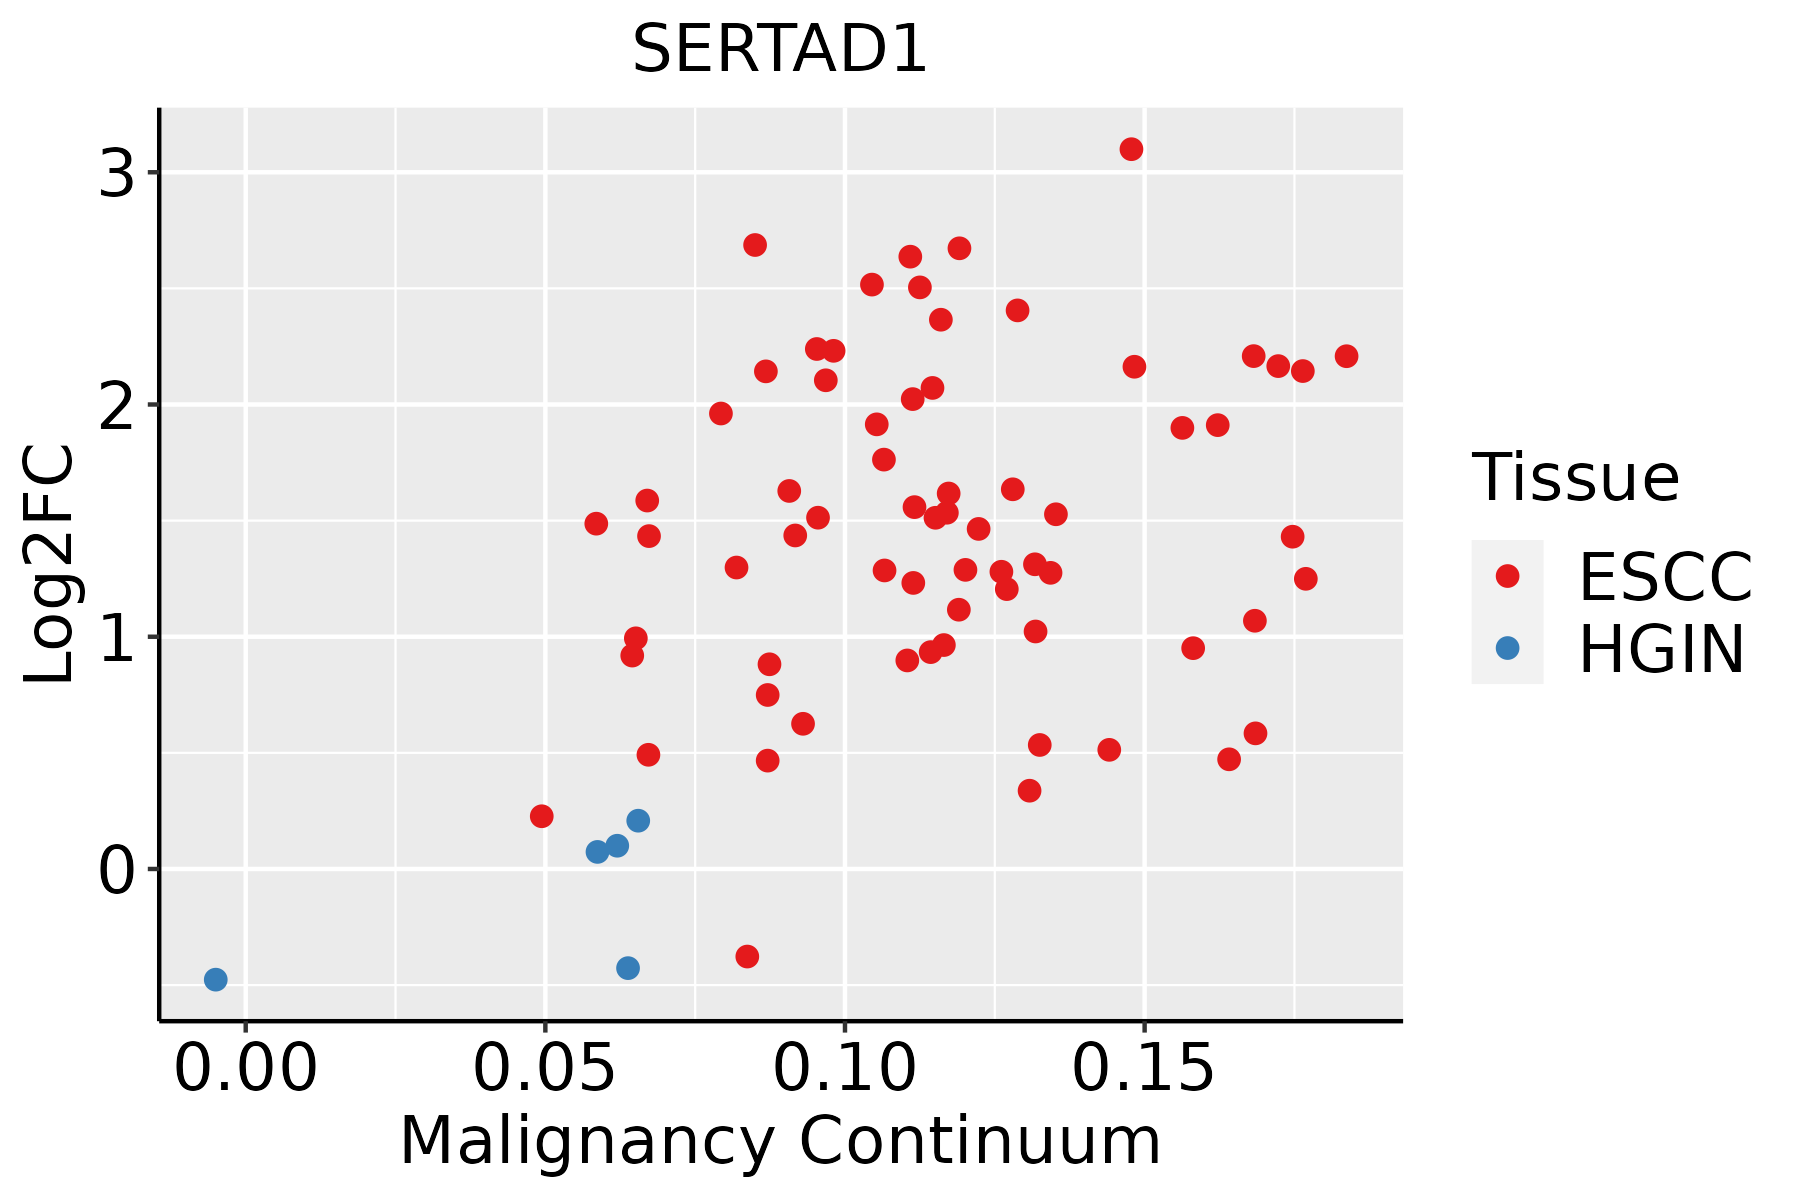 | ESCC: Esophageal squamous cell carcinoma |
| HGIN: High-grade intraepithelial neoplasias | ||
| LGIN: Low-grade intraepithelial neoplasias | ||
| GC | 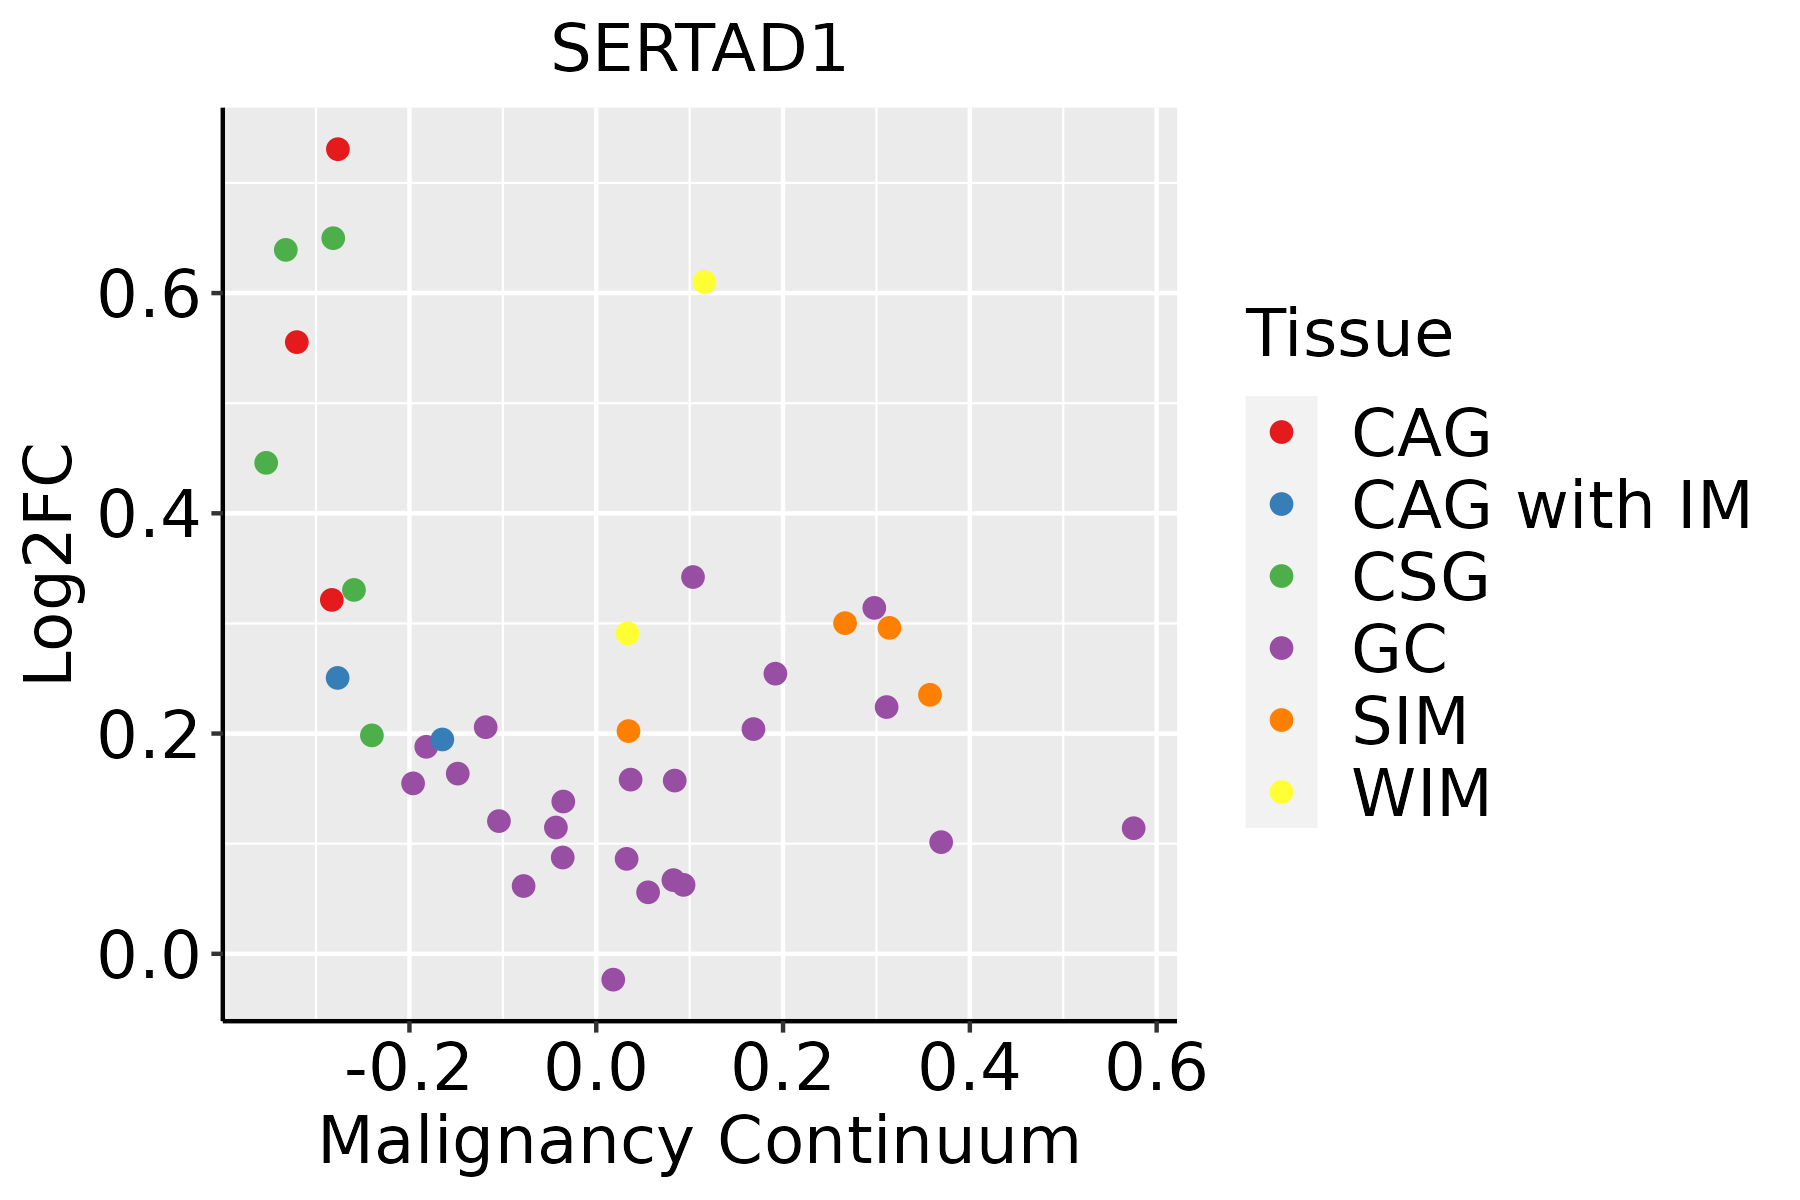 | CAG: Chronic atrophic gastritis |
| CAG with IM: Chronic atrophic gastritis with intestinal metaplasia | ||
| CSG: Chronic superficial gastritis | ||
| GC: Gastric cancer | ||
| SIM: Severe intestinal metaplasia | ||
| WIM: Wild intestinal metaplasia | ||
| Liver | 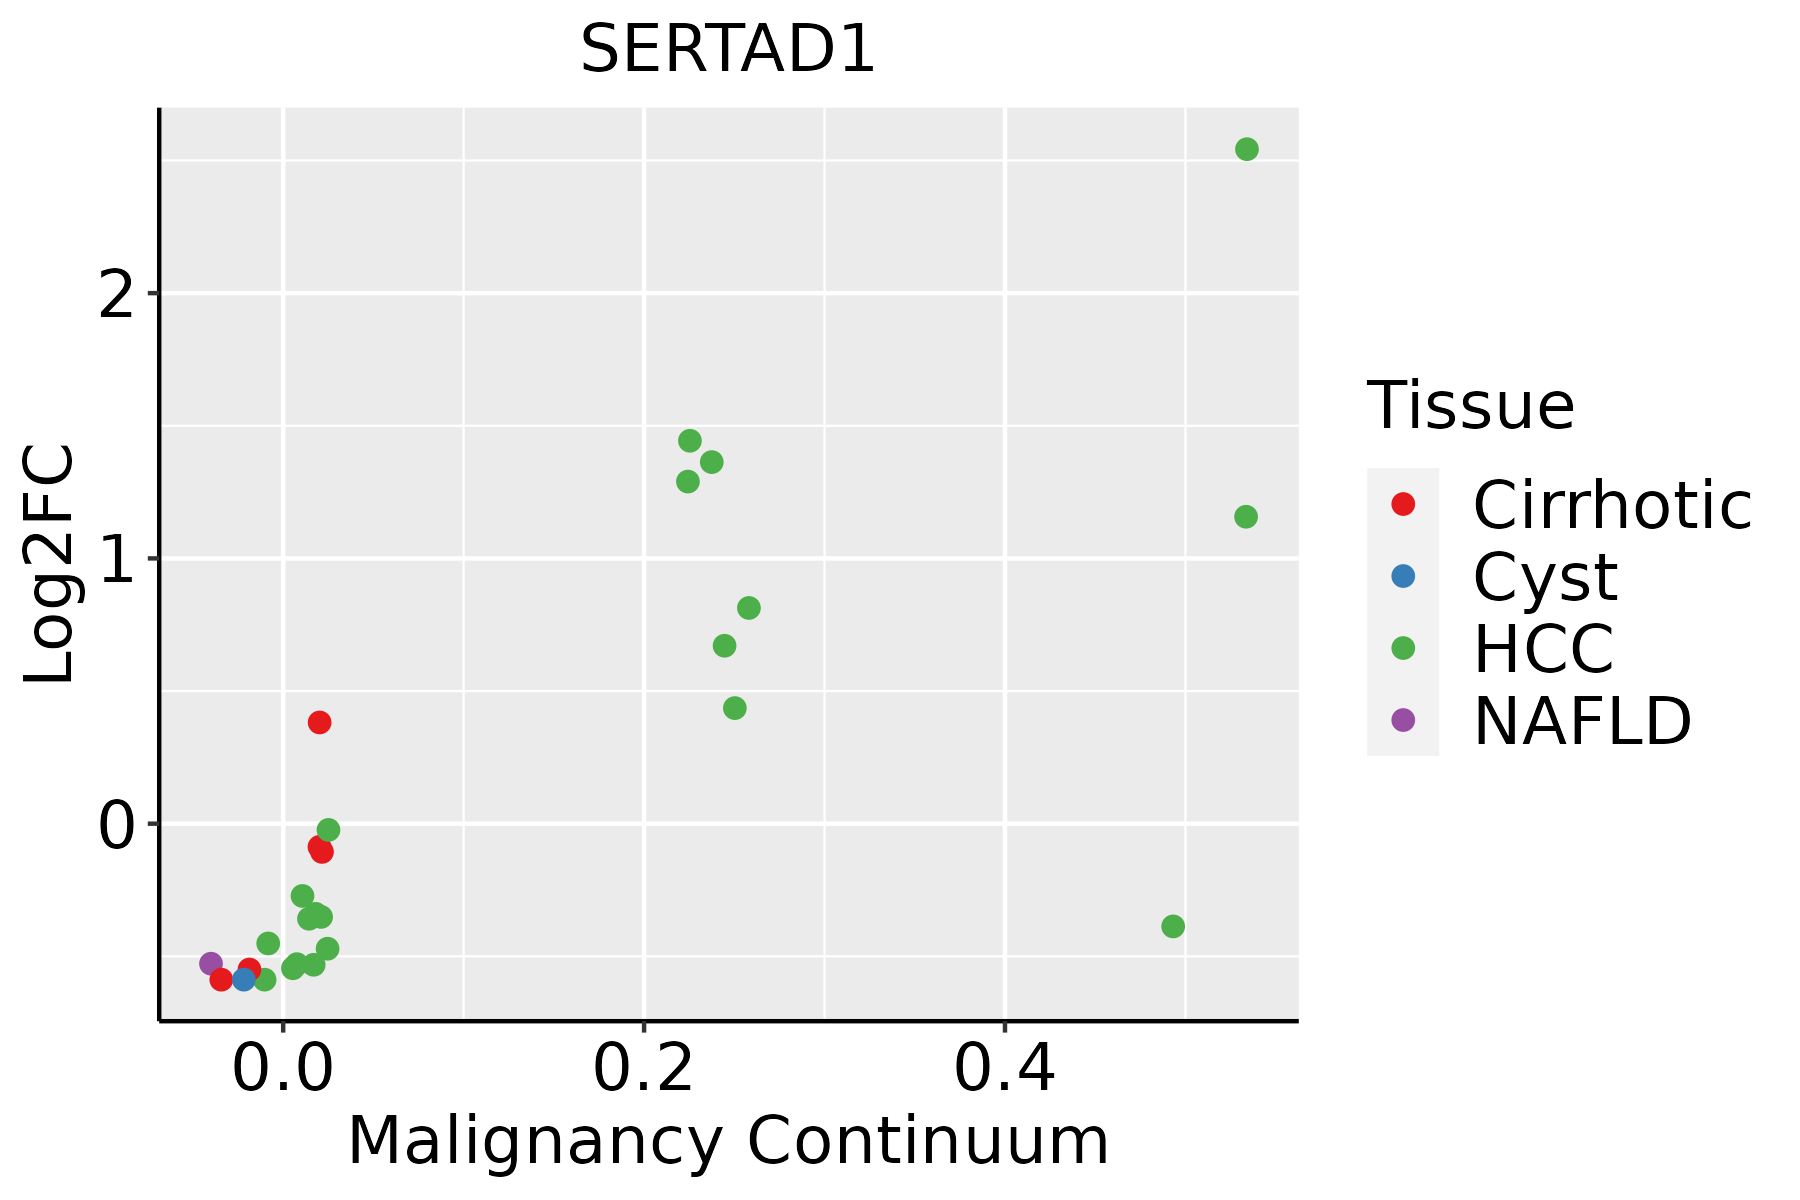 | HCC: Hepatocellular carcinoma |
| NAFLD: Non-alcoholic fatty liver disease | ||
| Oral Cavity | 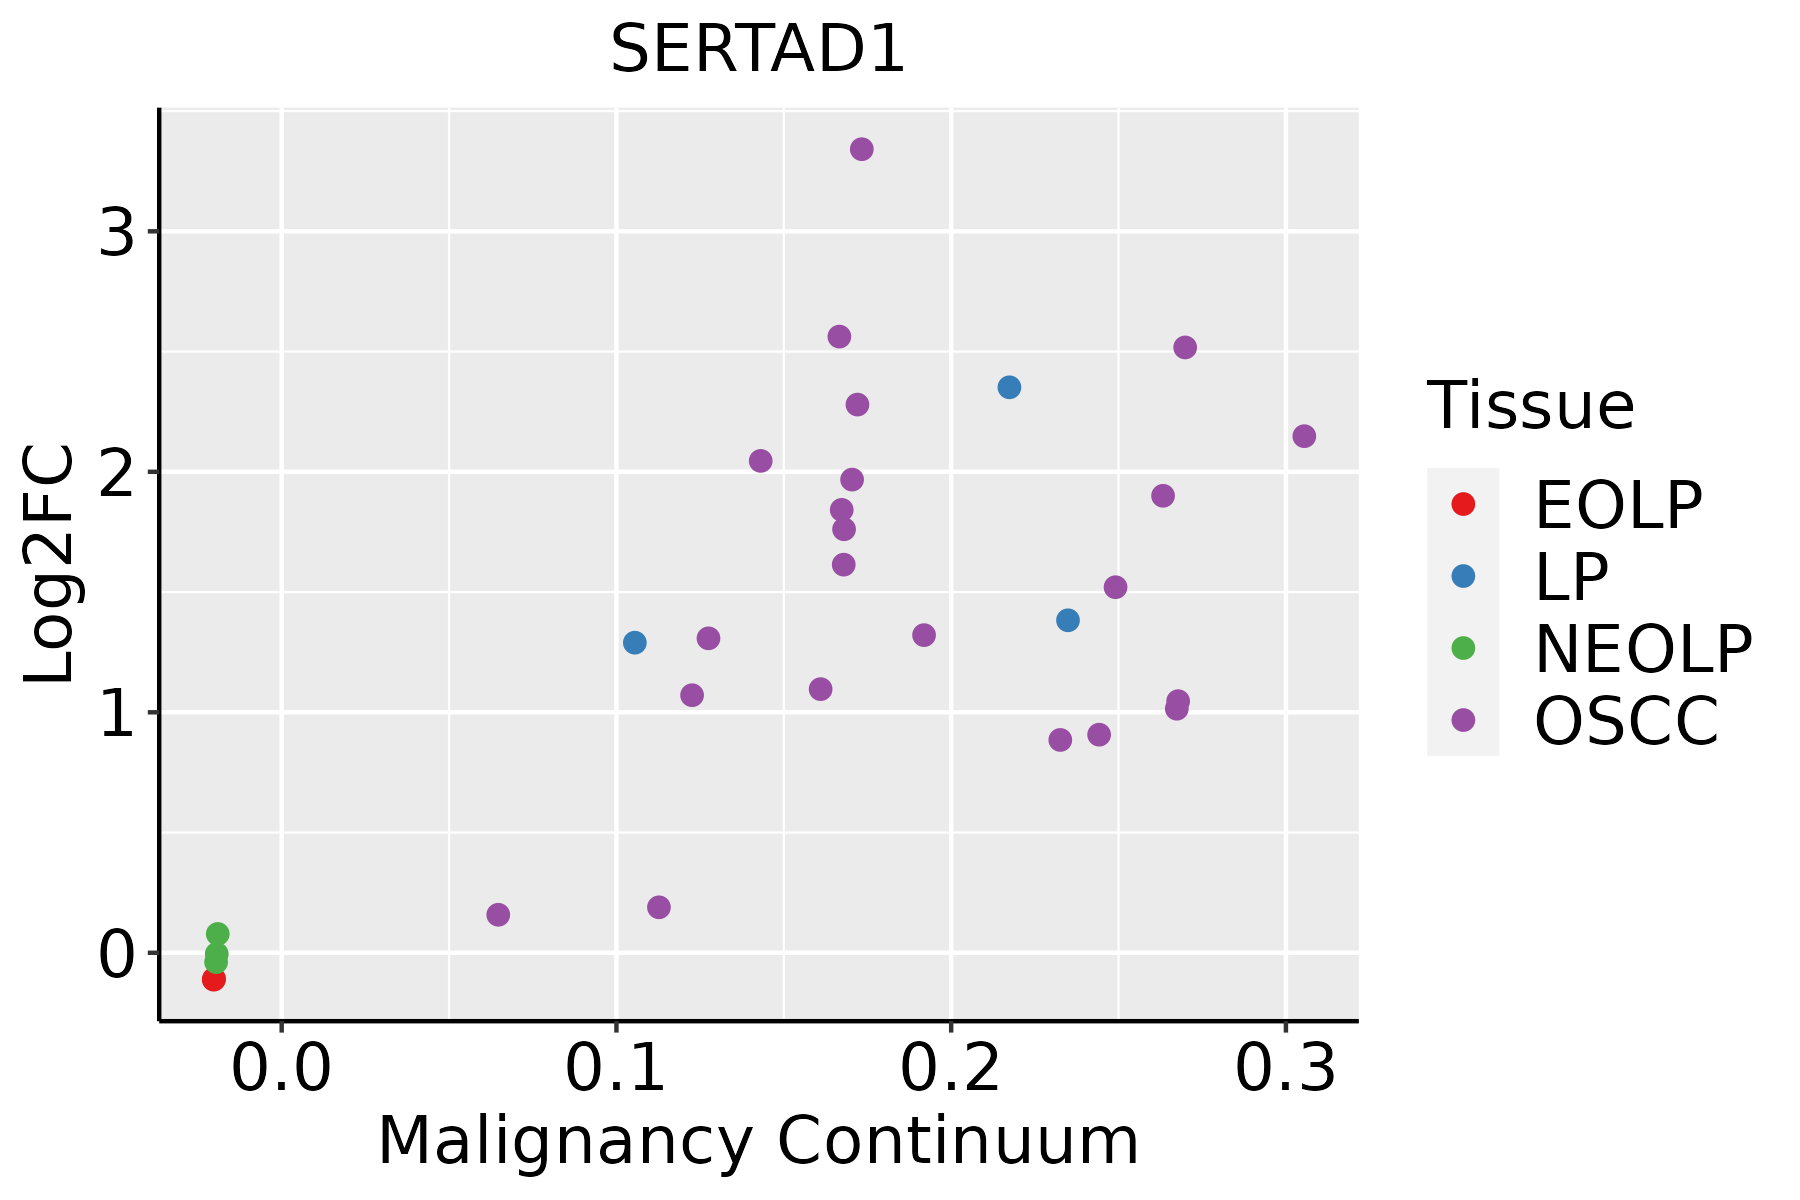 | EOLP: Erosive Oral lichen planus |
| LP: leukoplakia | ||
| NEOLP: Non-erosive oral lichen planus | ||
| OSCC: Oral squamous cell carcinoma | ||
| Prostate | 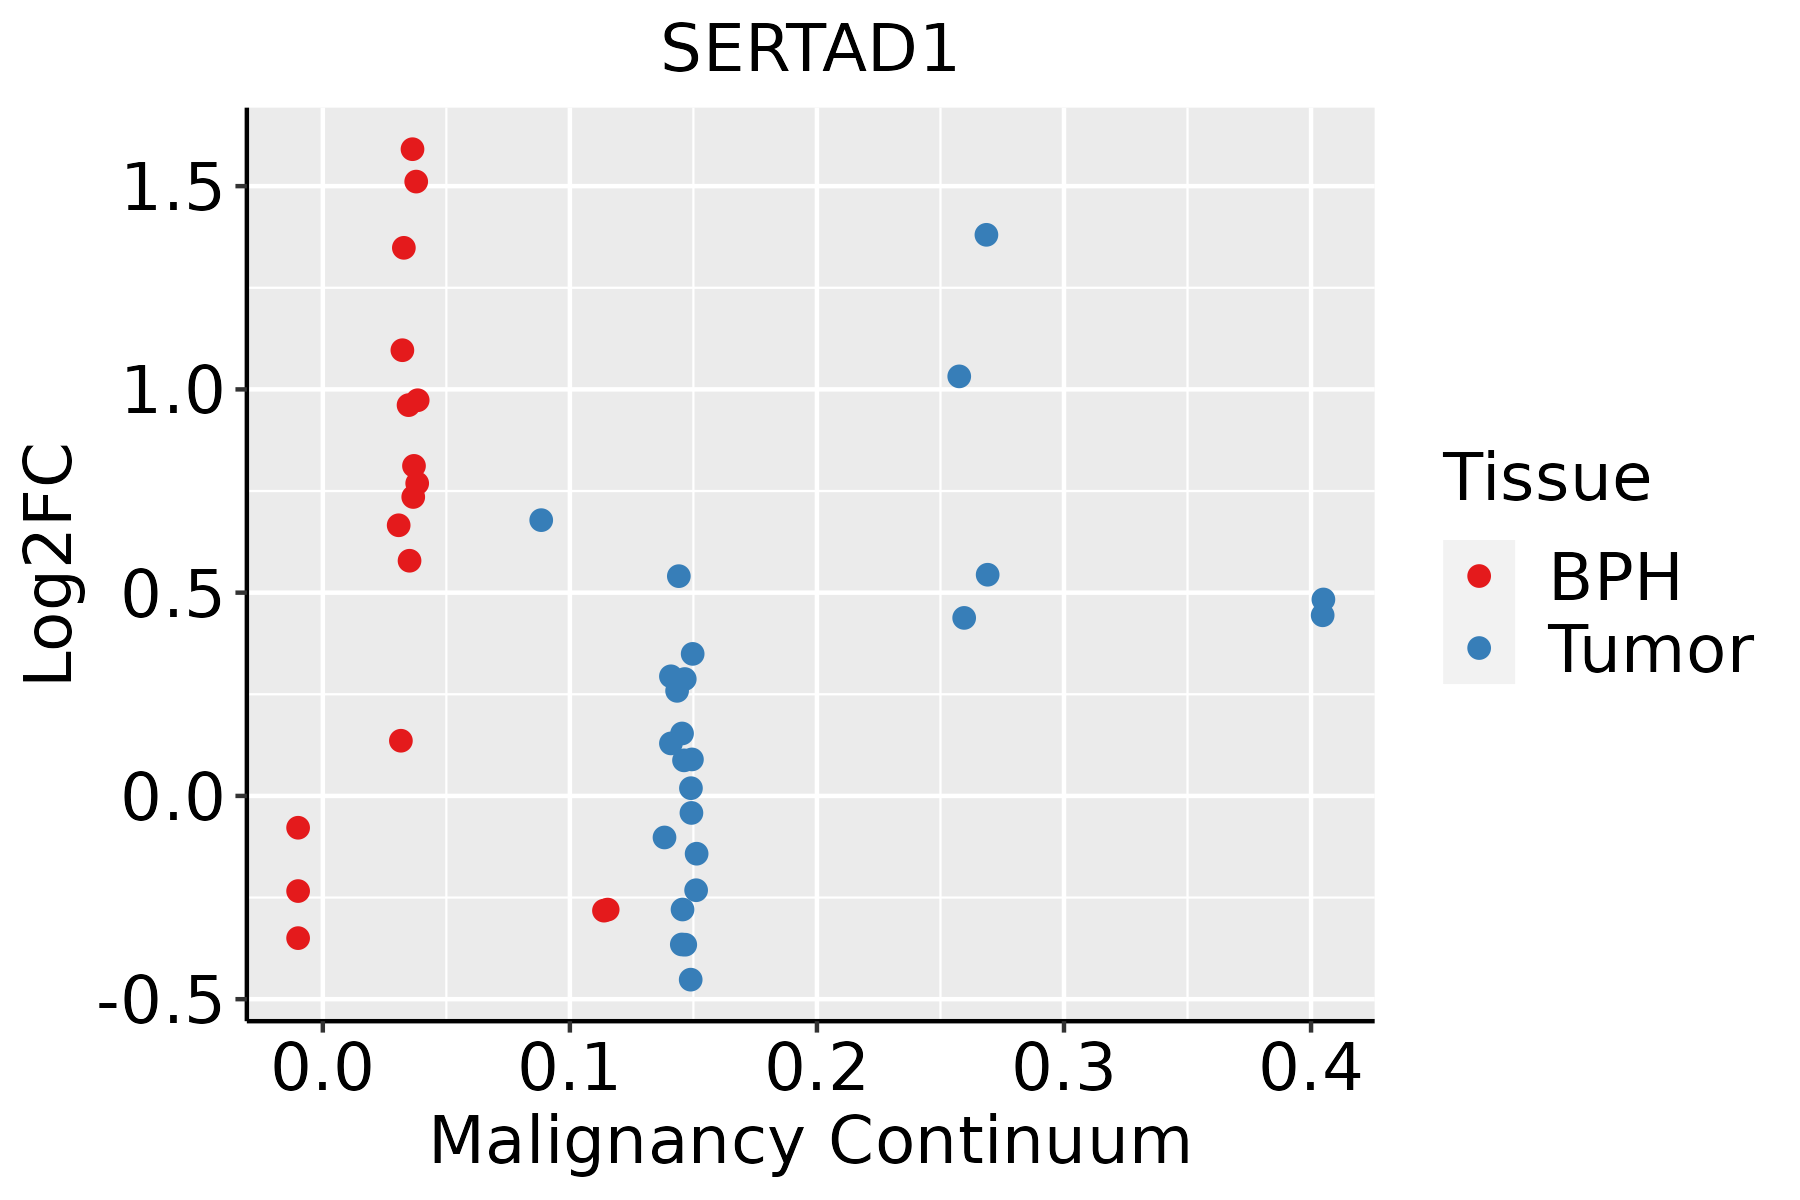 | BPH: Benign Prostatic Hyperplasia |
| Skin | 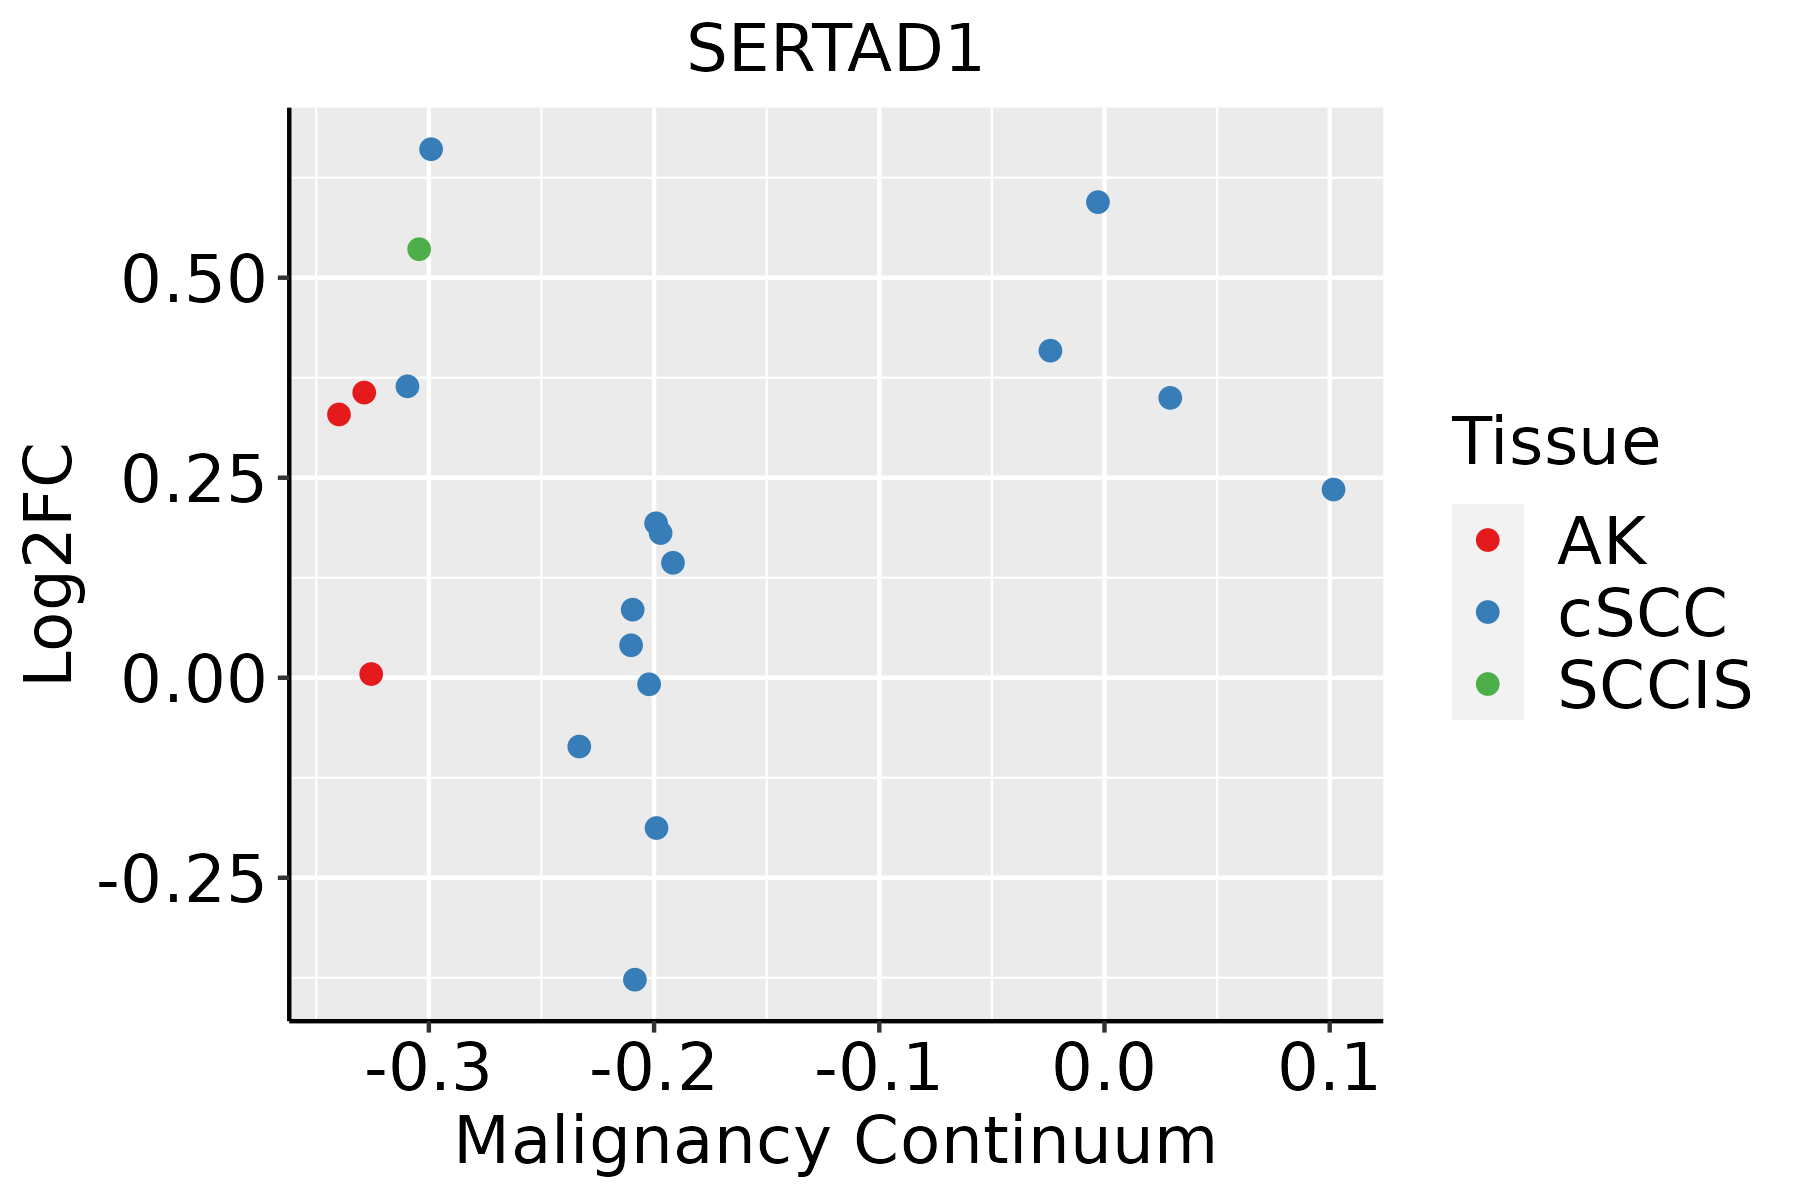 | AK: Actinic keratosis |
| cSCC: Cutaneous squamous cell carcinoma | ||
| SCCIS:squamous cell carcinoma in situ | ||
| Thyroid | 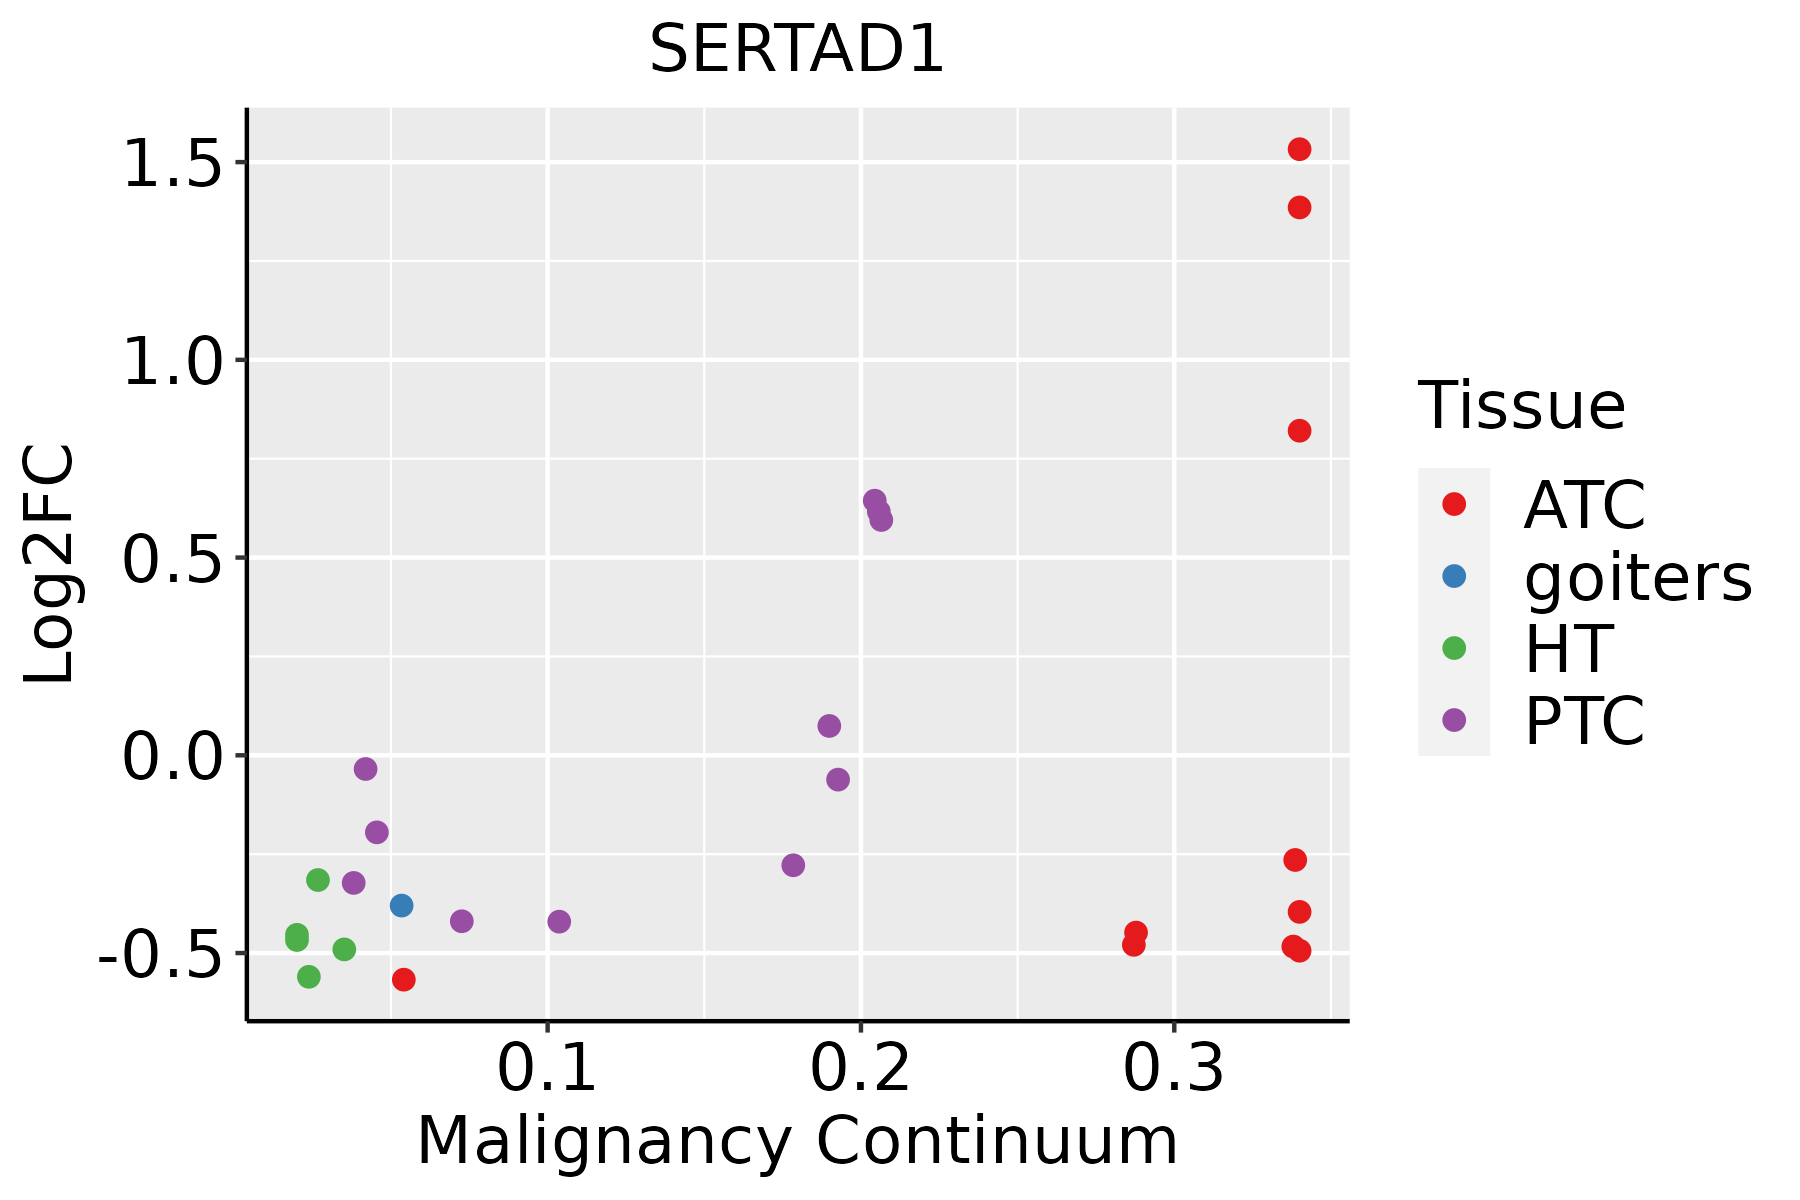 | ATC: Anaplastic thyroid cancer |
| HT: Hashimoto's thyroiditis | ||
| PTC: Papillary thyroid cancer |
| ∗log2FC in expression of this searched gene in stem-like cells from each diseased tissue sample relative to stem-like cells in normal samples in each tissue plotted against the malignancy continuum. Samples are colored based on if they are from different disease stage. |
Top |
Malignant transformation related pathway analysis |
| Find out the enriched GO biological processes and KEGG pathways involved in transition from healthy to precancer to cancer |
| Tissue | Disease Stage | Enriched GO biological Processes |
| Colorectum | AD |  |
| Colorectum | SER |  |
| Colorectum | MSS |  |
| Colorectum | MSI-H |  |
| Colorectum | FAP |  |
| ∗Top 15 enriched GO BP terms are showed in the bar plot of each disease state in each tissue. Each row represents a significant GO biological process which is colored according to the -log10(p.adjust). |
| Page: 1 2 3 4 5 6 7 8 9 |
| GO ID | Tissue | Disease Stage | Description | Gene Ratio | Bg Ratio | pvalue | p.adjust | Count |
| GO:00719007 | Cervix | CC | regulation of protein serine/threonine kinase activity | 75/2311 | 359/18723 | 2.76e-06 | 8.02e-05 | 75 |
| GO:00063684 | Cervix | CC | transcription elongation from RNA polymerase II promoter | 17/2311 | 69/18723 | 3.65e-03 | 2.33e-02 | 17 |
| GO:00063545 | Cervix | CC | DNA-templated transcription, elongation | 20/2311 | 91/18723 | 6.88e-03 | 3.74e-02 | 20 |
| GO:000635414 | Esophagus | ESCC | DNA-templated transcription, elongation | 76/8552 | 91/18723 | 8.35e-14 | 4.11e-12 | 76 |
| GO:007190016 | Esophagus | ESCC | regulation of protein serine/threonine kinase activity | 227/8552 | 359/18723 | 1.12e-11 | 4.10e-10 | 227 |
| GO:000636814 | Esophagus | ESCC | transcription elongation from RNA polymerase II promoter | 56/8552 | 69/18723 | 1.40e-09 | 3.30e-08 | 56 |
| GO:00400295 | Esophagus | ESCC | regulation of gene expression, epigenetic | 74/8552 | 105/18723 | 2.24e-07 | 3.42e-06 | 74 |
| GO:19040294 | Esophagus | ESCC | regulation of cyclin-dependent protein kinase activity | 69/8552 | 98/18723 | 6.04e-07 | 7.91e-06 | 69 |
| GO:00000794 | Esophagus | ESCC | regulation of cyclin-dependent protein serine/threonine kinase activity | 66/8552 | 94/18723 | 1.24e-06 | 1.53e-05 | 66 |
| GO:00480962 | Esophagus | ESCC | chromatin-mediated maintenance of transcription | 11/8552 | 11/18723 | 1.80e-04 | 1.16e-03 | 11 |
| GO:0045815 | Esophagus | ESCC | positive regulation of gene expression, epigenetic | 13/8552 | 17/18723 | 1.00e-02 | 3.42e-02 | 13 |
| GO:00063544 | Liver | Cirrhotic | DNA-templated transcription, elongation | 35/4634 | 91/18723 | 2.56e-03 | 1.53e-02 | 35 |
| GO:00063683 | Liver | Cirrhotic | transcription elongation from RNA polymerase II promoter | 28/4634 | 69/18723 | 2.70e-03 | 1.58e-02 | 28 |
| GO:007190011 | Liver | Cirrhotic | regulation of protein serine/threonine kinase activity | 110/4634 | 359/18723 | 6.19e-03 | 3.08e-02 | 110 |
| GO:000635411 | Liver | HCC | DNA-templated transcription, elongation | 64/7958 | 91/18723 | 7.00e-08 | 1.44e-06 | 64 |
| GO:000636811 | Liver | HCC | transcription elongation from RNA polymerase II promoter | 50/7958 | 69/18723 | 4.32e-07 | 7.22e-06 | 50 |
| GO:007190021 | Liver | HCC | regulation of protein serine/threonine kinase activity | 189/7958 | 359/18723 | 5.97e-05 | 5.47e-04 | 189 |
| GO:0040029 | Liver | HCC | regulation of gene expression, epigenetic | 61/7958 | 105/18723 | 9.02e-04 | 5.31e-03 | 61 |
| GO:0000079 | Liver | HCC | regulation of cyclin-dependent protein serine/threonine kinase activity | 55/7958 | 94/18723 | 1.25e-03 | 6.91e-03 | 55 |
| GO:1904029 | Liver | HCC | regulation of cyclin-dependent protein kinase activity | 57/7958 | 98/18723 | 1.26e-03 | 6.92e-03 | 57 |
| Page: 1 2 3 4 |
| Pathway ID | Tissue | Disease Stage | Description | Gene Ratio | Bg Ratio | pvalue | p.adjust | qvalue | Count |
| Page: 1 |
Top |
Cell-cell communication analysis |
| Identification of potential cell-cell interactions between two cell types and their ligand-receptor pairs for different disease states |
| Ligand | Receptor | LRpair | Pathway | Tissue | Disease Stage |
| Page: 1 |
Top |
Single-cell gene regulatory network inference analysis |
| Find out the significant the regulons (TFs) and the target genes of each regulon across cell types for different disease states |
| TF | Cell Type | Tissue | Disease Stage | Target Gene | RSS | Regulon Activity |
| ∗The dot plots of a searched regulon are shown for all cell subpopulations in each disease state of each tissue based on the regulon specific score inferred using pySCENIC and by calculating the average expression. |
| Page: 1 |
Top |
Somatic mutation of malignant transformation related genes |
| Annotation of somatic variants for genes involved in malignant transformation |
| Hugo Symbol | Variant Class | Variant Classification | dbSNP RS | HGVSc | HGVSp | HGVSp Short | SWISSPROT | BIOTYPE | SIFT | PolyPhen | Tumor Sample Barcode | Tissue | Histology | Sex | Age | Stage | Therapy Types | Drugs | Outcome |
| SERTAD1 | SNV | Missense_Mutation | c.572N>T | p.Ser191Phe | p.S191F | Q9UHV2 | protein_coding | deleterious(0.02) | benign(0.007) | TCGA-PE-A5DE-01 | Breast | breast invasive carcinoma | Female | <65 | I/II | Chemotherapy | taxotere | CR | |
| SERTAD1 | SNV | Missense_Mutation | rs768979696 | c.226N>T | p.Arg76Cys | p.R76C | Q9UHV2 | protein_coding | deleterious(0) | probably_damaging(0.993) | TCGA-MA-AA42-01 | Cervix | cervical & endocervical cancer | Female | >=65 | I/II | Unknown | Unknown | SD |
| SERTAD1 | SNV | Missense_Mutation | c.550N>C | p.Asn184His | p.N184H | Q9UHV2 | protein_coding | deleterious(0.04) | benign(0.001) | TCGA-A6-3809-01 | Colorectum | colon adenocarcinoma | Female | >=65 | I/II | Unknown | Unknown | SD | |
| SERTAD1 | SNV | Missense_Mutation | rs200028938 | c.640N>A | p.Glu214Lys | p.E214K | Q9UHV2 | protein_coding | deleterious(0.01) | benign(0.147) | TCGA-AZ-4315-01 | Colorectum | colon adenocarcinoma | Male | <65 | I/II | Unknown | Unknown | SD |
| SERTAD1 | SNV | Missense_Mutation | novel | c.665N>C | p.Leu222Pro | p.L222P | Q9UHV2 | protein_coding | deleterious(0) | probably_damaging(0.986) | TCGA-A5-A1OF-01 | Endometrium | uterine corpus endometrioid carcinoma | Female | <65 | I/II | Unknown | Unknown | SD |
| SERTAD1 | SNV | Missense_Mutation | c.53N>A | p.Pro18His | p.P18H | Q9UHV2 | protein_coding | tolerated(0.1) | benign(0.037) | TCGA-AP-A051-01 | Endometrium | uterine corpus endometrioid carcinoma | Female | >=65 | I/II | Unknown | Unknown | SD | |
| SERTAD1 | SNV | Missense_Mutation | novel | c.194G>A | p.Arg65Gln | p.R65Q | Q9UHV2 | protein_coding | deleterious(0.03) | probably_damaging(0.999) | TCGA-B5-A3FC-01 | Endometrium | uterine corpus endometrioid carcinoma | Female | <65 | I/II | Unknown | Unknown | SD |
| SERTAD1 | SNV | Missense_Mutation | c.629T>C | p.Leu210Pro | p.L210P | Q9UHV2 | protein_coding | tolerated(0.07) | probably_damaging(0.98) | TCGA-BS-A0TD-01 | Endometrium | uterine corpus endometrioid carcinoma | Female | >=65 | I/II | Unknown | Unknown | SD | |
| SERTAD1 | SNV | Missense_Mutation | c.481N>T | p.Ala161Ser | p.A161S | Q9UHV2 | protein_coding | tolerated(0.4) | possibly_damaging(0.868) | TCGA-D1-A103-01 | Endometrium | uterine corpus endometrioid carcinoma | Female | >=65 | I/II | Unknown | Unknown | SD | |
| SERTAD1 | SNV | Missense_Mutation | rs768979696 | c.226N>T | p.Arg76Cys | p.R76C | Q9UHV2 | protein_coding | deleterious(0) | probably_damaging(0.993) | TCGA-DF-A2KU-01 | Endometrium | uterine corpus endometrioid carcinoma | Female | Unknown | I/II | Unknown | Unknown | SD |
| Page: 1 2 |
Top |
Related drugs of malignant transformation related genes |
| Identification of chemicals and drugs interact with genes involved in malignant transfromation |
| (DGIdb 4.0) |
| Entrez ID | Symbol | Category | Interaction Types | Drug Claim Name | Drug Name | PMIDs |
| Page: 1 |

Copyright 2023-Present -The University of Texas Health Science Center at Houston |