
|
|||||
|
 | |
| |
| |
| |
| |
| |
|
Gene: SERINC1 |
Gene summary for SERINC1 |
| Gene information | Species | Human | Gene symbol | SERINC1 | Gene ID | 57515 |
| Gene name | serine incorporator 1 | |
| Gene Alias | TDE1L | |
| Cytomap | 6q22.31 | |
| Gene Type | protein-coding | GO ID | GO:0006575 | UniProtAcc | Q9NRX5 |
Top |
Malignant transformation analysis |
| Identification of the aberrant gene expression in precancerous and cancerous lesions by comparing the gene expression of stem-like cells in diseased tissues with normal stem cells |
| Entrez ID | Symbol | Replicates | Species | Organ | Tissue | Adj P-value | Log2FC | Malignancy |
| 57515 | SERINC1 | C04 | Human | Oral cavity | OSCC | 2.00e-14 | 1.01e+00 | 0.2633 |
| 57515 | SERINC1 | C21 | Human | Oral cavity | OSCC | 4.88e-39 | 1.25e+00 | 0.2678 |
| 57515 | SERINC1 | C30 | Human | Oral cavity | OSCC | 2.26e-44 | 2.58e+00 | 0.3055 |
| 57515 | SERINC1 | C43 | Human | Oral cavity | OSCC | 2.07e-05 | 2.56e-01 | 0.1704 |
| 57515 | SERINC1 | C46 | Human | Oral cavity | OSCC | 9.23e-10 | 1.51e-01 | 0.1673 |
| 57515 | SERINC1 | C51 | Human | Oral cavity | OSCC | 3.75e-21 | 1.04e+00 | 0.2674 |
| 57515 | SERINC1 | C57 | Human | Oral cavity | OSCC | 1.14e-13 | 6.70e-01 | 0.1679 |
| 57515 | SERINC1 | C06 | Human | Oral cavity | OSCC | 7.64e-04 | 1.08e+00 | 0.2699 |
| 57515 | SERINC1 | C08 | Human | Oral cavity | OSCC | 1.30e-08 | 3.60e-01 | 0.1919 |
| 57515 | SERINC1 | C09 | Human | Oral cavity | OSCC | 4.04e-04 | 4.42e-01 | 0.1431 |
| 57515 | SERINC1 | SYSMH1 | Human | Oral cavity | OSCC | 1.83e-14 | 5.69e-01 | 0.1127 |
| 57515 | SERINC1 | SYSMH2 | Human | Oral cavity | OSCC | 7.91e-05 | 4.29e-01 | 0.2326 |
| 57515 | SERINC1 | SYSMH3 | Human | Oral cavity | OSCC | 6.23e-09 | 4.95e-01 | 0.2442 |
| 57515 | SERINC1 | GSM5252135_BPH511PrPUr_Fcol_3GEX | Human | Prostate | BPH | 5.61e-03 | 4.88e-01 | -0.1833 |
| 57515 | SERINC1 | 047563_1562-all-cells | Human | Prostate | BPH | 4.32e-11 | 2.79e-02 | 0.0791 |
| 57515 | SERINC1 | Dong_P1 | Human | Prostate | Tumor | 1.13e-17 | 4.93e-02 | 0.035 |
| 57515 | SERINC1 | Dong_P3 | Human | Prostate | Tumor | 3.78e-09 | 4.01e-02 | 0.0278 |
| 57515 | SERINC1 | Dong_P4 | Human | Prostate | Tumor | 7.07e-05 | 5.48e-02 | 0.0292 |
| 57515 | SERINC1 | Dong_P5 | Human | Prostate | Tumor | 3.64e-29 | -4.48e-02 | 0.053 |
| 57515 | SERINC1 | GSM5353216_PA_PB1A_Pool_1_3_S50_L002 | Human | Prostate | Tumor | 1.06e-06 | 6.39e-01 | 0.159 |
| Page: 1 2 3 4 5 6 7 |
| Tissue | Expression Dynamics | Abbreviation |
| Esophagus | 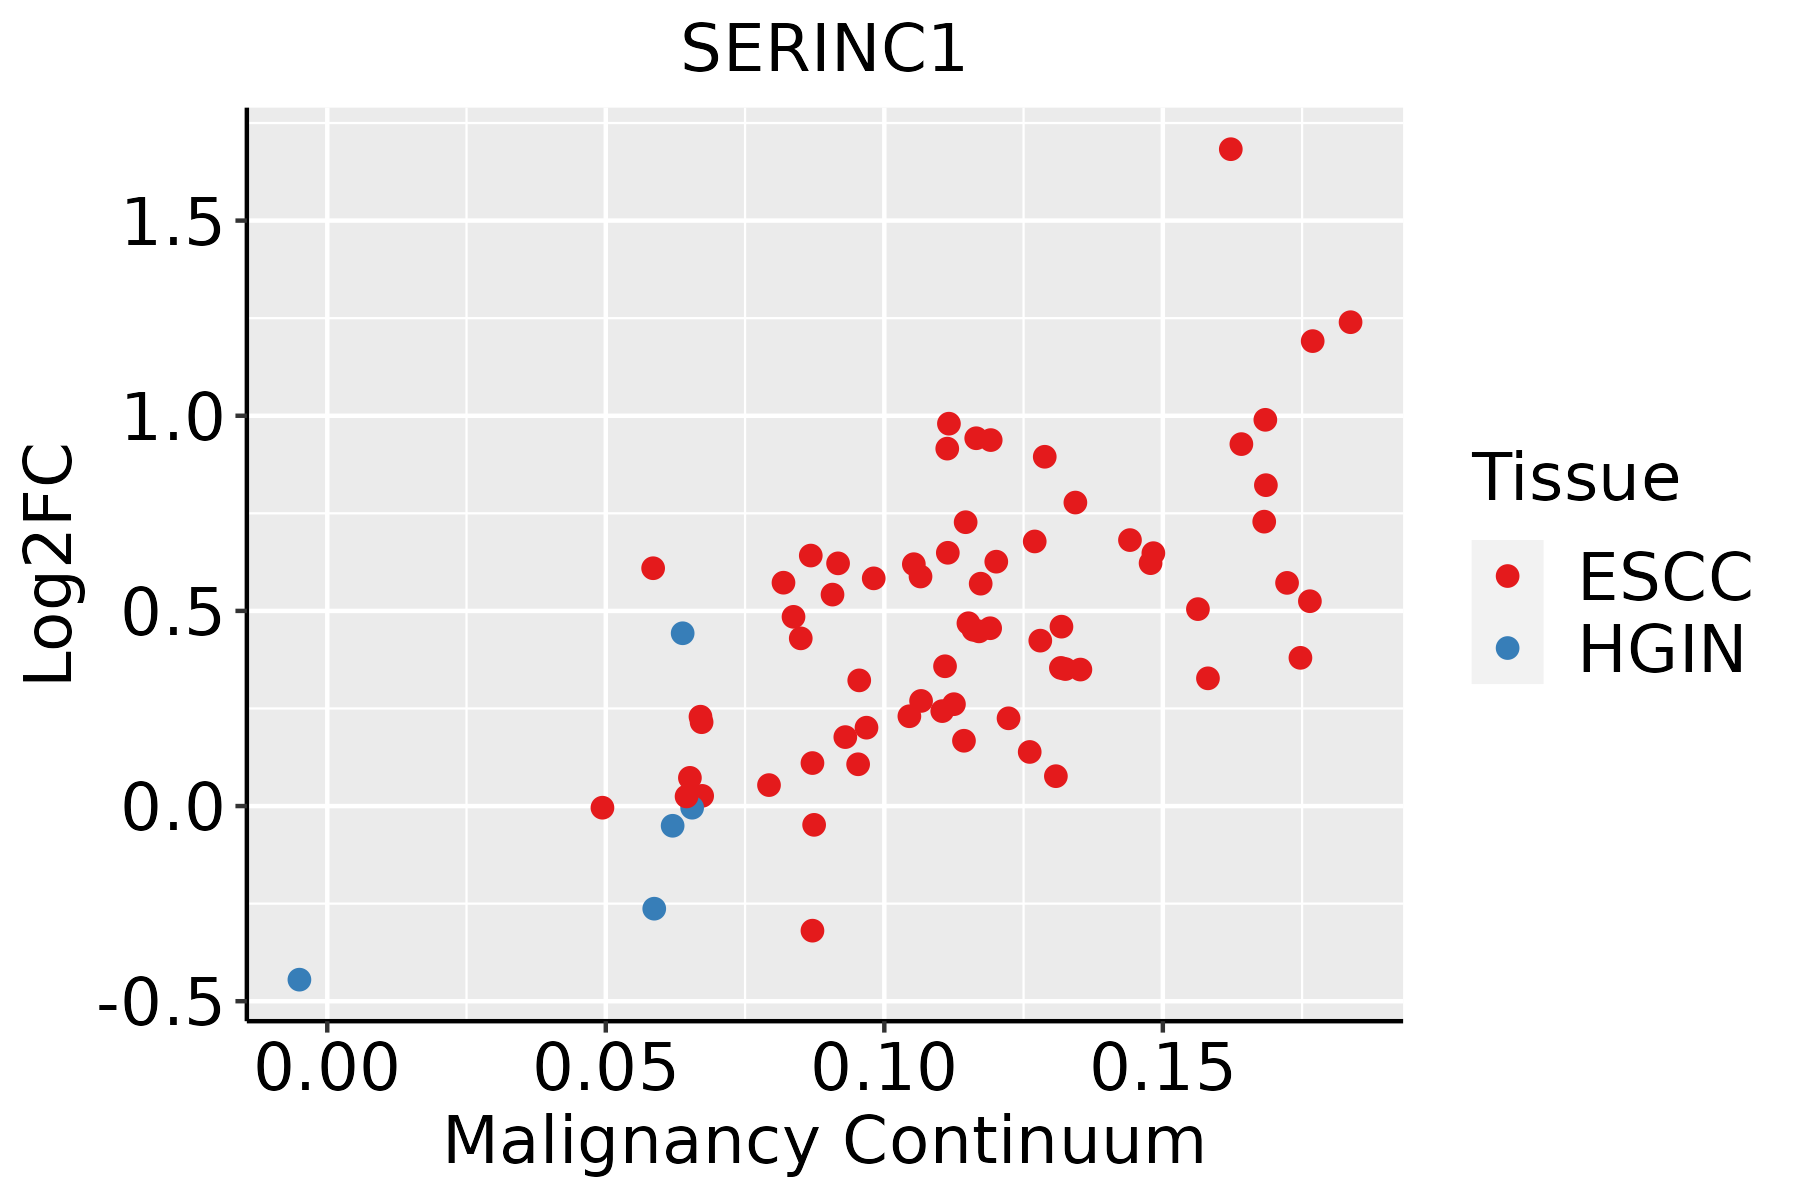 | ESCC: Esophageal squamous cell carcinoma |
| HGIN: High-grade intraepithelial neoplasias | ||
| LGIN: Low-grade intraepithelial neoplasias | ||
| Liver | 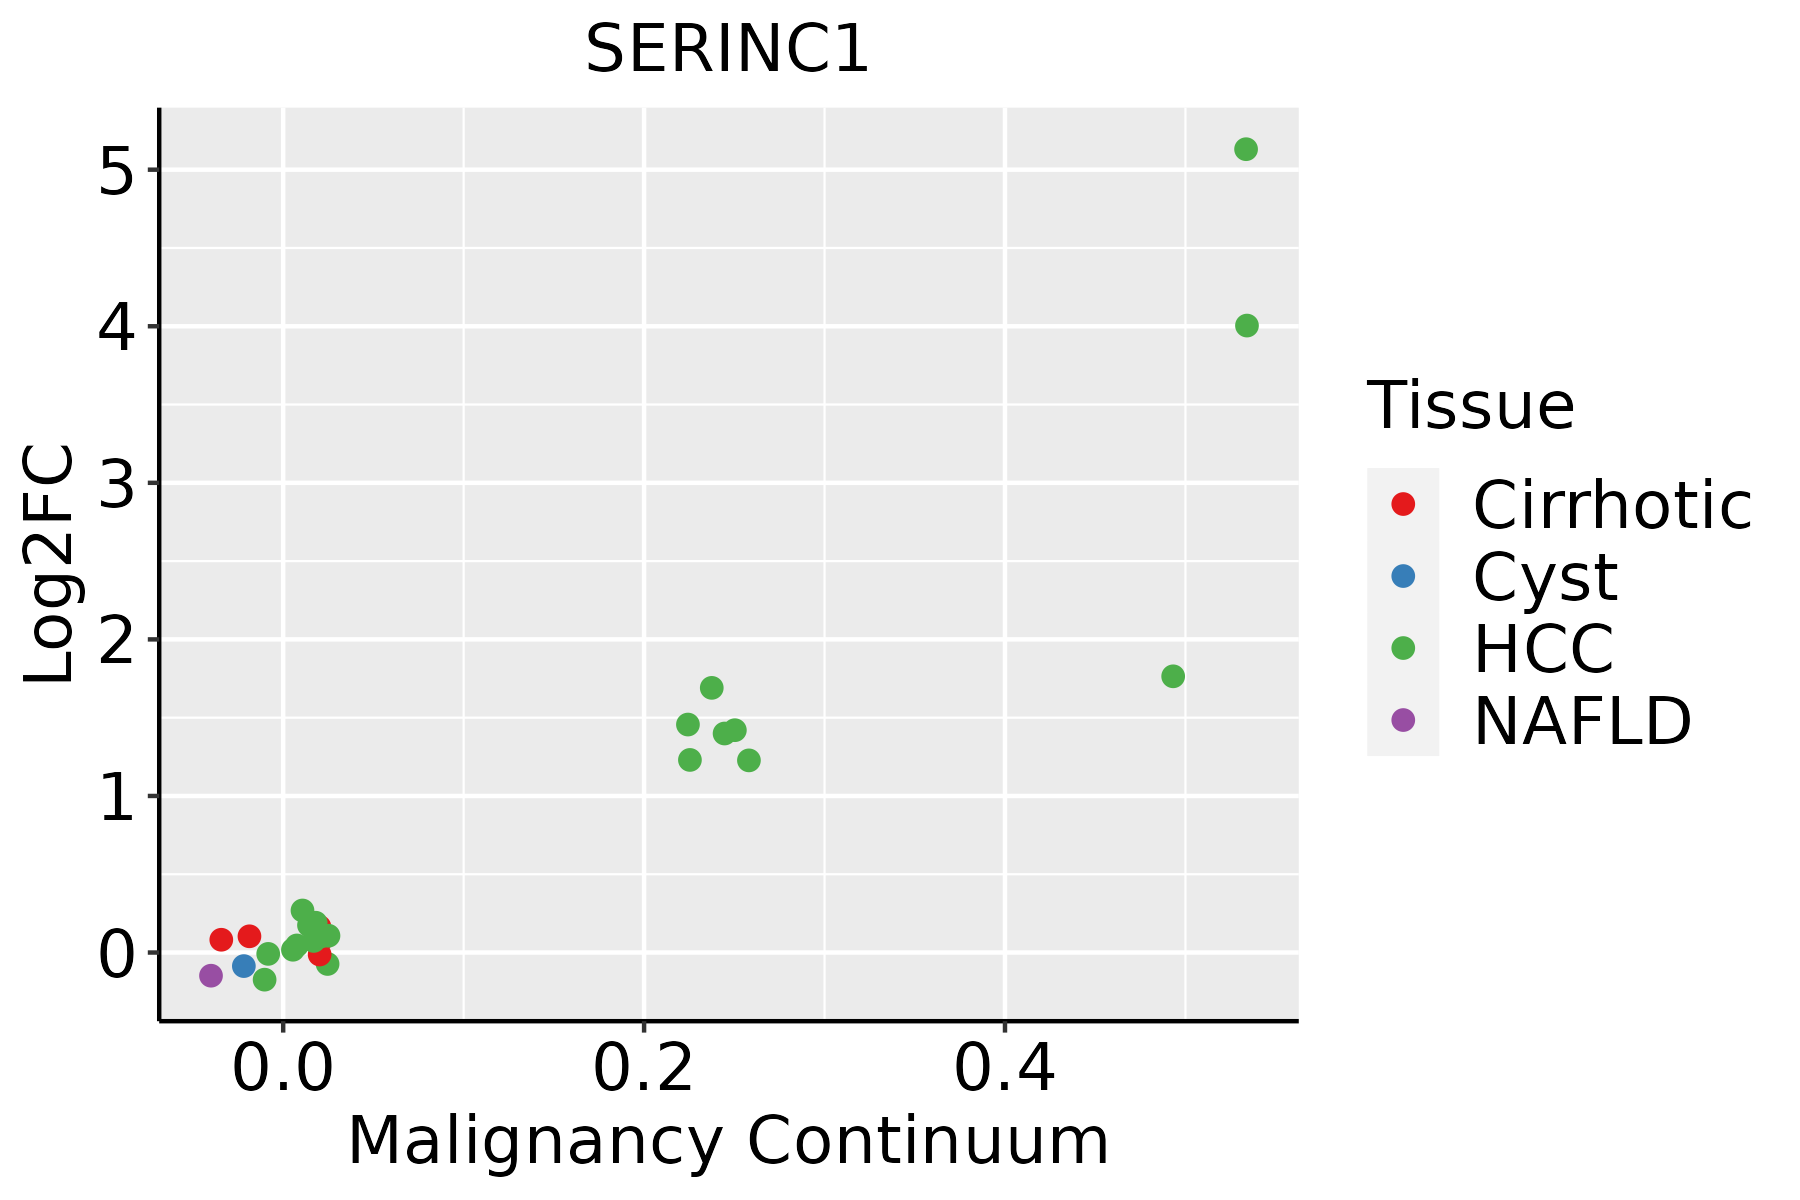 | HCC: Hepatocellular carcinoma |
| NAFLD: Non-alcoholic fatty liver disease | ||
| Oral Cavity | 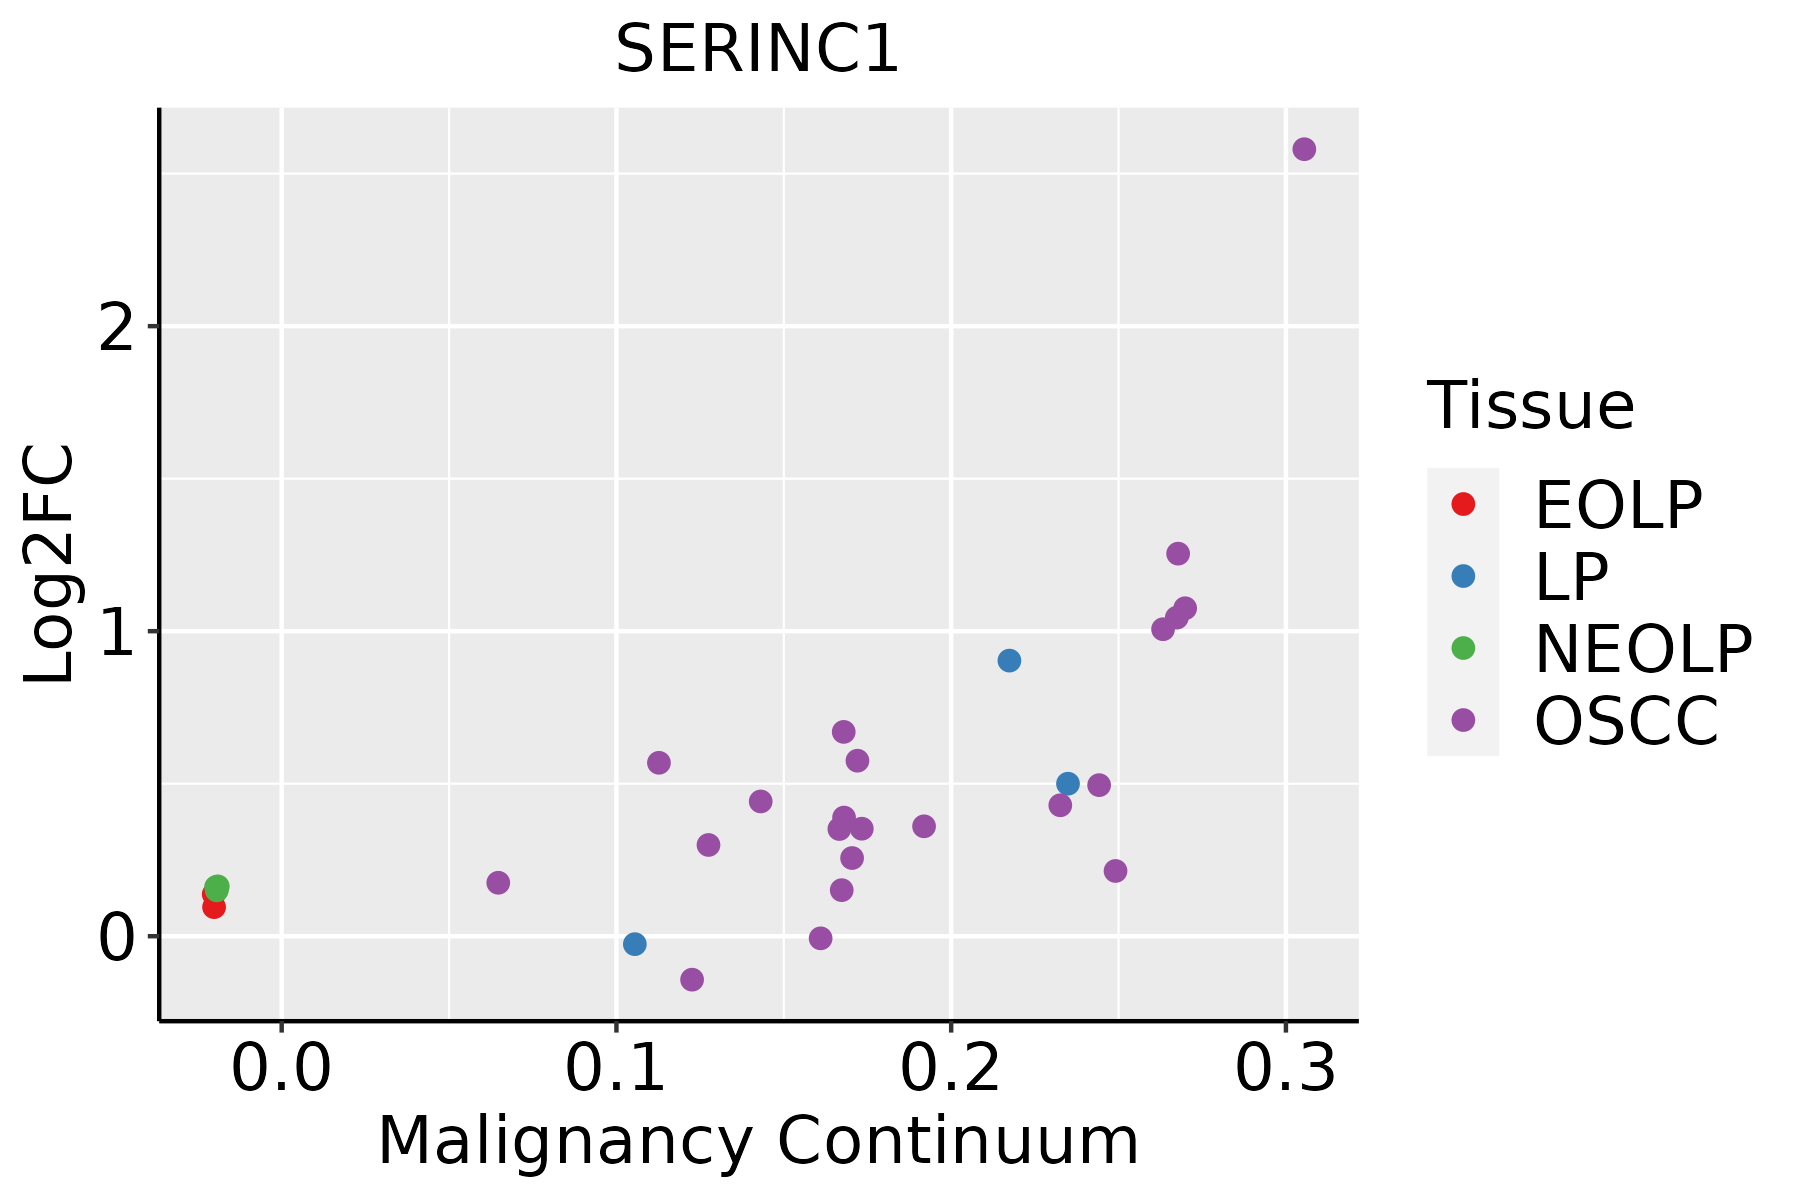 | EOLP: Erosive Oral lichen planus |
| LP: leukoplakia | ||
| NEOLP: Non-erosive oral lichen planus | ||
| OSCC: Oral squamous cell carcinoma | ||
| Prostate | 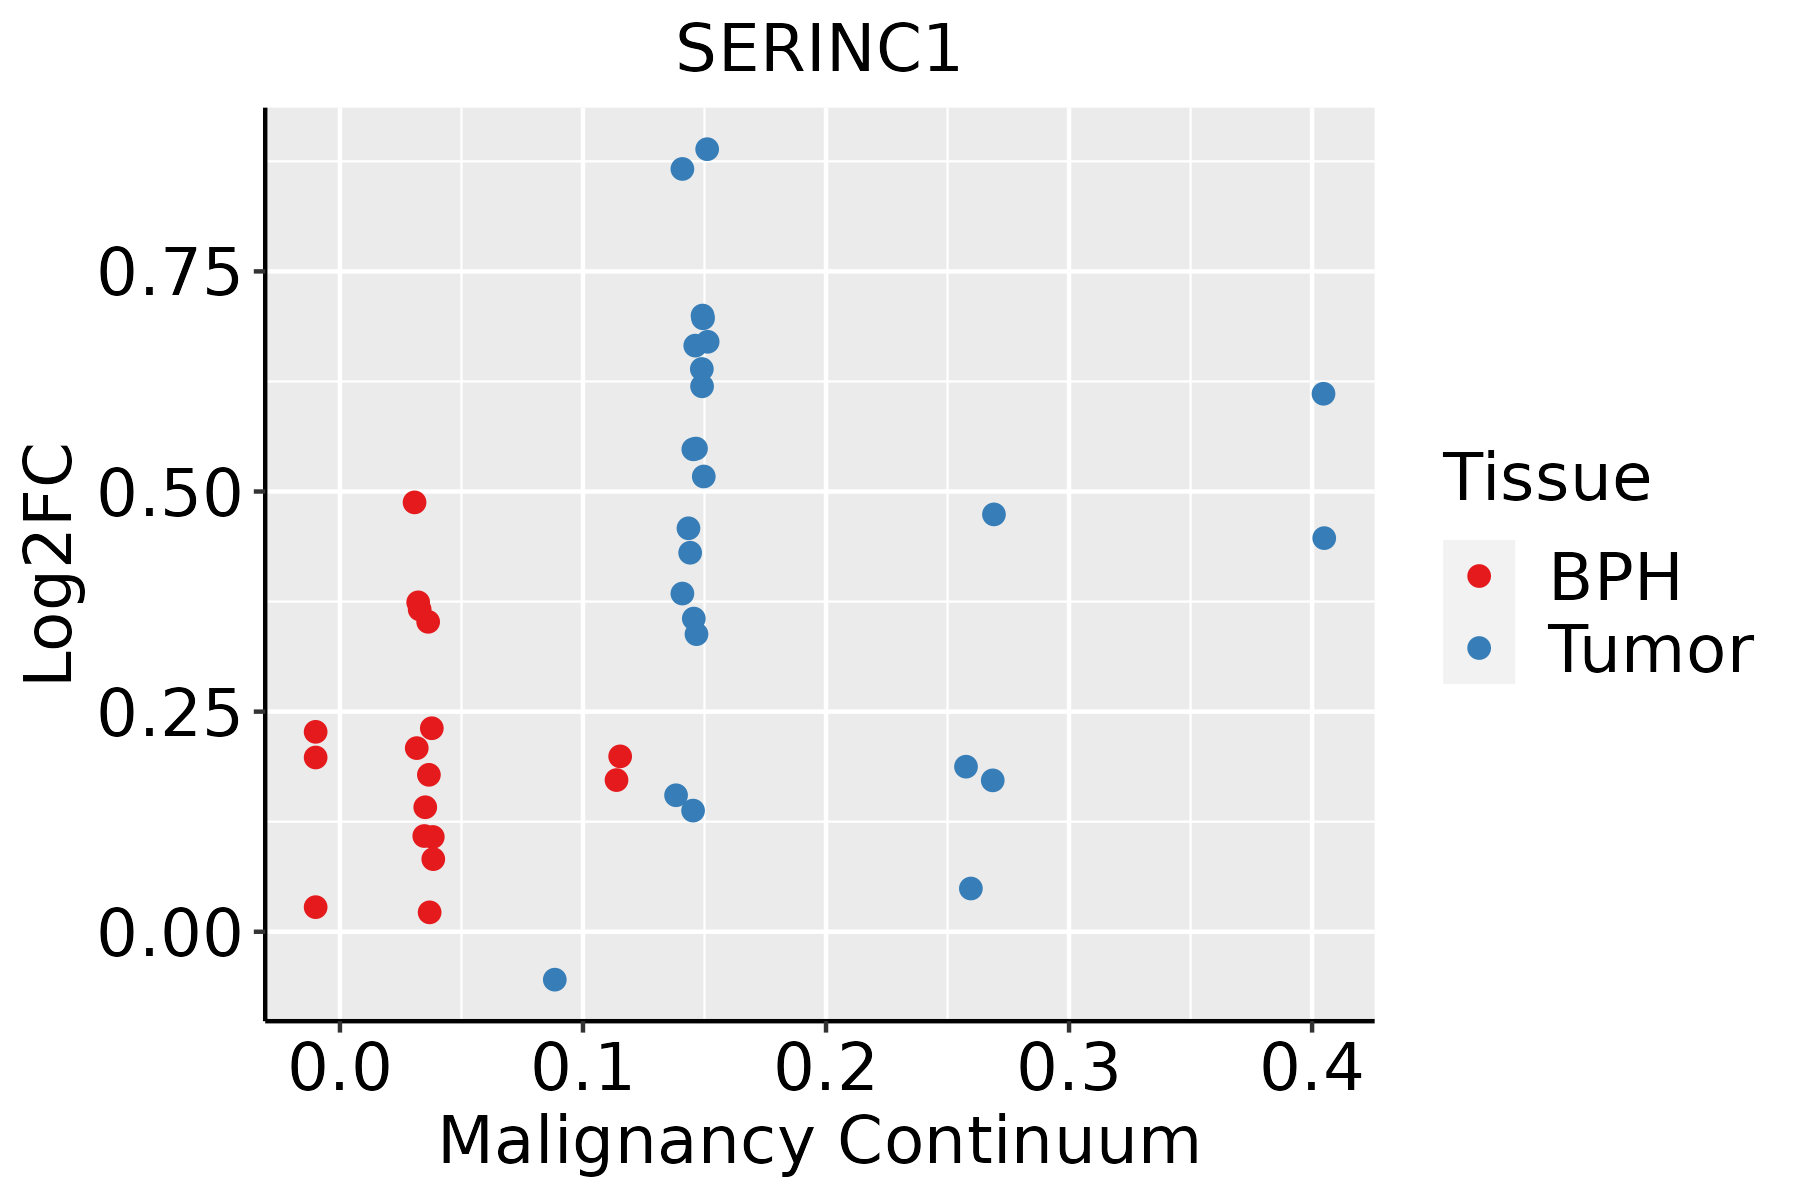 | BPH: Benign Prostatic Hyperplasia |
| Skin | 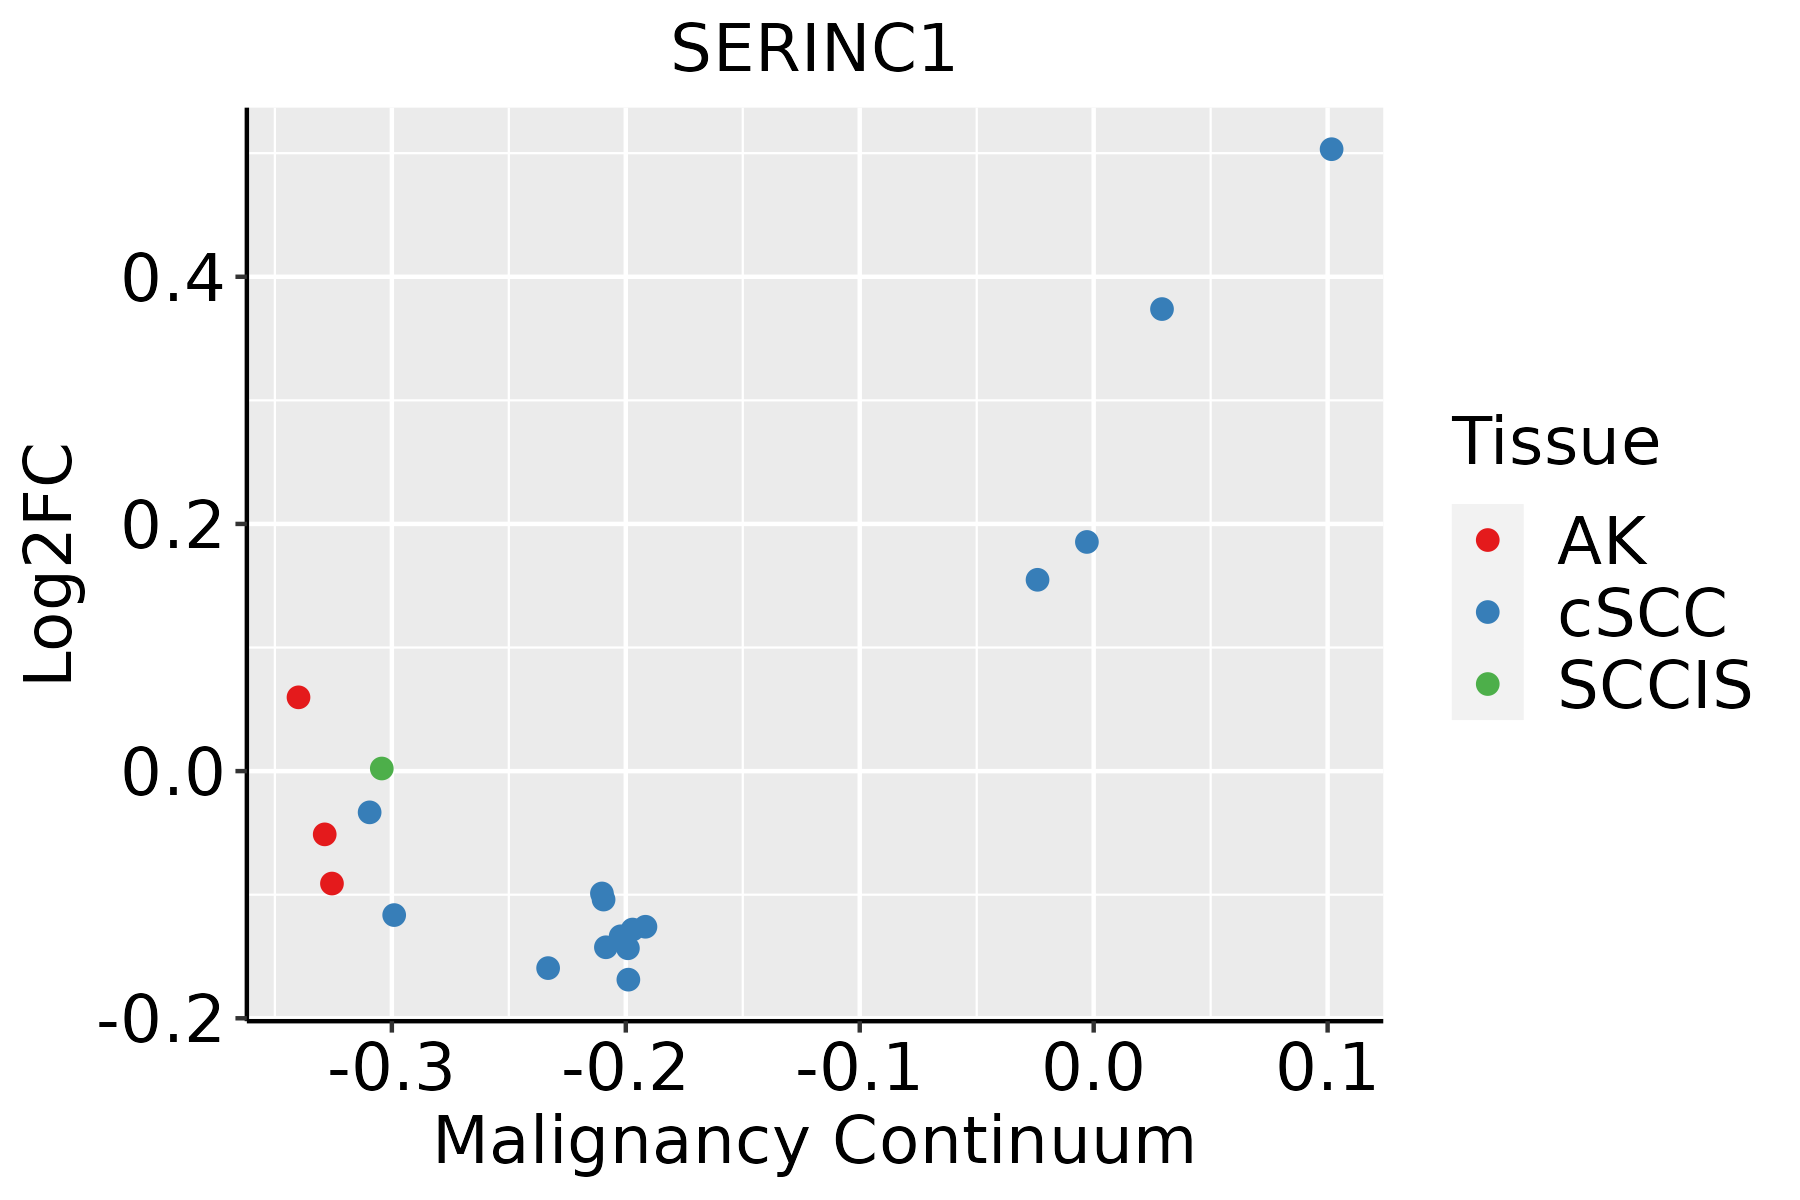 | AK: Actinic keratosis |
| cSCC: Cutaneous squamous cell carcinoma | ||
| SCCIS:squamous cell carcinoma in situ | ||
| Thyroid | 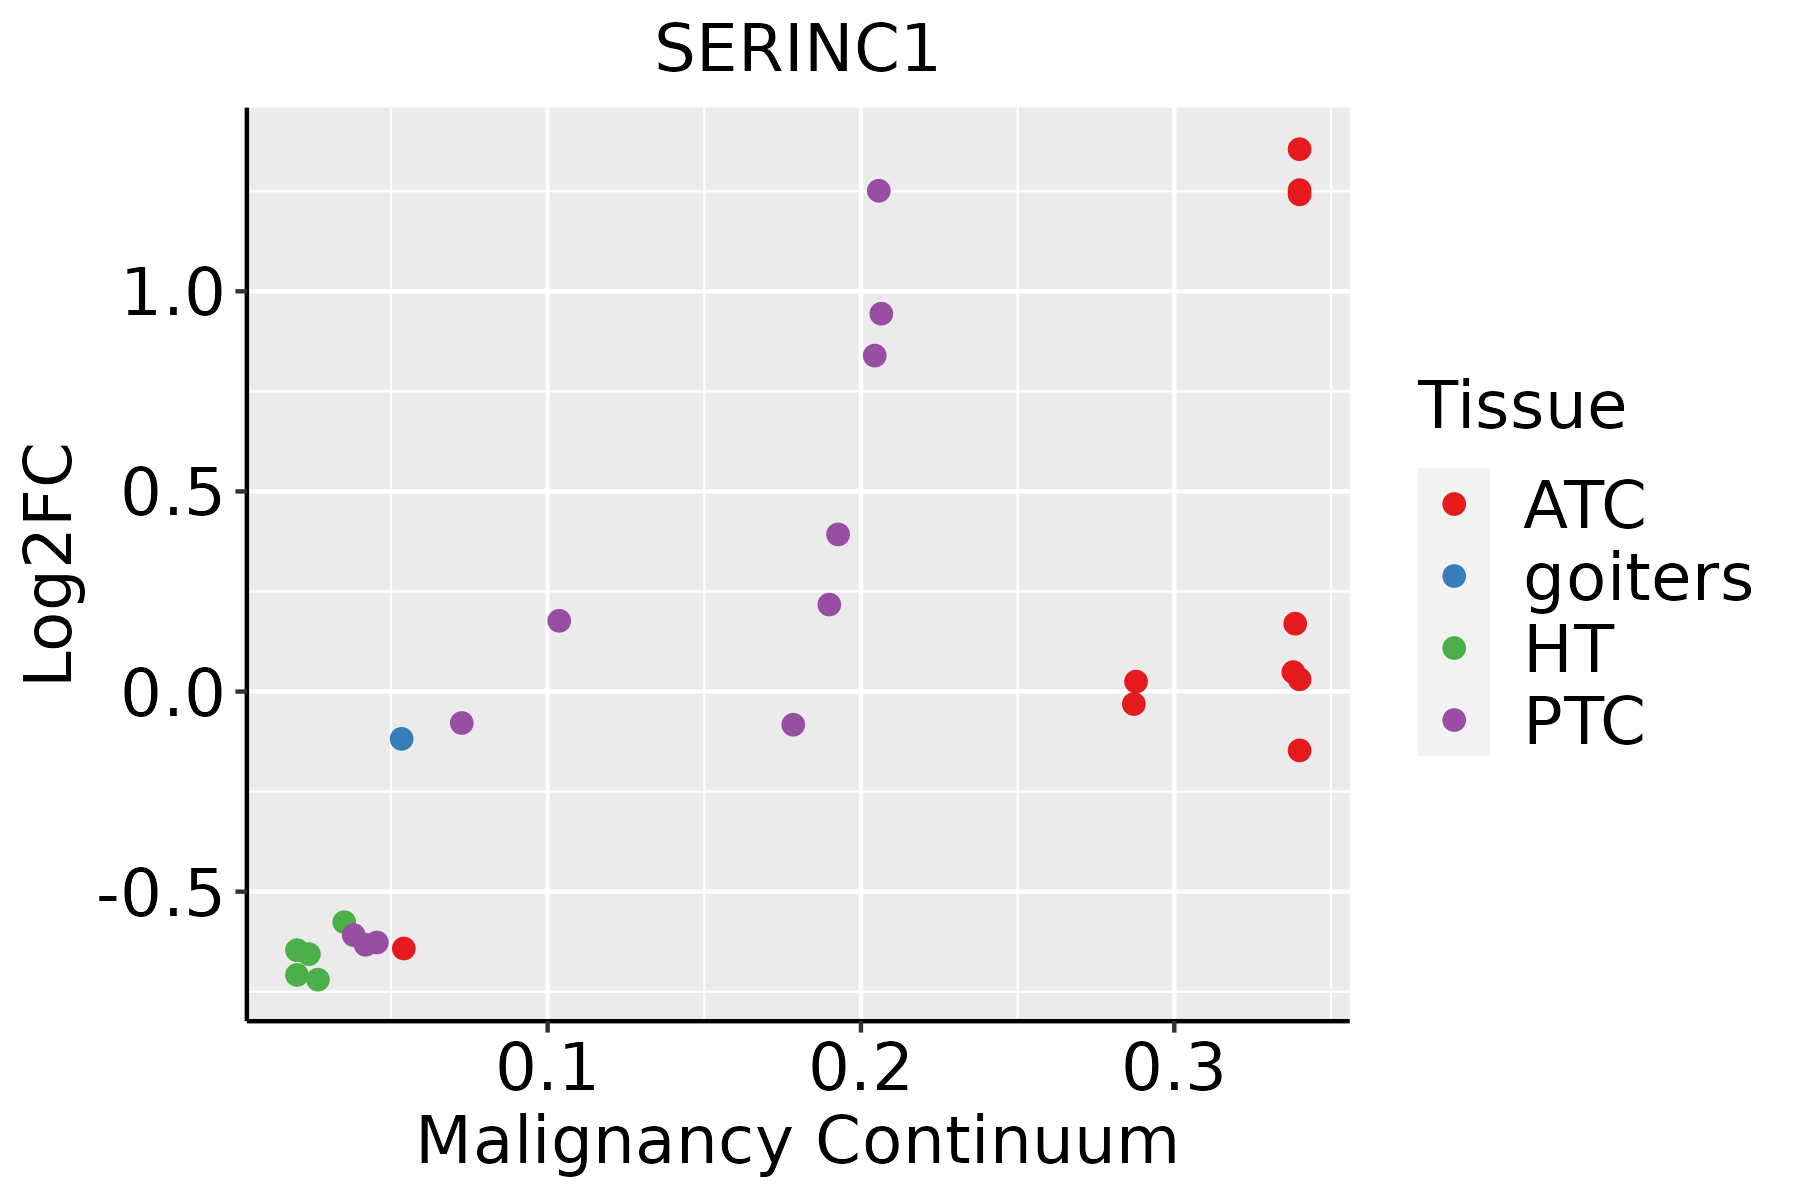 | ATC: Anaplastic thyroid cancer |
| HT: Hashimoto's thyroiditis | ||
| PTC: Papillary thyroid cancer |
| ∗log2FC in expression of this searched gene in stem-like cells from each diseased tissue sample relative to stem-like cells in normal samples in each tissue plotted against the malignancy continuum. Samples are colored based on if they are from different disease stage. |
Top |
Malignant transformation related pathway analysis |
| Find out the enriched GO biological processes and KEGG pathways involved in transition from healthy to precancer to cancer |
| Tissue | Disease Stage | Enriched GO biological Processes |
| Colorectum | AD |  |
| Colorectum | SER |  |
| Colorectum | MSS |  |
| Colorectum | MSI-H |  |
| Colorectum | FAP |  |
| ∗Top 15 enriched GO BP terms are showed in the bar plot of each disease state in each tissue. Each row represents a significant GO biological process which is colored according to the -log10(p.adjust). |
| Page: 1 2 3 4 5 6 7 8 9 |
| GO ID | Tissue | Disease Stage | Description | Gene Ratio | Bg Ratio | pvalue | p.adjust | Count |
| GO:00086544 | Esophagus | ESCC | phospholipid biosynthetic process | 162/8552 | 253/18723 | 2.59e-09 | 5.73e-08 | 162 |
| GO:00066433 | Esophagus | ESCC | membrane lipid metabolic process | 130/8552 | 203/18723 | 9.29e-08 | 1.54e-06 | 130 |
| GO:00066446 | Esophagus | ESCC | phospholipid metabolic process | 218/8552 | 383/18723 | 5.37e-06 | 5.59e-05 | 218 |
| GO:00066652 | Esophagus | ESCC | sphingolipid metabolic process | 96/8552 | 155/18723 | 3.21e-05 | 2.66e-04 | 96 |
| GO:00066505 | Esophagus | ESCC | glycerophospholipid metabolic process | 174/8552 | 306/18723 | 4.92e-05 | 3.85e-04 | 174 |
| GO:00065757 | Esophagus | ESCC | cellular modified amino acid metabolic process | 112/8552 | 188/18723 | 8.31e-05 | 6.06e-04 | 112 |
| GO:00440918 | Esophagus | ESCC | membrane biogenesis | 38/8552 | 55/18723 | 3.78e-04 | 2.19e-03 | 38 |
| GO:00464864 | Esophagus | ESCC | glycerolipid metabolic process | 211/8552 | 392/18723 | 6.51e-04 | 3.46e-03 | 211 |
| GO:000657511 | Liver | Cirrhotic | cellular modified amino acid metabolic process | 70/4634 | 188/18723 | 9.04e-05 | 9.69e-04 | 70 |
| GO:00440914 | Liver | Cirrhotic | membrane biogenesis | 25/4634 | 55/18723 | 6.51e-04 | 4.96e-03 | 25 |
| GO:0006643 | Liver | Cirrhotic | membrane lipid metabolic process | 69/4634 | 203/18723 | 1.89e-03 | 1.19e-02 | 69 |
| GO:000657521 | Liver | HCC | cellular modified amino acid metabolic process | 119/7958 | 188/18723 | 6.47e-09 | 1.67e-07 | 119 |
| GO:00086542 | Liver | HCC | phospholipid biosynthetic process | 150/7958 | 253/18723 | 4.77e-08 | 1.03e-06 | 150 |
| GO:00066444 | Liver | HCC | phospholipid metabolic process | 214/7958 | 383/18723 | 7.25e-08 | 1.48e-06 | 214 |
| GO:004648611 | Liver | HCC | glycerolipid metabolic process | 215/7958 | 392/18723 | 4.54e-07 | 7.49e-06 | 215 |
| GO:00066504 | Liver | HCC | glycerophospholipid metabolic process | 168/7958 | 306/18723 | 7.27e-06 | 8.62e-05 | 168 |
| GO:00066431 | Liver | HCC | membrane lipid metabolic process | 115/7958 | 203/18723 | 3.17e-05 | 3.22e-04 | 115 |
| GO:004409111 | Liver | HCC | membrane biogenesis | 37/7958 | 55/18723 | 1.79e-04 | 1.41e-03 | 37 |
| GO:0006665 | Liver | HCC | sphingolipid metabolic process | 85/7958 | 155/18723 | 1.27e-03 | 6.92e-03 | 85 |
| GO:00066432 | Oral cavity | OSCC | membrane lipid metabolic process | 111/7305 | 203/18723 | 4.02e-06 | 4.69e-05 | 111 |
| Page: 1 2 |
| Pathway ID | Tissue | Disease Stage | Description | Gene Ratio | Bg Ratio | pvalue | p.adjust | qvalue | Count |
| Page: 1 |
Top |
Cell-cell communication analysis |
| Identification of potential cell-cell interactions between two cell types and their ligand-receptor pairs for different disease states |
| Ligand | Receptor | LRpair | Pathway | Tissue | Disease Stage |
| Page: 1 |
Top |
Single-cell gene regulatory network inference analysis |
| Find out the significant the regulons (TFs) and the target genes of each regulon across cell types for different disease states |
| TF | Cell Type | Tissue | Disease Stage | Target Gene | RSS | Regulon Activity |
| ∗The dot plots of a searched regulon are shown for all cell subpopulations in each disease state of each tissue based on the regulon specific score inferred using pySCENIC and by calculating the average expression. |
| Page: 1 |
Top |
Somatic mutation of malignant transformation related genes |
| Annotation of somatic variants for genes involved in malignant transformation |
| Hugo Symbol | Variant Class | Variant Classification | dbSNP RS | HGVSc | HGVSp | HGVSp Short | SWISSPROT | BIOTYPE | SIFT | PolyPhen | Tumor Sample Barcode | Tissue | Histology | Sex | Age | Stage | Therapy Types | Drugs | Outcome |
| SERINC1 | SNV | Missense_Mutation | rs778207588 | c.275N>A | p.Arg92His | p.R92H | Q9NRX5 | protein_coding | deleterious(0.01) | probably_damaging(0.993) | TCGA-AN-A0AK-01 | Breast | breast invasive carcinoma | Female | >=65 | I/II | Unknown | Unknown | SD |
| SERINC1 | SNV | Missense_Mutation | c.442N>C | p.Phe148Leu | p.F148L | Q9NRX5 | protein_coding | deleterious(0.05) | probably_damaging(0.914) | TCGA-AR-A0TS-01 | Breast | breast invasive carcinoma | Female | <65 | I/II | Chemotherapy | doxorubicin | SD | |
| SERINC1 | SNV | Missense_Mutation | novel | c.456G>T | p.Trp152Cys | p.W152C | Q9NRX5 | protein_coding | deleterious(0) | probably_damaging(0.98) | TCGA-LD-A9QF-01 | Breast | breast invasive carcinoma | Female | >=65 | I/II | Chemotherapy | taxol | SD |
| SERINC1 | SNV | Missense_Mutation | novel | c.205N>T | p.Pro69Ser | p.P69S | Q9NRX5 | protein_coding | deleterious(0.03) | benign(0.108) | TCGA-DS-A1OB-01 | Cervix | cervical & endocervical cancer | Female | <65 | I/II | Chemotherapy | carboplatin | PD |
| SERINC1 | SNV | Missense_Mutation | c.650N>G | p.Phe217Cys | p.F217C | Q9NRX5 | protein_coding | deleterious(0.01) | possibly_damaging(0.517) | TCGA-AA-3848-01 | Colorectum | colon adenocarcinoma | Female | >=65 | III/IV | Unknown | Unknown | PD | |
| SERINC1 | SNV | Missense_Mutation | novel | c.1348N>T | p.Arg450Cys | p.R450C | Q9NRX5 | protein_coding | deleterious(0) | probably_damaging(1) | TCGA-EI-6917-01 | Colorectum | rectum adenocarcinoma | Male | <65 | III/IV | Chemotherapy | 5fluorouracil+oxaciplatina+l-folinian | SD |
| SERINC1 | SNV | Missense_Mutation | c.503N>G | p.Leu168Arg | p.L168R | Q9NRX5 | protein_coding | deleterious(0) | probably_damaging(0.994) | TCGA-F5-6861-01 | Colorectum | rectum adenocarcinoma | Female | <65 | I/II | Unknown | Unknown | SD | |
| SERINC1 | SNV | Missense_Mutation | novel | c.808N>C | p.Tyr270His | p.Y270H | Q9NRX5 | protein_coding | deleterious(0) | probably_damaging(0.999) | TCGA-A5-A0G2-01 | Endometrium | uterine corpus endometrioid carcinoma | Female | <65 | III/IV | Unknown | Unknown | SD |
| SERINC1 | SNV | Missense_Mutation | novel | c.607N>T | p.Ala203Ser | p.A203S | Q9NRX5 | protein_coding | tolerated(0.65) | benign(0.026) | TCGA-A5-A1OF-01 | Endometrium | uterine corpus endometrioid carcinoma | Female | <65 | I/II | Unknown | Unknown | SD |
| SERINC1 | SNV | Missense_Mutation | c.404N>T | p.Ala135Val | p.A135V | Q9NRX5 | protein_coding | deleterious(0) | benign(0.158) | TCGA-AP-A051-01 | Endometrium | uterine corpus endometrioid carcinoma | Female | >=65 | I/II | Unknown | Unknown | SD |
| Page: 1 2 3 4 |
Top |
Related drugs of malignant transformation related genes |
| Identification of chemicals and drugs interact with genes involved in malignant transfromation |
| (DGIdb 4.0) |
| Entrez ID | Symbol | Category | Interaction Types | Drug Claim Name | Drug Name | PMIDs |
| Page: 1 |

Copyright 2023-Present -The University of Texas Health Science Center at Houston |