| Tissue | Expression Dynamics | Abbreviation |
| Cervix | 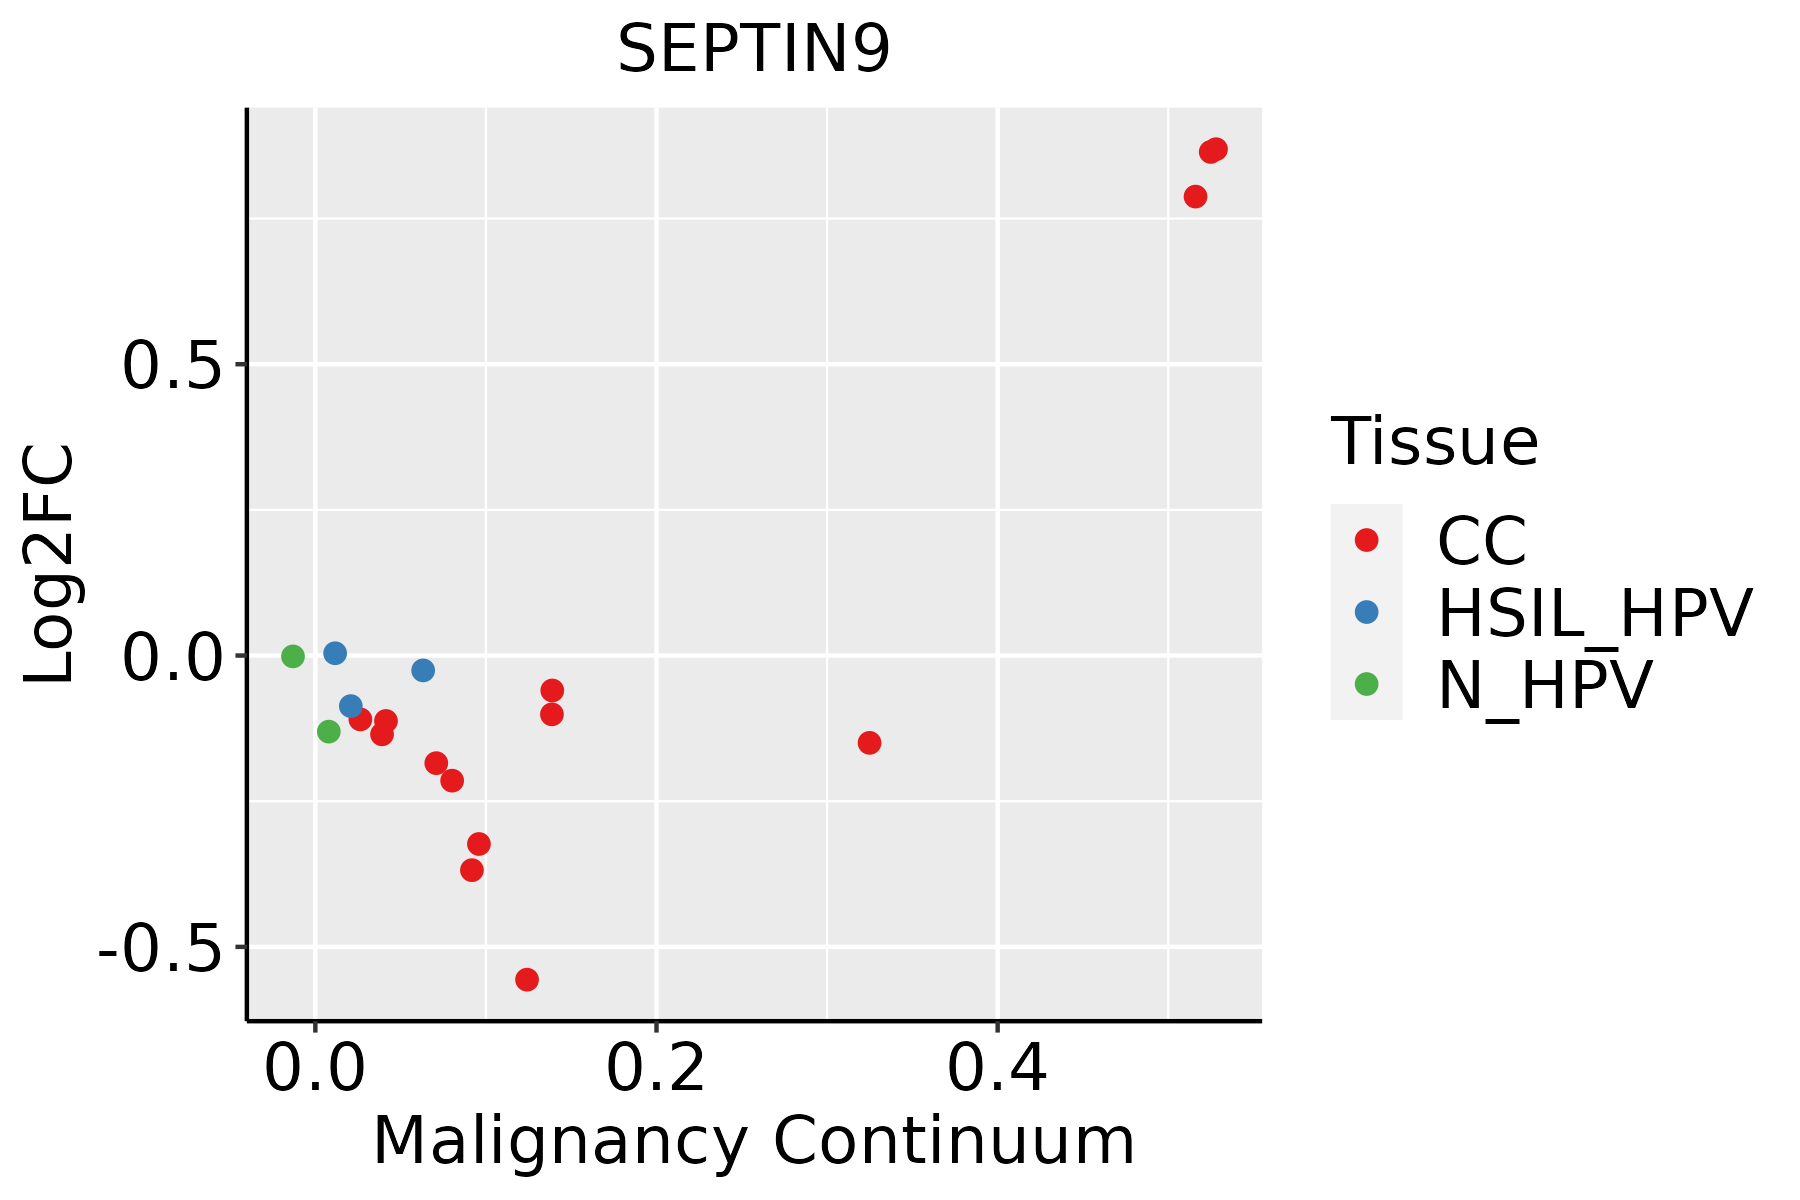 | CC: Cervix cancer |
| HSIL_HPV: HPV-infected high-grade squamous intraepithelial lesions |
| N_HPV: HPV-infected normal cervix |
| Colorectum (GSE201348) | 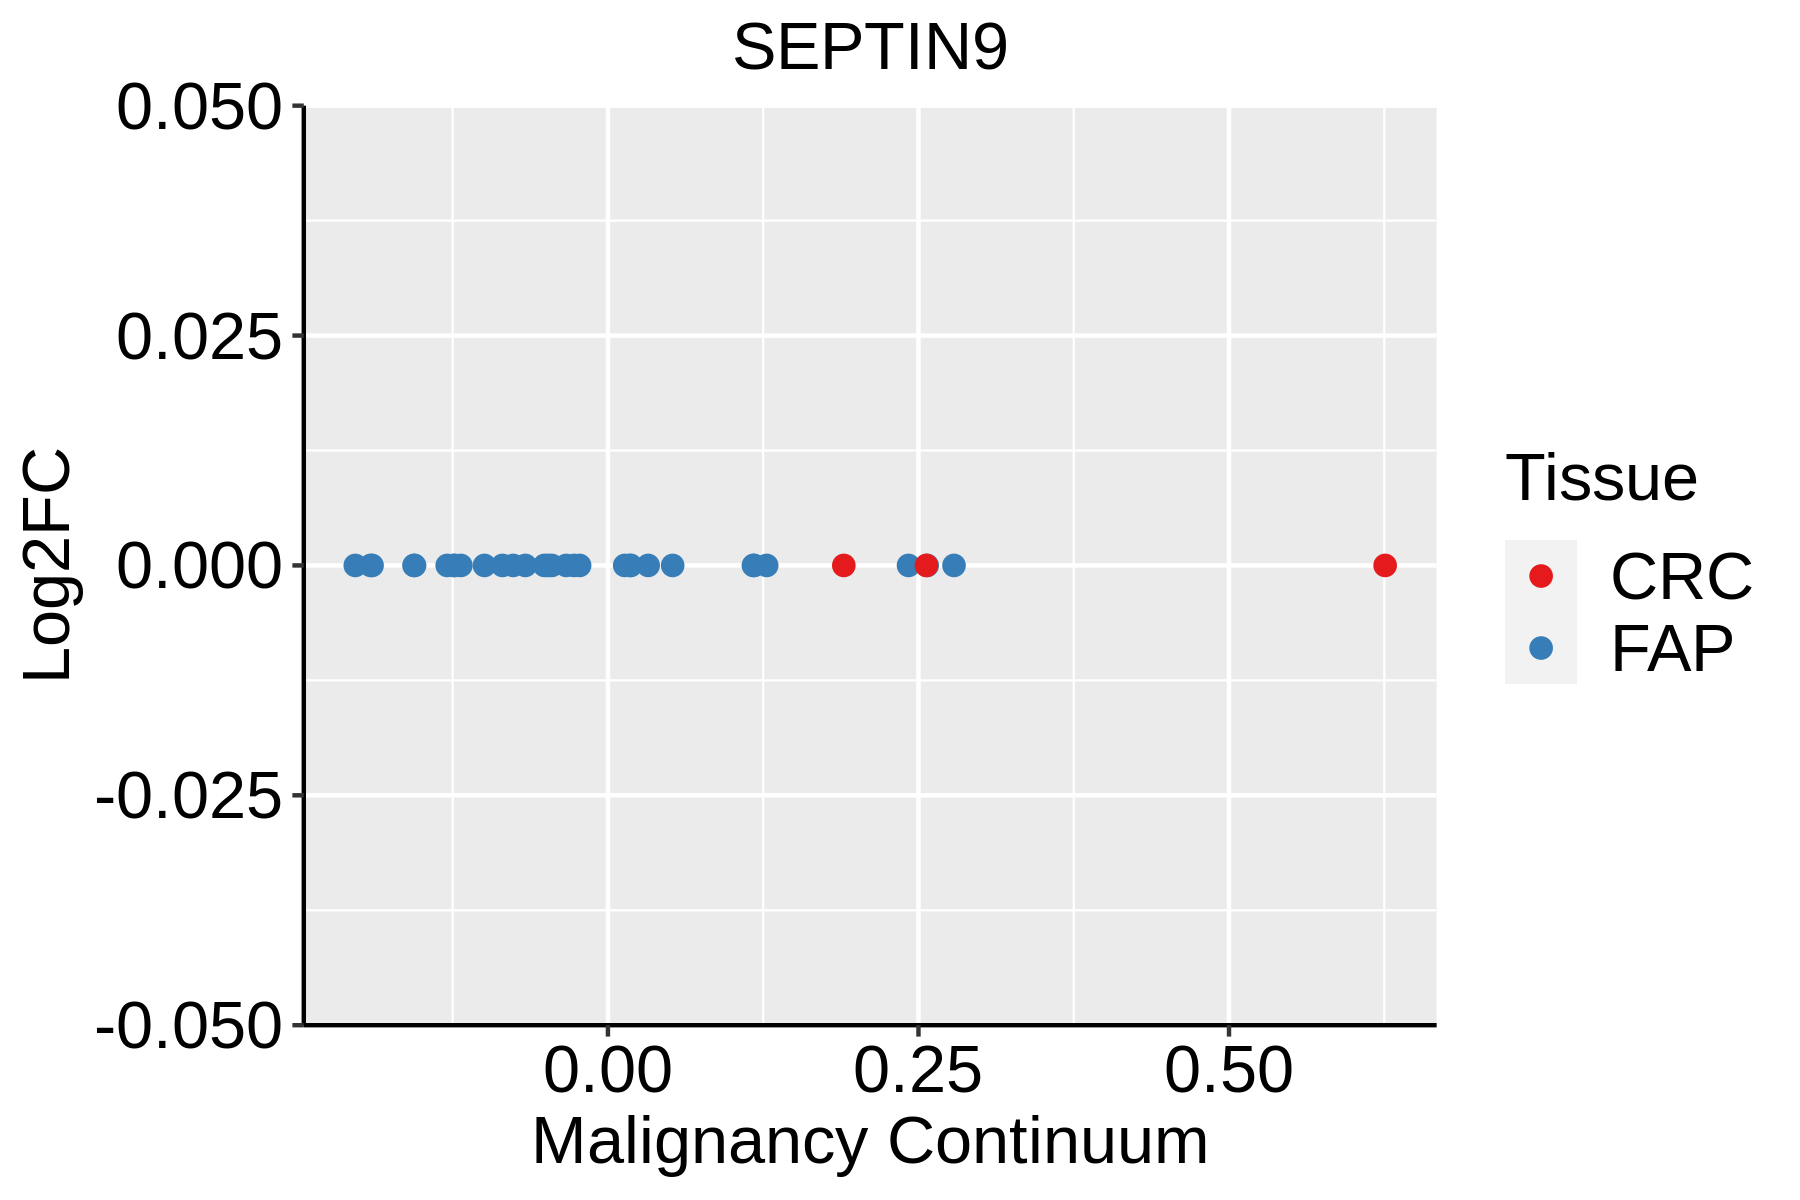 | FAP: Familial adenomatous polyposis |
| CRC: Colorectal cancer |
| Colorectum (HTA11) | 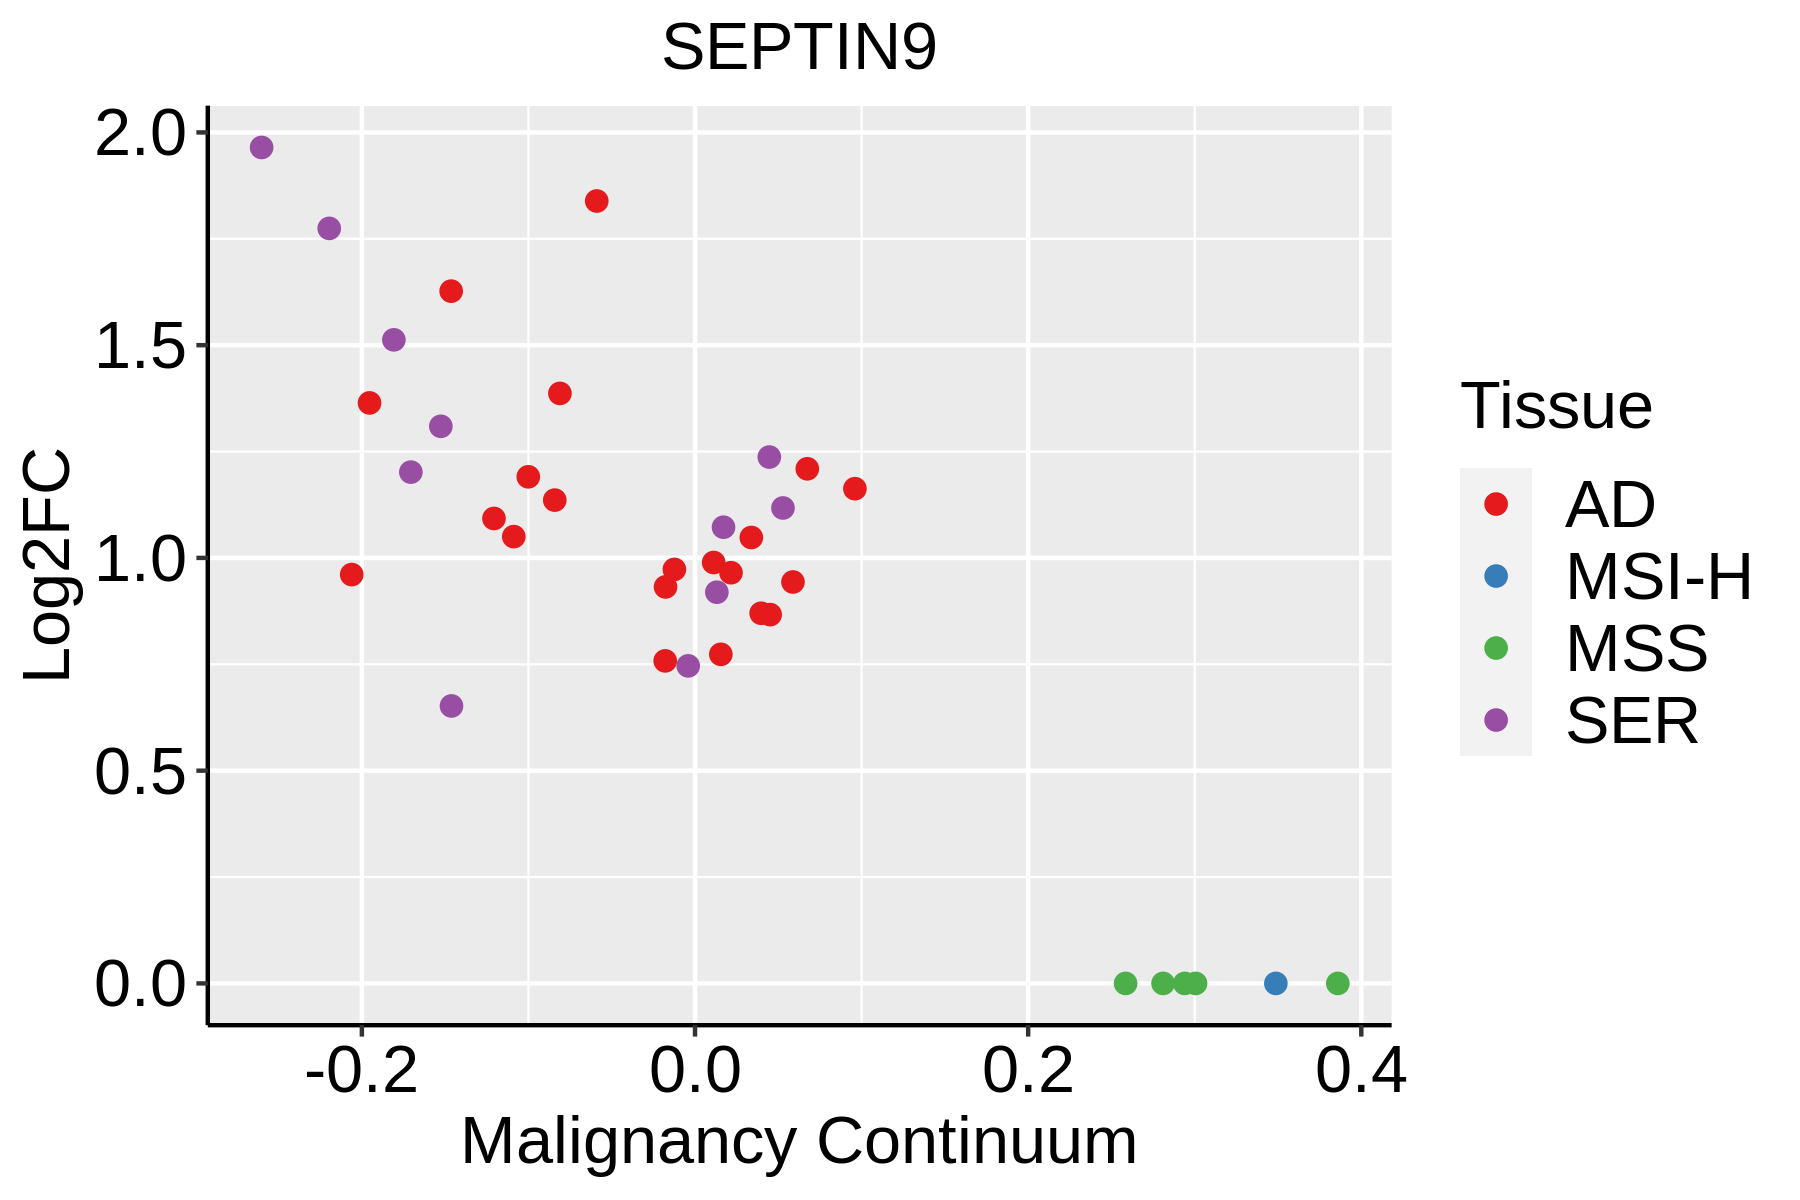 | AD: Adenomas |
| SER: Sessile serrated lesions |
| MSI-H: Microsatellite-high colorectal cancer |
| MSS: Microsatellite stable colorectal cancer |
| Endometrium |  | AEH: Atypical endometrial hyperplasia |
| EEC: Endometrioid Cancer |
| Esophagus | 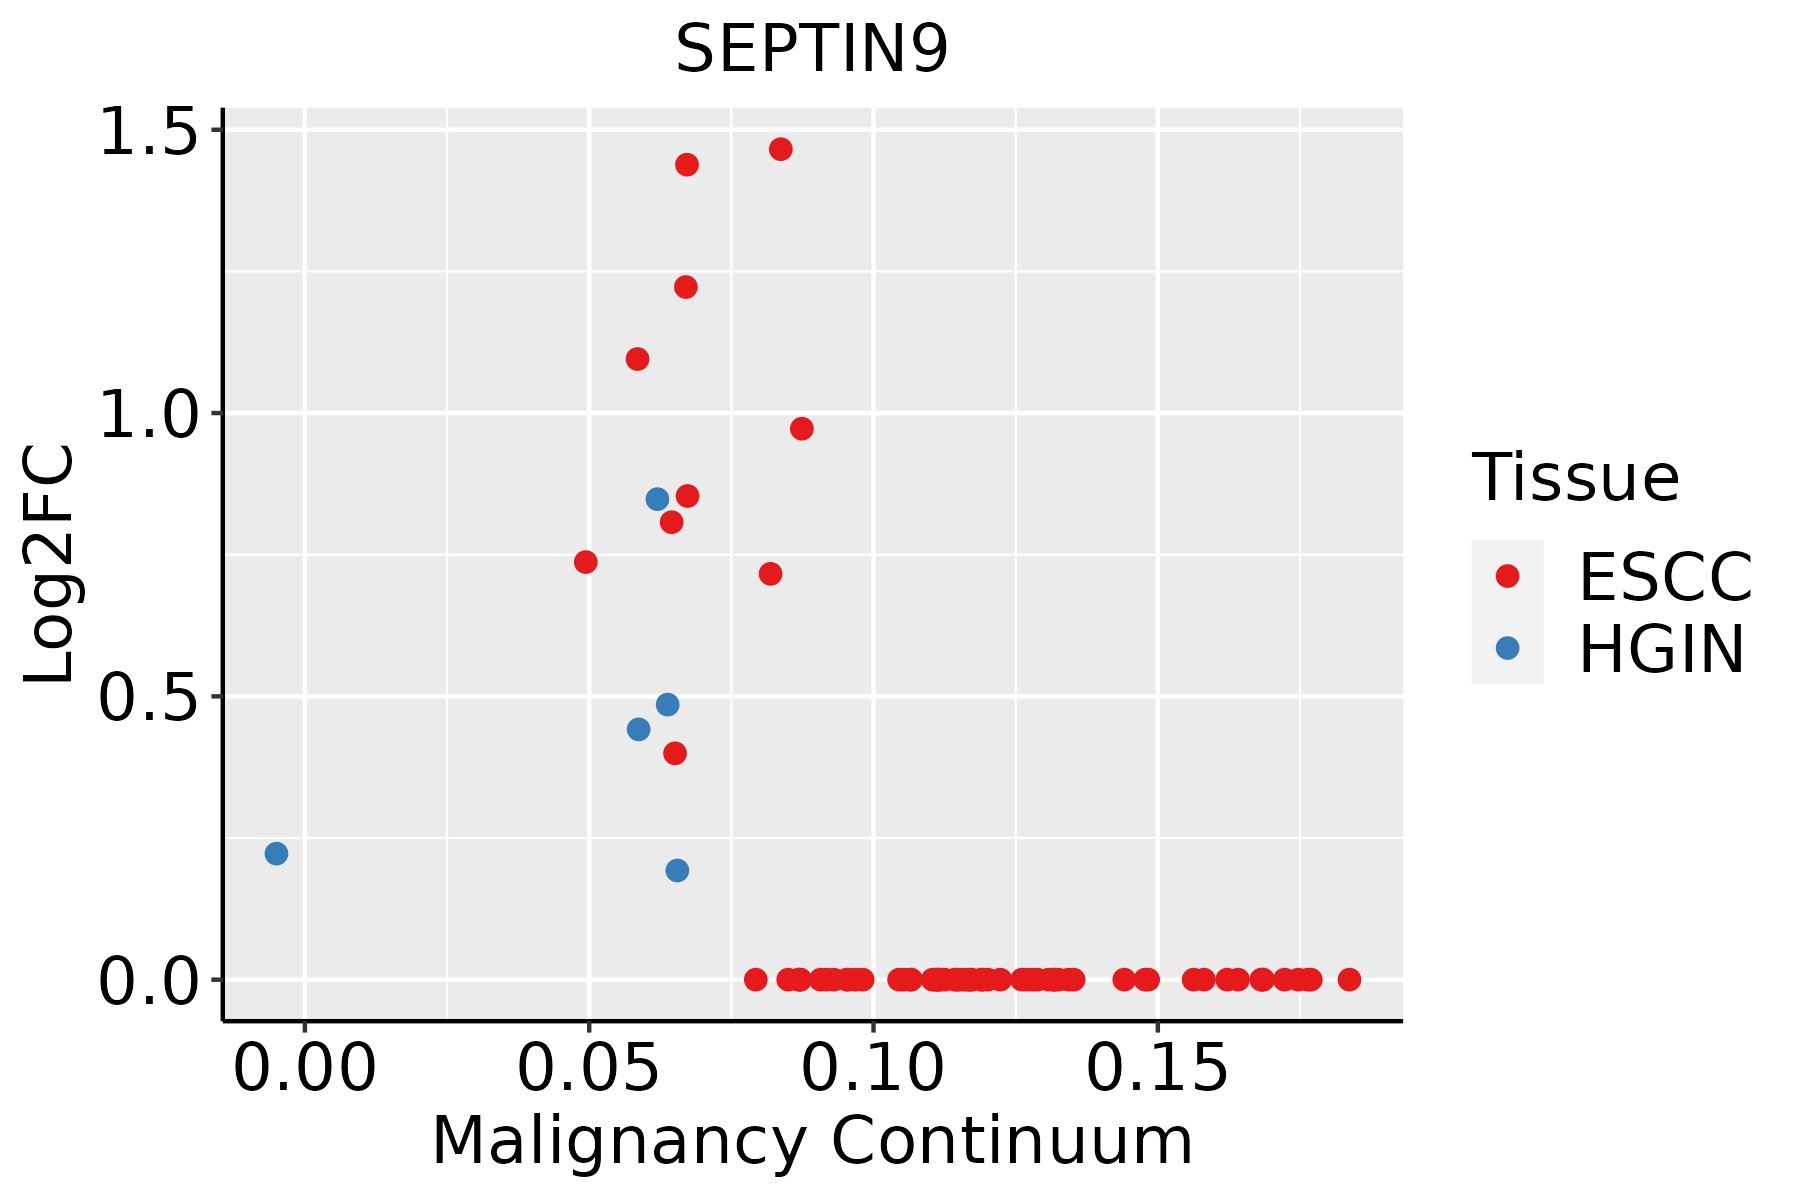 | ESCC: Esophageal squamous cell carcinoma |
| HGIN: High-grade intraepithelial neoplasias |
| LGIN: Low-grade intraepithelial neoplasias |
| GC | 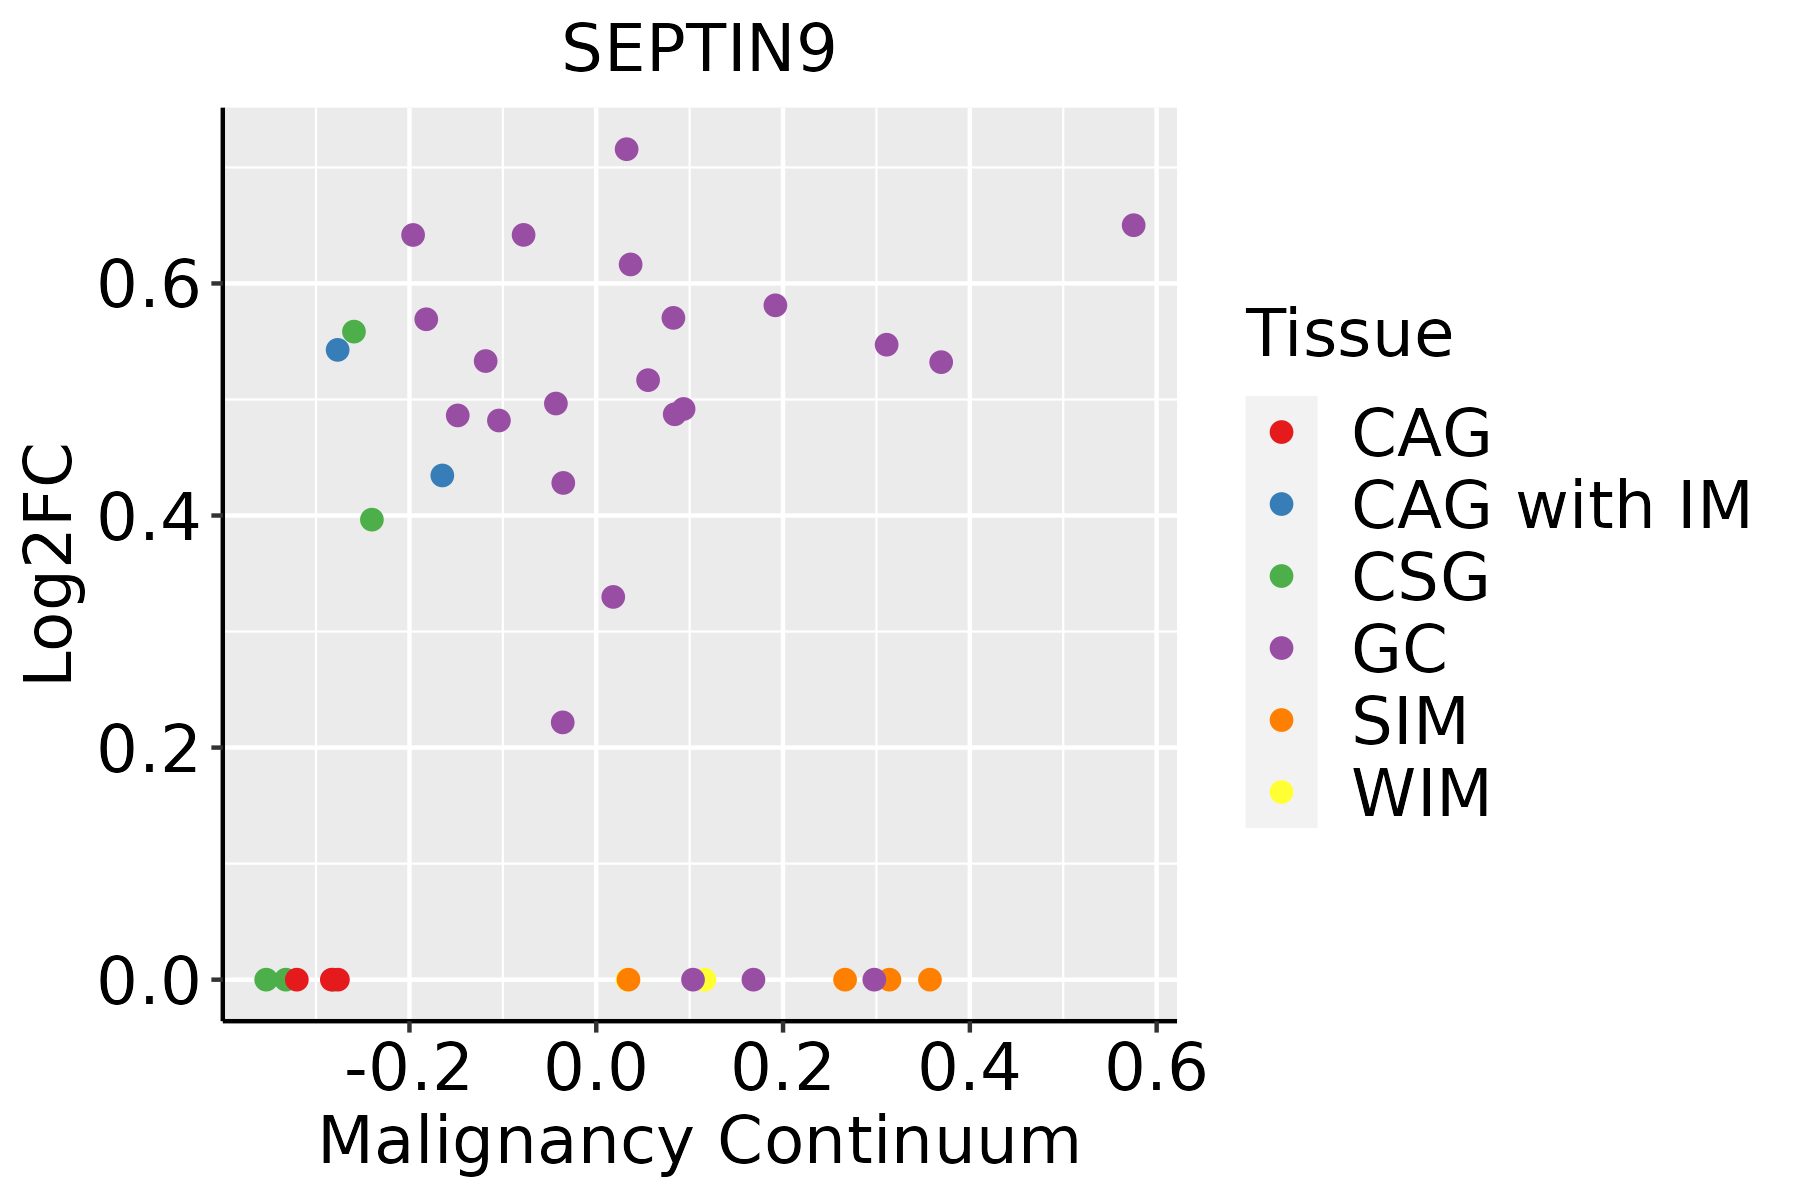 | CAG: Chronic atrophic gastritis |
| CAG with IM: Chronic atrophic gastritis with intestinal metaplasia |
| CSG: Chronic superficial gastritis |
| GC: Gastric cancer |
| SIM: Severe intestinal metaplasia |
| WIM: Wild intestinal metaplasia |
| Lung |  | AAH: Atypical adenomatous hyperplasia |
| AIS: Adenocarcinoma in situ |
| IAC: Invasive lung adenocarcinoma |
| MIA: Minimally invasive adenocarcinoma |
| Prostate | 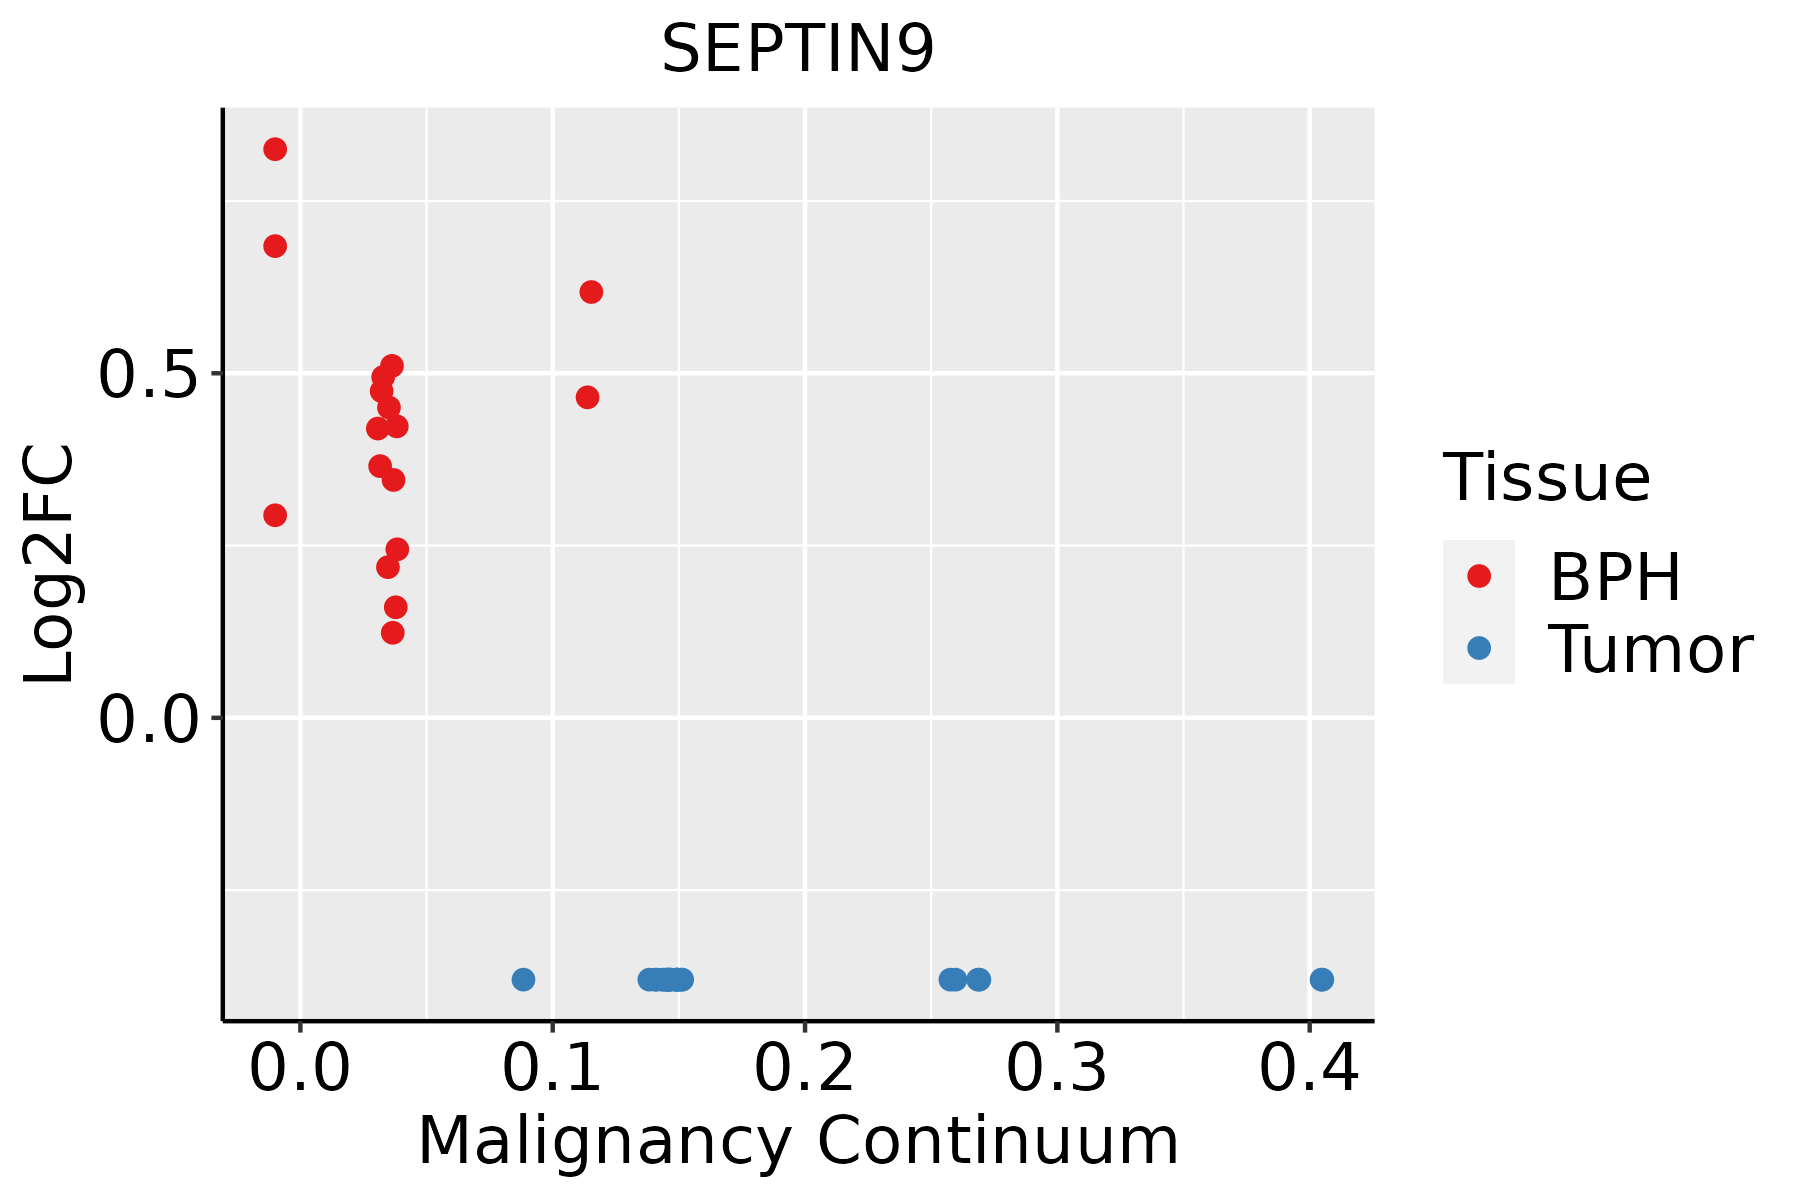 | BPH: Benign Prostatic Hyperplasia |
| Skin | 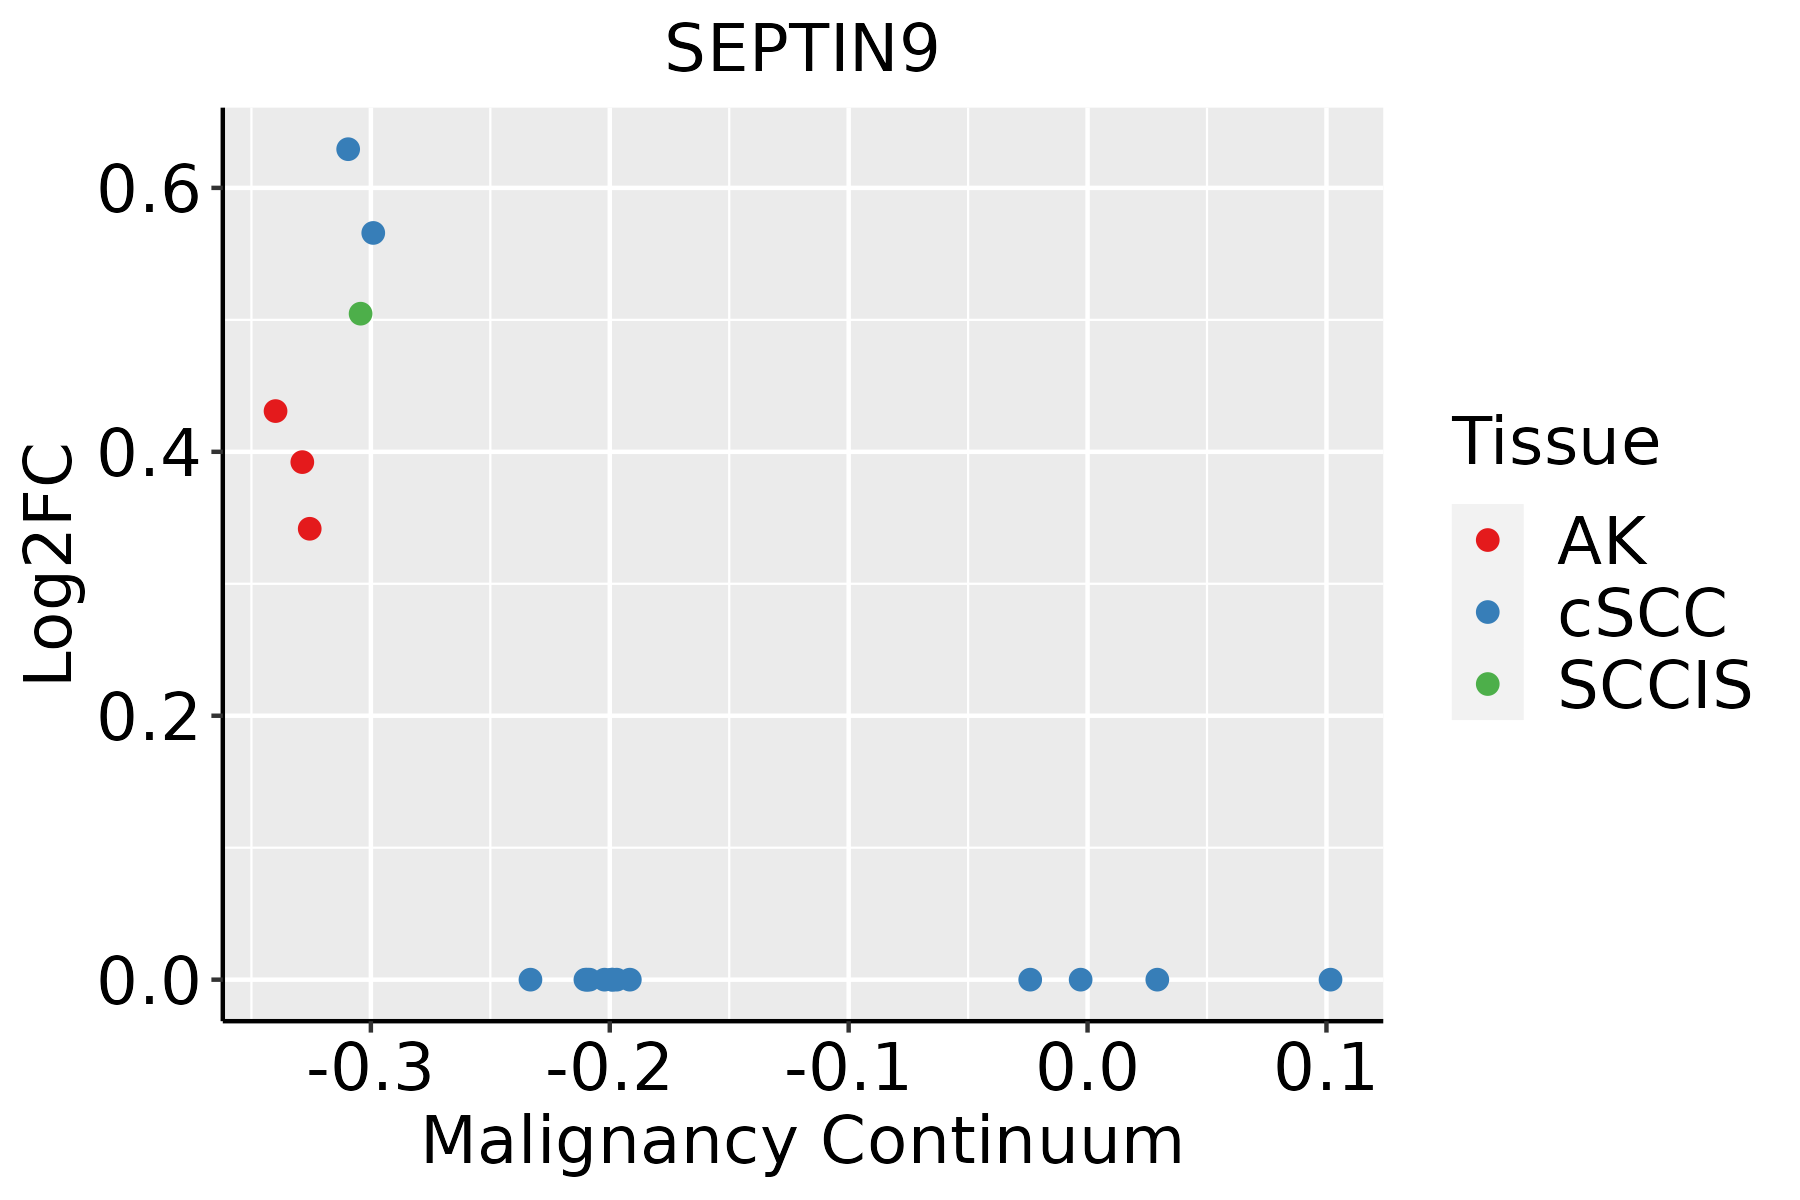 | AK: Actinic keratosis |
| cSCC: Cutaneous squamous cell carcinoma |
| SCCIS:squamous cell carcinoma in situ |
| GO ID | Tissue | Disease Stage | Description | Gene Ratio | Bg Ratio | pvalue | p.adjust | Count |
| GO:00313467 | Cervix | CC | positive regulation of cell projection organization | 72/2311 | 353/18723 | 1.04e-05 | 2.32e-04 | 72 |
| GO:19021153 | Cervix | CC | regulation of organelle assembly | 40/2311 | 186/18723 | 2.92e-04 | 3.15e-03 | 40 |
| GO:19021171 | Cervix | CC | positive regulation of organelle assembly | 19/2311 | 67/18723 | 3.42e-04 | 3.58e-03 | 19 |
| GO:00009107 | Cervix | CC | cytokinesis | 37/2311 | 173/18723 | 5.40e-04 | 5.23e-03 | 37 |
| GO:01200328 | Cervix | CC | regulation of plasma membrane bounded cell projection assembly | 38/2311 | 186/18723 | 1.14e-03 | 9.35e-03 | 38 |
| GO:00604917 | Cervix | CC | regulation of cell projection assembly | 38/2311 | 188/18723 | 1.40e-03 | 1.10e-02 | 38 |
| GO:0000910 | Colorectum | AD | cytokinesis | 59/3918 | 173/18723 | 3.74e-05 | 6.75e-04 | 59 |
| GO:0031346 | Colorectum | AD | positive regulation of cell projection organization | 104/3918 | 353/18723 | 8.26e-05 | 1.30e-03 | 104 |
| GO:0061640 | Colorectum | AD | cytoskeleton-dependent cytokinesis | 37/3918 | 100/18723 | 1.58e-04 | 2.20e-03 | 37 |
| GO:0120034 | Colorectum | AD | positive regulation of plasma membrane bounded cell projection assembly | 33/3918 | 105/18723 | 7.49e-03 | 4.55e-02 | 33 |
| GO:0120032 | Colorectum | AD | regulation of plasma membrane bounded cell projection assembly | 53/3918 | 186/18723 | 8.51e-03 | 4.97e-02 | 53 |
| GO:00009101 | Colorectum | SER | cytokinesis | 45/2897 | 173/18723 | 2.28e-04 | 3.93e-03 | 45 |
| GO:00616401 | Colorectum | SER | cytoskeleton-dependent cytokinesis | 29/2897 | 100/18723 | 4.25e-04 | 6.25e-03 | 29 |
| GO:00313461 | Colorectum | SER | positive regulation of cell projection organization | 75/2897 | 353/18723 | 2.22e-03 | 2.14e-02 | 75 |
| GO:01200321 | Colorectum | SER | regulation of plasma membrane bounded cell projection assembly | 43/2897 | 186/18723 | 3.82e-03 | 3.16e-02 | 43 |
| GO:0060491 | Colorectum | SER | regulation of cell projection assembly | 43/2897 | 188/18723 | 4.68e-03 | 3.70e-02 | 43 |
| GO:00009108 | Endometrium | AEH | cytokinesis | 40/2100 | 173/18723 | 6.01e-06 | 1.49e-04 | 40 |
| GO:00616403 | Endometrium | AEH | cytoskeleton-dependent cytokinesis | 24/2100 | 100/18723 | 2.27e-04 | 2.75e-03 | 24 |
| GO:00313468 | Endometrium | AEH | positive regulation of cell projection organization | 61/2100 | 353/18723 | 3.91e-04 | 4.20e-03 | 61 |
| GO:01200329 | Endometrium | AEH | regulation of plasma membrane bounded cell projection assembly | 34/2100 | 186/18723 | 2.79e-03 | 2.01e-02 | 34 |
| Pathway ID | Tissue | Disease Stage | Description | Gene Ratio | Bg Ratio | pvalue | p.adjust | qvalue | Count |
| hsa0513120 | Cervix | CC | Shigellosis | 69/1267 | 247/8465 | 7.64e-08 | 1.03e-06 | 6.10e-07 | 69 |
| hsa0510020 | Cervix | CC | Bacterial invasion of epithelial cells | 23/1267 | 77/8465 | 6.25e-04 | 2.93e-03 | 1.73e-03 | 23 |
| hsa05131110 | Cervix | CC | Shigellosis | 69/1267 | 247/8465 | 7.64e-08 | 1.03e-06 | 6.10e-07 | 69 |
| hsa05100110 | Cervix | CC | Bacterial invasion of epithelial cells | 23/1267 | 77/8465 | 6.25e-04 | 2.93e-03 | 1.73e-03 | 23 |
| hsa05131 | Colorectum | AD | Shigellosis | 109/2092 | 247/8465 | 1.09e-11 | 2.44e-10 | 1.55e-10 | 109 |
| hsa05100 | Colorectum | AD | Bacterial invasion of epithelial cells | 44/2092 | 77/8465 | 1.13e-09 | 2.22e-08 | 1.42e-08 | 44 |
| hsa051311 | Colorectum | AD | Shigellosis | 109/2092 | 247/8465 | 1.09e-11 | 2.44e-10 | 1.55e-10 | 109 |
| hsa051001 | Colorectum | AD | Bacterial invasion of epithelial cells | 44/2092 | 77/8465 | 1.13e-09 | 2.22e-08 | 1.42e-08 | 44 |
| hsa051312 | Colorectum | SER | Shigellosis | 87/1580 | 247/8465 | 3.07e-10 | 7.27e-09 | 5.28e-09 | 87 |
| hsa051002 | Colorectum | SER | Bacterial invasion of epithelial cells | 36/1580 | 77/8465 | 1.56e-08 | 3.45e-07 | 2.50e-07 | 36 |
| hsa051313 | Colorectum | SER | Shigellosis | 87/1580 | 247/8465 | 3.07e-10 | 7.27e-09 | 5.28e-09 | 87 |
| hsa051003 | Colorectum | SER | Bacterial invasion of epithelial cells | 36/1580 | 77/8465 | 1.56e-08 | 3.45e-07 | 2.50e-07 | 36 |
| hsa0513126 | Endometrium | AEH | Shigellosis | 78/1197 | 247/8465 | 9.23e-13 | 2.00e-11 | 1.46e-11 | 78 |
| hsa0510026 | Endometrium | AEH | Bacterial invasion of epithelial cells | 32/1197 | 77/8465 | 3.28e-09 | 5.91e-08 | 4.33e-08 | 32 |
| hsa05131111 | Endometrium | AEH | Shigellosis | 78/1197 | 247/8465 | 9.23e-13 | 2.00e-11 | 1.46e-11 | 78 |
| hsa05100111 | Endometrium | AEH | Bacterial invasion of epithelial cells | 32/1197 | 77/8465 | 3.28e-09 | 5.91e-08 | 4.33e-08 | 32 |
| hsa0513127 | Endometrium | EEC | Shigellosis | 79/1237 | 247/8465 | 1.80e-12 | 3.95e-11 | 2.95e-11 | 79 |
| hsa0510027 | Endometrium | EEC | Bacterial invasion of epithelial cells | 30/1237 | 77/8465 | 1.26e-07 | 1.88e-06 | 1.40e-06 | 30 |
| hsa0513136 | Endometrium | EEC | Shigellosis | 79/1237 | 247/8465 | 1.80e-12 | 3.95e-11 | 2.95e-11 | 79 |
| hsa0510036 | Endometrium | EEC | Bacterial invasion of epithelial cells | 30/1237 | 77/8465 | 1.26e-07 | 1.88e-06 | 1.40e-06 | 30 |


