
|
|||||
|
 | |
| |
| |
| |
| |
| |
|
Gene: SEPT10 |
Gene summary for SEPT10 |
| Gene information | Species | Human | Gene symbol | SEPT10 | Gene ID | 151011 |
| Gene name | septin 10 | |
| Gene Alias | SEPT10 | |
| Cytomap | 2q13 | |
| Gene Type | protein-coding | GO ID | GO:0000910 | UniProtAcc | B7Z371 |
Top |
Malignant transformation analysis |
| Identification of the aberrant gene expression in precancerous and cancerous lesions by comparing the gene expression of stem-like cells in diseased tissues with normal stem cells |
| Entrez ID | Symbol | Replicates | Species | Organ | Tissue | Adj P-value | Log2FC | Malignancy |
| 151011 | SEPT10 | LP15 | Human | Oral cavity | LP | 1.22e-02 | 1.05e+00 | 0.2174 |
| 151011 | SEPT10 | LP17 | Human | Oral cavity | LP | 2.52e-02 | 8.23e-01 | 0.2349 |
| 151011 | SEPT10 | EOLP-1 | Human | Oral cavity | EOLP | 1.86e-04 | -2.01e-01 | -0.0202 |
| 151011 | SEPT10 | EOLP-2 | Human | Oral cavity | EOLP | 3.94e-04 | -2.01e-01 | -0.0203 |
| 151011 | SEPT10 | NEOLP-1 | Human | Oral cavity | NEOLP | 3.94e-04 | -2.01e-01 | -0.0194 |
| 151011 | SEPT10 | NEOLP-2 | Human | Oral cavity | NEOLP | 1.86e-04 | -2.01e-01 | -0.0196 |
| 151011 | SEPT10 | NEOLP-3 | Human | Oral cavity | NEOLP | 1.86e-04 | -2.01e-01 | -0.0191 |
| 151011 | SEPT10 | SYSMH1 | Human | Oral cavity | OSCC | 3.71e-19 | 5.85e-01 | 0.1127 |
| 151011 | SEPT10 | SYSMH2 | Human | Oral cavity | OSCC | 1.15e-32 | 9.78e-01 | 0.2326 |
| 151011 | SEPT10 | SYSMH3 | Human | Oral cavity | OSCC | 4.13e-25 | 6.62e-01 | 0.2442 |
| 151011 | SEPT10 | SYSMH4 | Human | Oral cavity | OSCC | 9.11e-11 | 3.21e-01 | 0.1226 |
| 151011 | SEPT10 | SYSMH5 | Human | Oral cavity | OSCC | 1.27e-04 | 2.02e-01 | 0.0647 |
| 151011 | SEPT10 | SYSMH6 | Human | Oral cavity | OSCC | 1.93e-02 | 2.59e-01 | 0.1275 |
| 151011 | SEPT10 | P1_S1_AK | Human | Skin | AK | 8.79e-12 | -2.85e-01 | -0.3399 |
| 151011 | SEPT10 | P2_S3_AK | Human | Skin | AK | 4.25e-11 | -2.85e-01 | -0.3287 |
| 151011 | SEPT10 | P2_S4_SCCIS | Human | Skin | SCCIS | 1.80e-12 | -2.85e-01 | -0.3043 |
| 151011 | SEPT10 | P3_S6_AK | Human | Skin | AK | 4.25e-11 | -2.85e-01 | -0.3256 |
| 151011 | SEPT10 | P4_S8_cSCC | Human | Skin | cSCC | 8.96e-09 | -2.85e-01 | -0.3095 |
| 151011 | SEPT10 | P5_S10_cSCC | Human | Skin | cSCC | 1.93e-11 | -2.85e-01 | -0.299 |
| 151011 | SEPT10 | P1_cSCC | Human | Skin | cSCC | 2.01e-21 | 9.85e-01 | 0.0292 |
| Page: 1 2 3 4 5 6 |
| Tissue | Expression Dynamics | Abbreviation |
| Esophagus |  | ESCC: Esophageal squamous cell carcinoma |
| HGIN: High-grade intraepithelial neoplasias | ||
| LGIN: Low-grade intraepithelial neoplasias | ||
| Liver |  | HCC: Hepatocellular carcinoma |
| NAFLD: Non-alcoholic fatty liver disease | ||
| Oral Cavity | 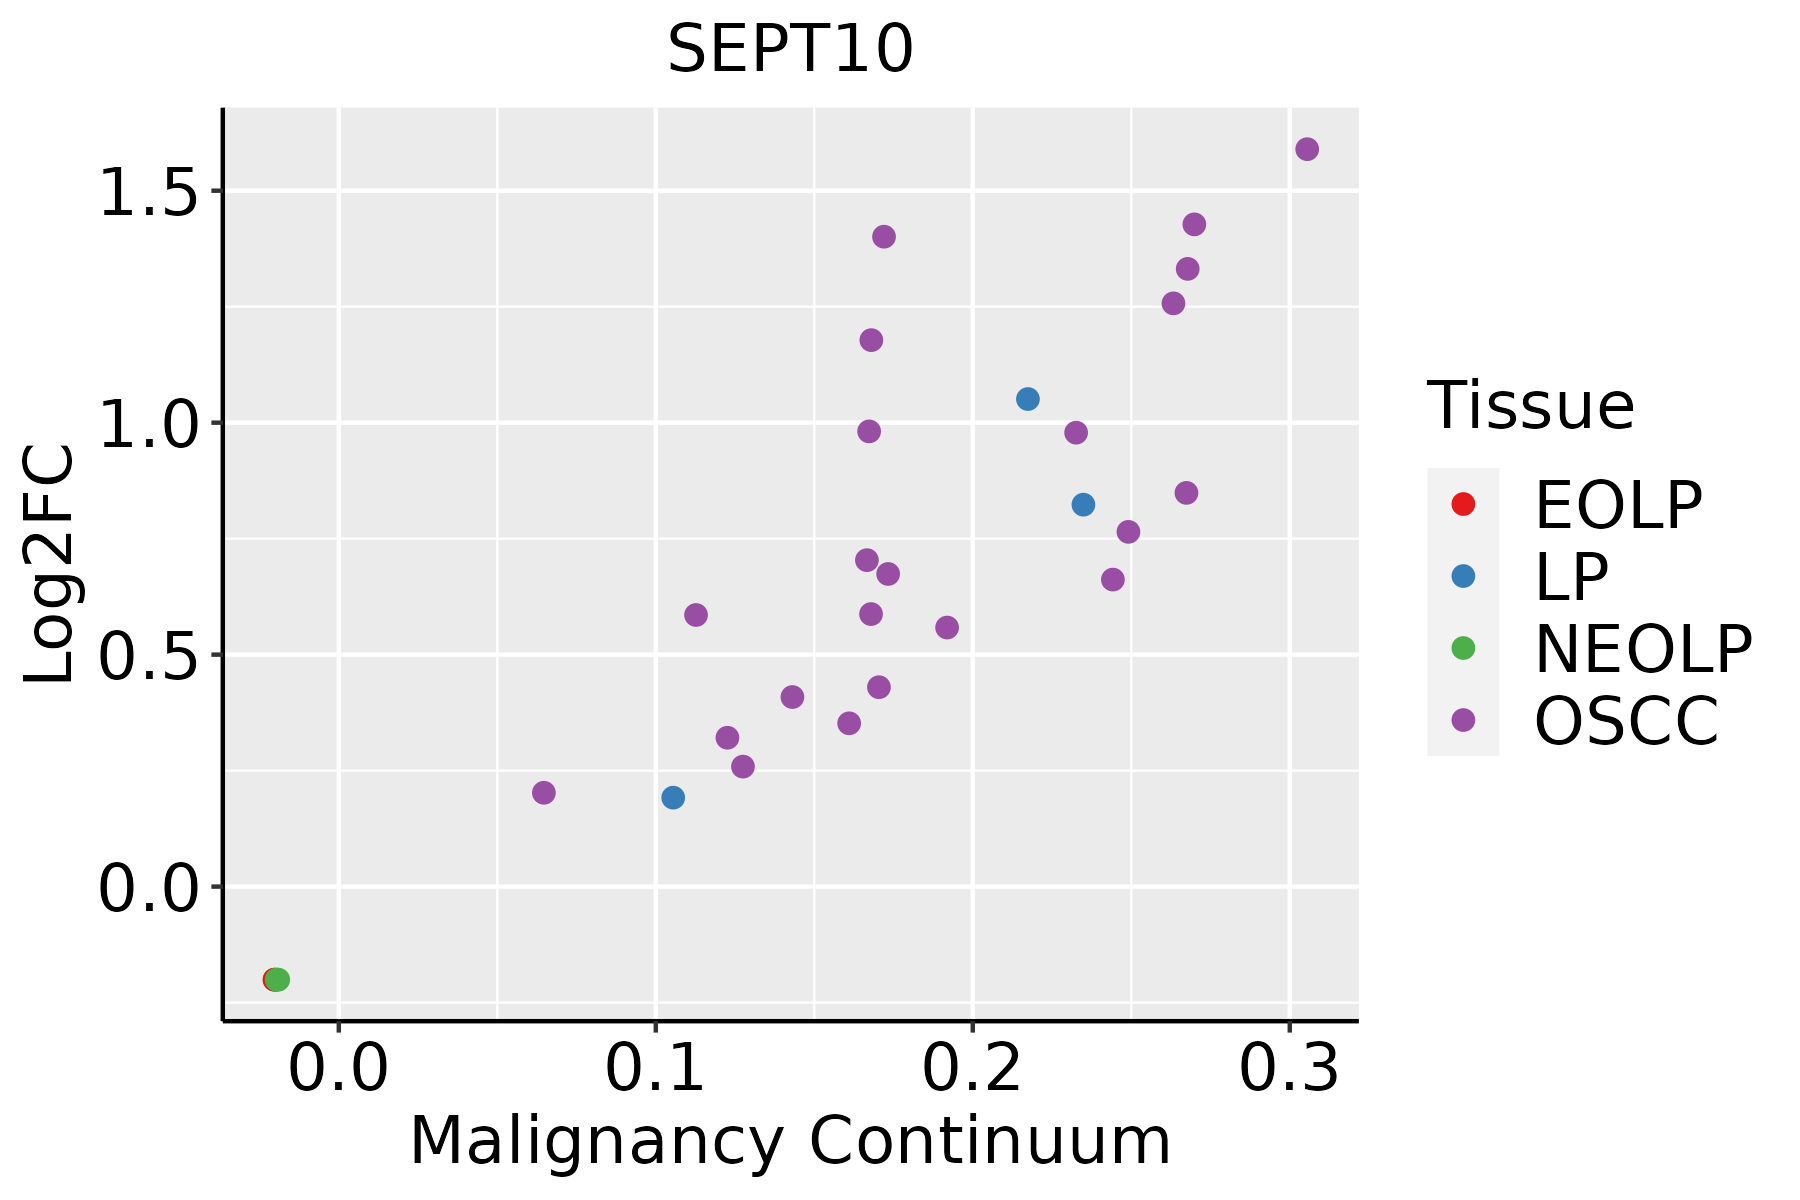 | EOLP: Erosive Oral lichen planus |
| LP: leukoplakia | ||
| NEOLP: Non-erosive oral lichen planus | ||
| OSCC: Oral squamous cell carcinoma | ||
| Skin | 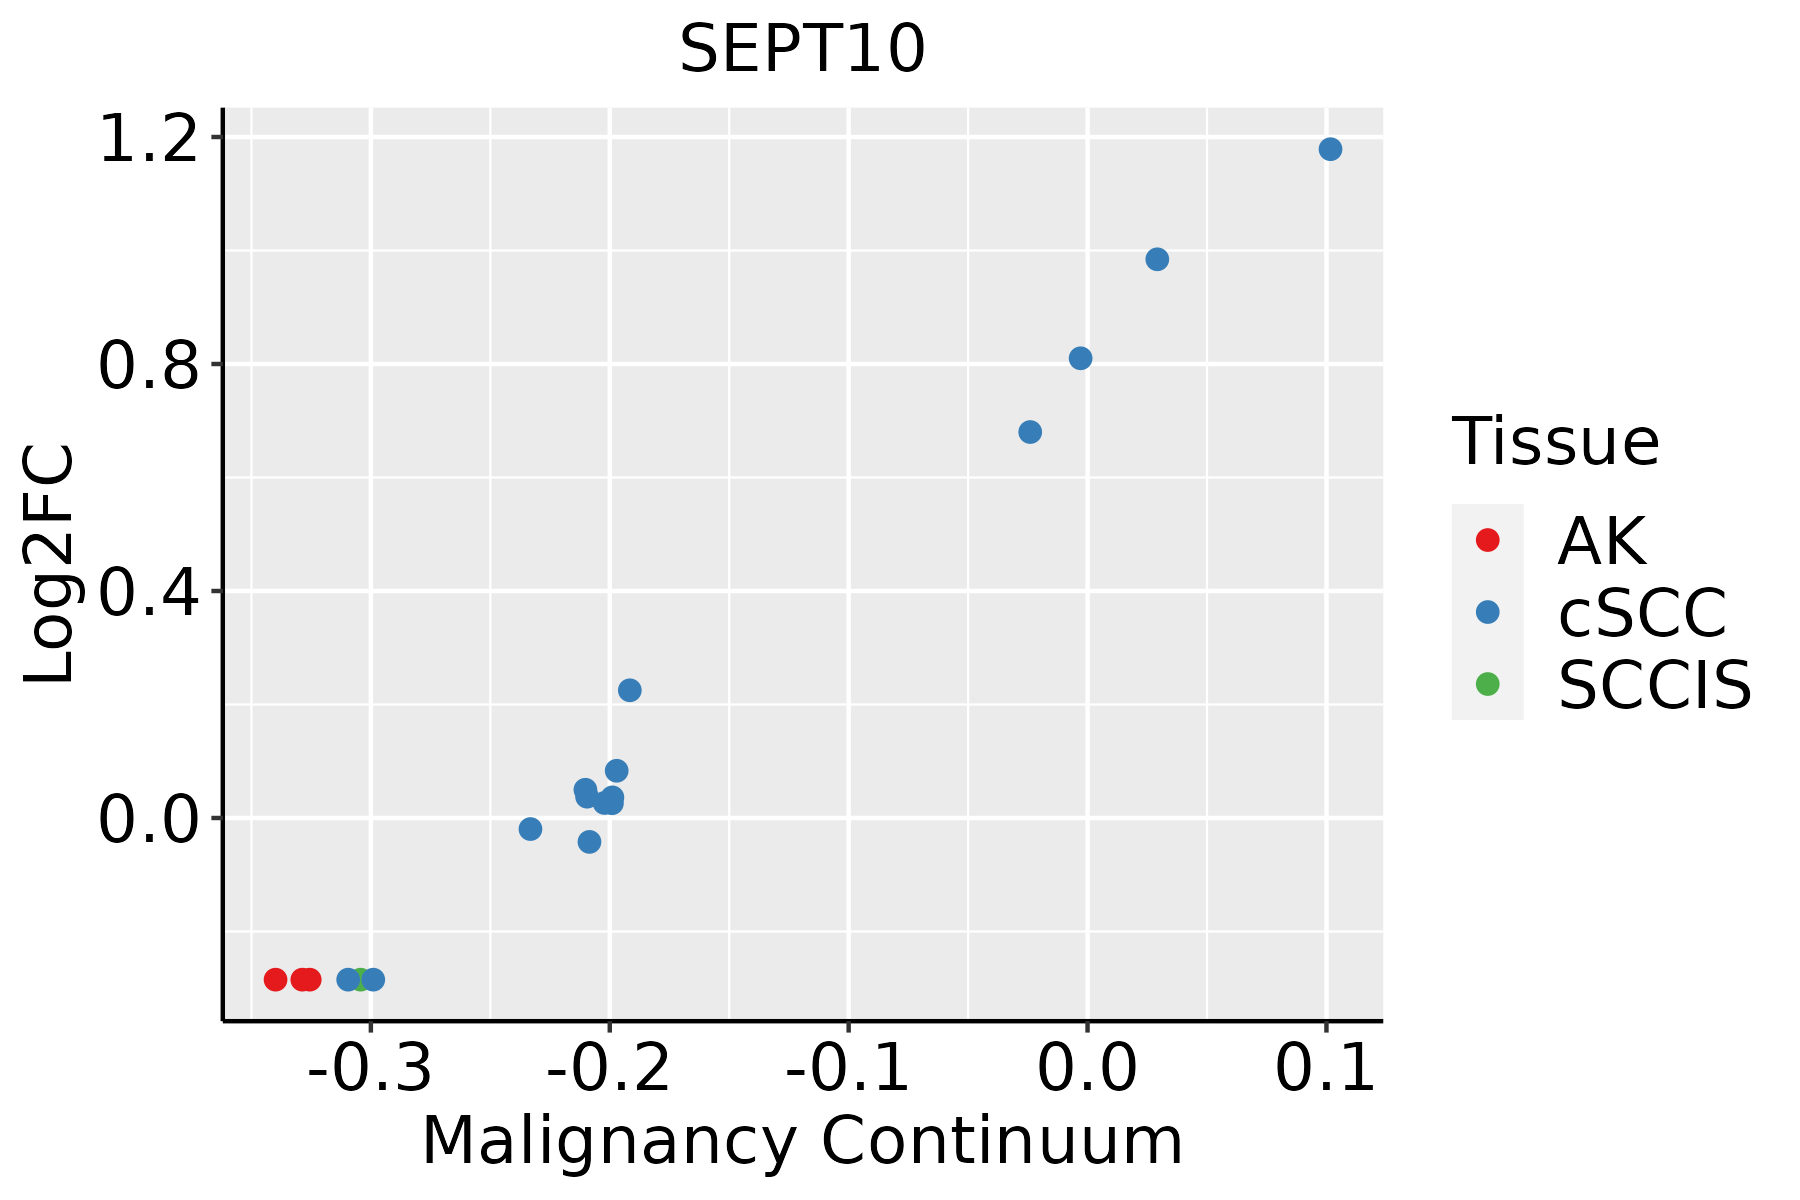 | AK: Actinic keratosis |
| cSCC: Cutaneous squamous cell carcinoma | ||
| SCCIS:squamous cell carcinoma in situ | ||
| Thyroid | 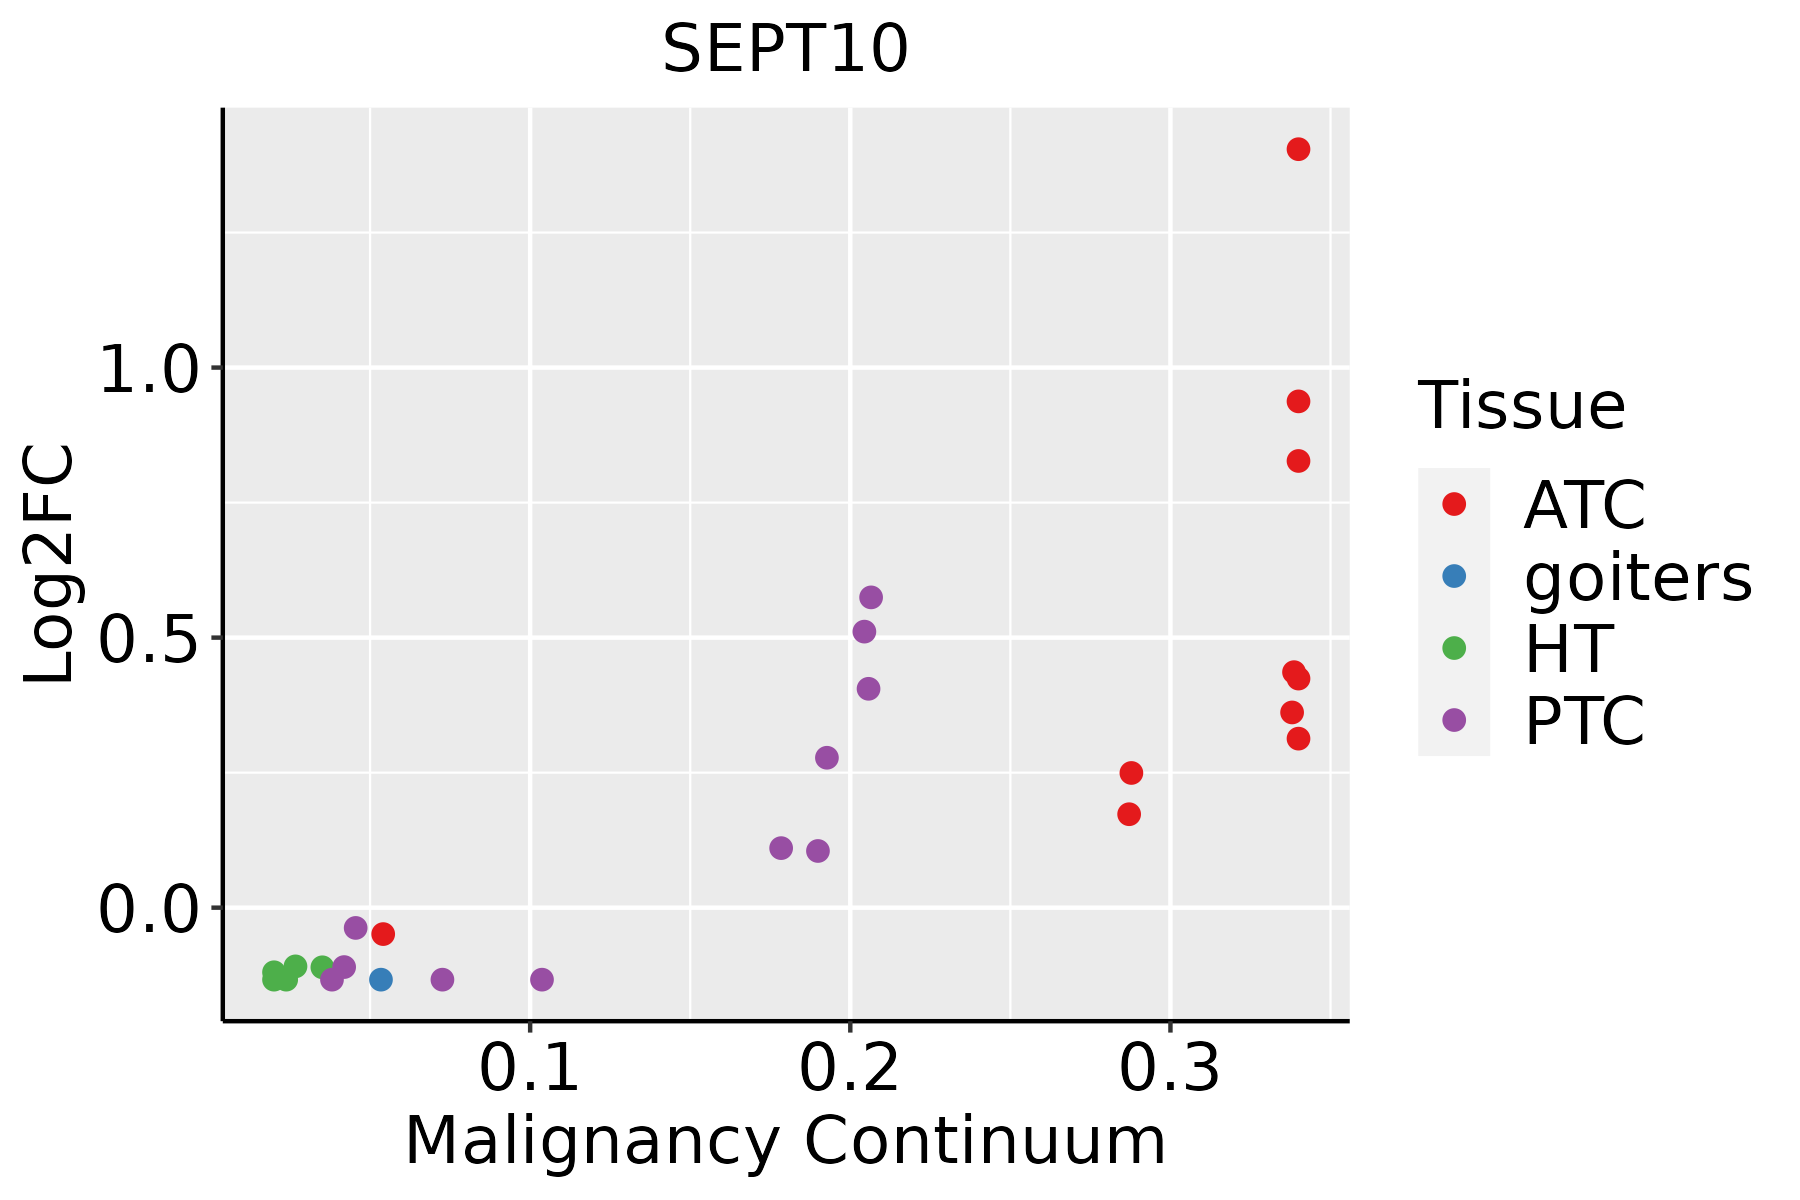 | ATC: Anaplastic thyroid cancer |
| HT: Hashimoto's thyroiditis | ||
| PTC: Papillary thyroid cancer |
| ∗log2FC in expression of this searched gene in stem-like cells from each diseased tissue sample relative to stem-like cells in normal samples in each tissue plotted against the malignancy continuum. Samples are colored based on if they are from different disease stage. |
Top |
Malignant transformation related pathway analysis |
| Find out the enriched GO biological processes and KEGG pathways involved in transition from healthy to precancer to cancer |
| Tissue | Disease Stage | Enriched GO biological Processes |
| Colorectum | AD |  |
| Colorectum | SER |  |
| Colorectum | MSS |  |
| Colorectum | MSI-H |  |
| Colorectum | FAP |  |
| ∗Top 15 enriched GO BP terms are showed in the bar plot of each disease state in each tissue. Each row represents a significant GO biological process which is colored according to the -log10(p.adjust). |
| Page: 1 2 3 4 5 6 7 8 9 |
| GO ID | Tissue | Disease Stage | Description | Gene Ratio | Bg Ratio | pvalue | p.adjust | Count |
| Page: 1 |
| Pathway ID | Tissue | Disease Stage | Description | Gene Ratio | Bg Ratio | pvalue | p.adjust | qvalue | Count |
| Page: 1 |
Top |
Cell-cell communication analysis |
| Identification of potential cell-cell interactions between two cell types and their ligand-receptor pairs for different disease states |
| Ligand | Receptor | LRpair | Pathway | Tissue | Disease Stage |
| Page: 1 |
Top |
Single-cell gene regulatory network inference analysis |
| Find out the significant the regulons (TFs) and the target genes of each regulon across cell types for different disease states |
| TF | Cell Type | Tissue | Disease Stage | Target Gene | RSS | Regulon Activity |
| ∗The dot plots of a searched regulon are shown for all cell subpopulations in each disease state of each tissue based on the regulon specific score inferred using pySCENIC and by calculating the average expression. |
| Page: 1 |
Top |
Somatic mutation of malignant transformation related genes |
| Annotation of somatic variants for genes involved in malignant transformation |
| Hugo Symbol | Variant Class | Variant Classification | dbSNP RS | HGVSc | HGVSp | HGVSp Short | SWISSPROT | BIOTYPE | SIFT | PolyPhen | Tumor Sample Barcode | Tissue | Histology | Sex | Age | Stage | Therapy Types | Drugs | Outcome |
| SEPT10 | SNV | Missense_Mutation | novel | c.1177G>A | p.Glu393Lys | p.E393K | protein_coding | tolerated(0.06) | possibly_damaging(0.887) | TCGA-5L-AAT1-01 | Breast | breast invasive carcinoma | Female | <65 | III/IV | Hormone Therapy | letrozol | SD | |
| SEPT10 | SNV | Missense_Mutation | rs200598502 | c.1555N>G | p.Phe519Val | p.F519V | protein_coding | tolerated_low_confidence(0.14) | benign(0.003) | TCGA-A1-A0SD-01 | Breast | breast invasive carcinoma | Female | <65 | I/II | Unknown | Unknown | SD | |
| SEPT10 | SNV | Missense_Mutation | rs200598502 | c.1555T>G | p.Phe519Val | p.F519V | protein_coding | tolerated_low_confidence(0.14) | benign(0.003) | TCGA-A8-A097-01 | Breast | breast invasive carcinoma | Female | >=65 | I/II | Hormone Therapy | tamoxiphen | SD | |
| SEPT10 | SNV | Missense_Mutation | novel | c.1292N>C | p.His431Pro | p.H431P | protein_coding | deleterious(0.04) | benign(0) | TCGA-A8-A0A2-01 | Breast | breast invasive carcinoma | Female | >=65 | I/II | Hormone Therapy | tamoxiphen | SD | |
| SEPT10 | SNV | Missense_Mutation | c.104N>T | p.Arg35Ile | p.R35I | protein_coding | tolerated(0.07) | benign(0.169) | TCGA-AO-A03T-01 | Breast | breast invasive carcinoma | Female | <65 | I/II | Chemotherapy | cyclophosphamide | SD | ||
| SEPT10 | SNV | Missense_Mutation | rs200598502 | c.1555N>G | p.Phe519Val | p.F519V | protein_coding | tolerated_low_confidence(0.14) | benign(0.003) | TCGA-B6-A0IC-01 | Breast | breast invasive carcinoma | Female | >=65 | I/II | Unknown | Unknown | SD | |
| SEPT10 | SNV | Missense_Mutation | rs200598502 | c.1555T>G | p.Phe519Val | p.F519V | protein_coding | tolerated_low_confidence(0.14) | benign(0.003) | TCGA-B6-A0RT-01 | Breast | breast invasive carcinoma | Female | <65 | III/IV | Unknown | Unknown | SD | |
| SEPT10 | SNV | Missense_Mutation | rs200598502 | c.1555T>G | p.Phe519Val | p.F519V | protein_coding | tolerated_low_confidence(0.14) | benign(0.003) | TCGA-BH-A0C7-01 | Breast | breast invasive carcinoma | Female | <65 | I/II | Chemotherapy | adriamycin | CR | |
| SEPT10 | SNV | Missense_Mutation | rs200598502 | c.1555N>G | p.Phe519Val | p.F519V | protein_coding | tolerated_low_confidence(0.14) | benign(0.003) | TCGA-BH-A0DE-01 | Breast | breast invasive carcinoma | Female | <65 | I/II | Unknown | Unknown | SD | |
| SEPT10 | SNV | Missense_Mutation | rs200598502 | c.1555T>G | p.Phe519Val | p.F519V | protein_coding | tolerated_low_confidence(0.14) | benign(0.003) | TCGA-C8-A12M-01 | Breast | breast invasive carcinoma | Female | >=65 | I/II | Unknown | Unknown | SD |
| Page: 1 2 3 4 5 6 |
Top |
Related drugs of malignant transformation related genes |
| Identification of chemicals and drugs interact with genes involved in malignant transfromation |
| (DGIdb 4.0) |
| Entrez ID | Symbol | Category | Interaction Types | Drug Claim Name | Drug Name | PMIDs |
| Page: 1 |

Copyright 2023-Present -The University of Texas Health Science Center at Houston |