Schematic overview of the cellular and molecular mechanisms involved in the cancer progression, including the proposed cellular and molecular mechanisms in cancer cells trajectory. AT1: alveolar type 1 cells; AT2: alveolar type 2 cells; AAH: atypical adenomatous hyperplasia; AIS: adenocarcinoma in situ; MIA: minimally invasive adenocarcinoma; IA: invasive adenocarcinoma; EMT: epithelial-mesenchymal transition

Home

Download

Statistics

Help

Contact

Center for Computational Systems Medicine
leaf

Gene summary

leaf

Malignant transformation analysis

leaf

Malignant transformation related pathway analysis

leaf

Cell-cell communication analysis

leaf

Single-cell gene regulatory network inference analysis

leaf

Somatic mutation of malignant transformation related genes

leaf

Related drugs of malignant transformation related genes

Gene: SEC14L1

Gene summary for SEC14L1

check button Gene summary.

Gene informationSpeciesHuman
Gene symbol

SEC14L1

Gene ID

6397

Gene nameSEC14 like lipid binding 1
Gene AliasPRELID4A
Cytomap17q25.2-q25.3
Gene Typeprotein-coding
GO ID

GO:0002221

UniProtAcc

A5PLM6


Top

Malignant transformation analysis

check button Identification of the aberrant gene expression in precancerous and cancerous lesions by comparing the gene expression of stem-like cells in diseased tissues with normal stem cells
check button Malignant transformation involving gene list.
Entrez IDSymbolReplicatesSpeciesOrganTissueAdj P-valueLog2FCMalignancy
6397SEC14L1S028HumanLiverHCC6.95e-188.09e-010.2503
6397SEC14L1S029HumanLiverHCC6.45e-169.49e-010.2581
6397SEC14L1C04HumanOral cavityOSCC1.16e-095.44e-010.2633
6397SEC14L1C21HumanOral cavityOSCC4.06e-196.00e-010.2678
6397SEC14L1C30HumanOral cavityOSCC3.91e-391.51e+000.3055
6397SEC14L1C38HumanOral cavityOSCC5.92e-087.20e-010.172
6397SEC14L1C51HumanOral cavityOSCC7.45e-094.91e-010.2674
6397SEC14L1C57HumanOral cavityOSCC4.05e-052.61e-010.1679
6397SEC14L1C06HumanOral cavityOSCC2.00e-026.94e-010.2699
6397SEC14L1C08HumanOral cavityOSCC2.79e-154.53e-010.1919
6397SEC14L1C09HumanOral cavityOSCC3.09e-052.90e-010.1431
6397SEC14L1EOLP-1HumanOral cavityEOLP5.95e-031.95e-01-0.0202
6397SEC14L1SYSMH1HumanOral cavityOSCC8.98e-042.24e-010.1127
6397SEC14L1SYSMH3HumanOral cavityOSCC1.36e-063.44e-010.2442
6397SEC14L1GSM5252135_BPH511PrPUr_Fcol_3GEXHumanProstateBPH3.36e-053.99e-01-0.1833
6397SEC14L1047563_1562-all-cellsHumanProstateBPH1.33e-052.04e-010.0791
6397SEC14L1048752_1579-all-cellsHumanProstateBPH4.12e-022.49e-010.1008
6397SEC14L1052097_1595-all-cellsHumanProstateBPH3.15e-042.33e-010.0972
6397SEC14L1052099_1652-all-cellsHumanProstateBPH2.59e-042.26e-010.1038
6397SEC14L1Dong_P1HumanProstateTumor4.30e-141.36e-010.035
Page: 1 2 3 4 5 6 

check button Transcriptomic changes along malignancy continuum.
TissueExpression DynamicsAbbreviation
EndometriumThe image shows the transcriptomic changes along malignancy continuum.log2FC in expression of this searched gene in stem-like cells from each diseased tissue sample relative to stem-like cells in normal samples in each tissue plotted against the malignancy continuum. Samples are colored based on if they are from different disease stage.AEH: Atypical endometrial hyperplasia
EEC: Endometrioid Cancer
EsophagusThe image shows the transcriptomic changes along malignancy continuum.log2FC in expression of this searched gene in stem-like cells from each diseased tissue sample relative to stem-like cells in normal samples in each tissue plotted against the malignancy continuum. Samples are colored based on if they are from different disease stage.ESCC: Esophageal squamous cell carcinoma
HGIN: High-grade intraepithelial neoplasias
LGIN: Low-grade intraepithelial neoplasias
LiverThe image shows the transcriptomic changes along malignancy continuum.log2FC in expression of this searched gene in stem-like cells from each diseased tissue sample relative to stem-like cells in normal samples in each tissue plotted against the malignancy continuum. Samples are colored based on if they are from different disease stage.
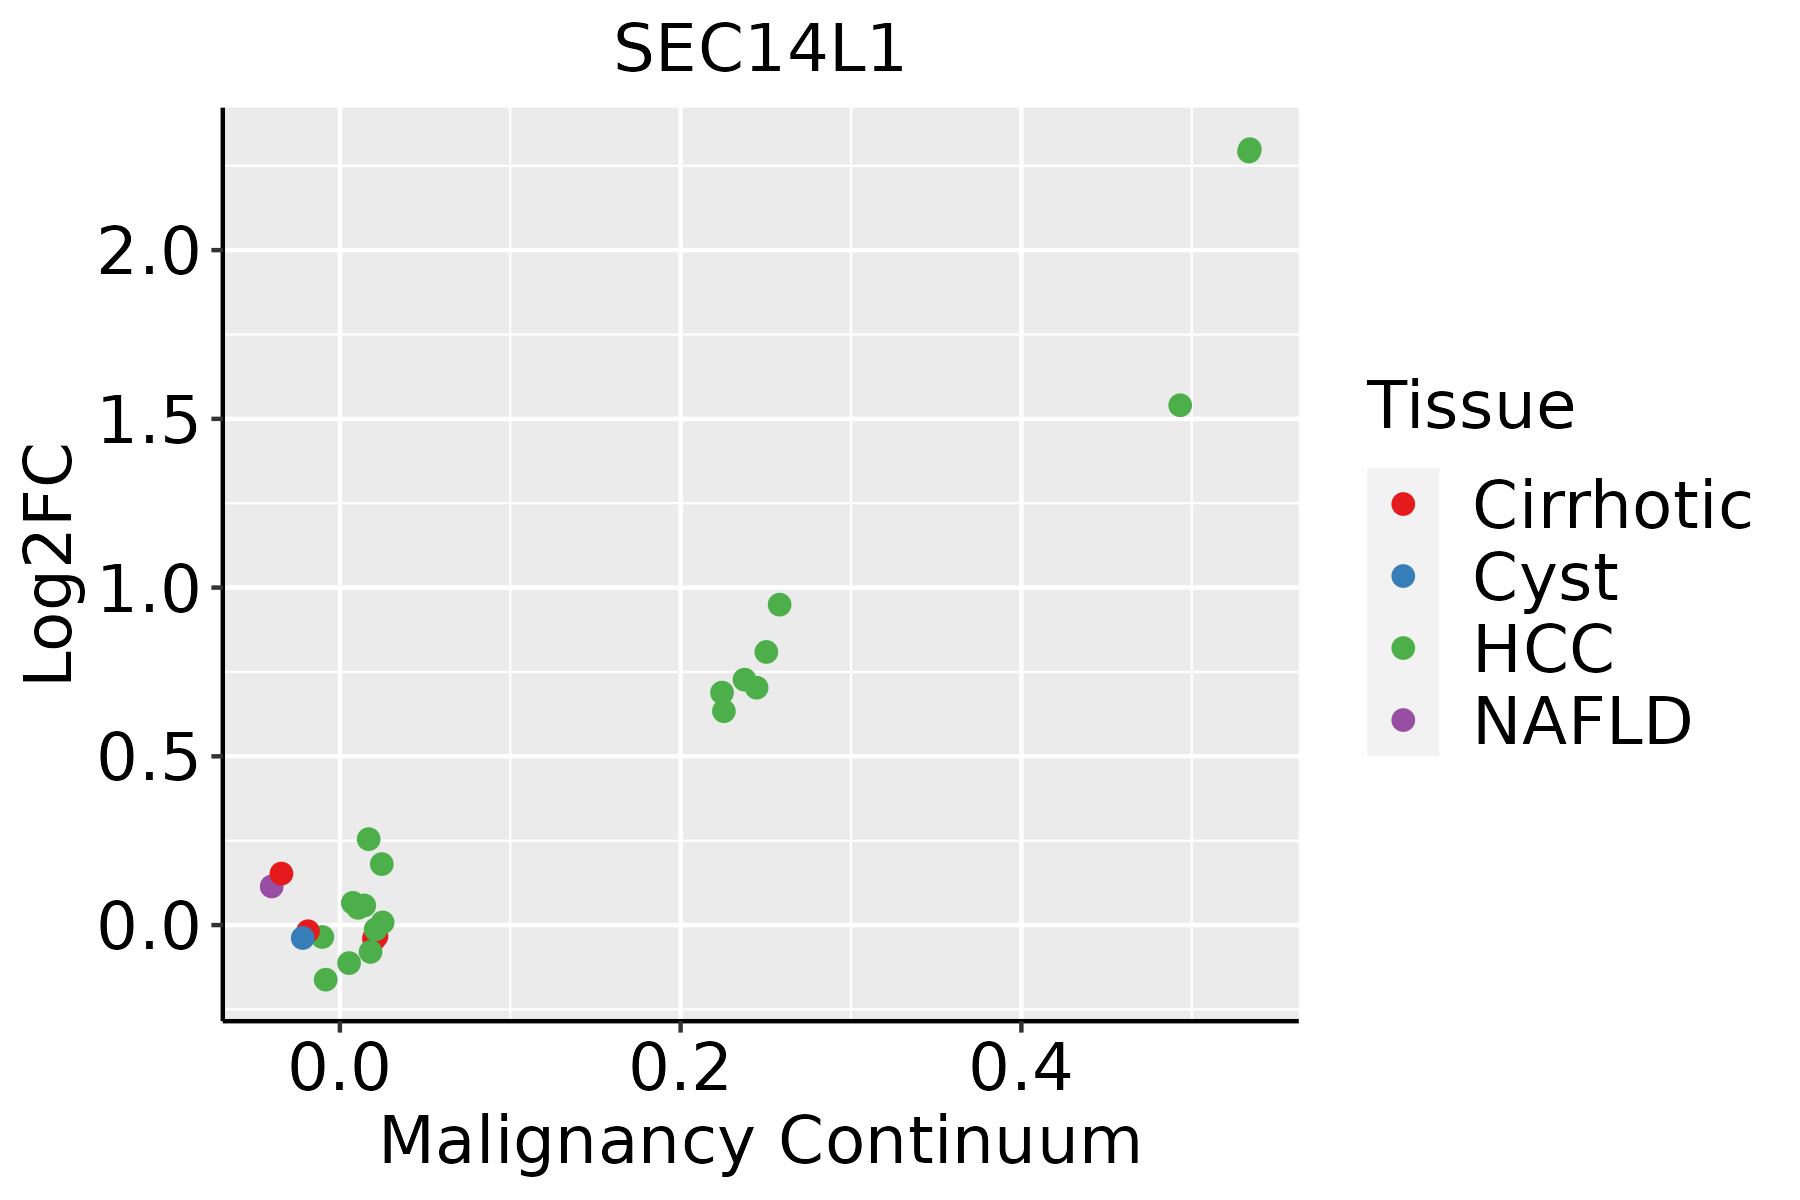
HCC: Hepatocellular carcinoma
NAFLD: Non-alcoholic fatty liver disease
Oral CavityThe image shows the transcriptomic changes along malignancy continuum.log2FC in expression of this searched gene in stem-like cells from each diseased tissue sample relative to stem-like cells in normal samples in each tissue plotted against the malignancy continuum. Samples are colored based on if they are from different disease stage.EOLP: Erosive Oral lichen planus
LP: leukoplakia
NEOLP: Non-erosive oral lichen planus
OSCC: Oral squamous cell carcinoma
ProstateThe image shows the transcriptomic changes along malignancy continuum.log2FC in expression of this searched gene in stem-like cells from each diseased tissue sample relative to stem-like cells in normal samples in each tissue plotted against the malignancy continuum. Samples are colored based on if they are from different disease stage.
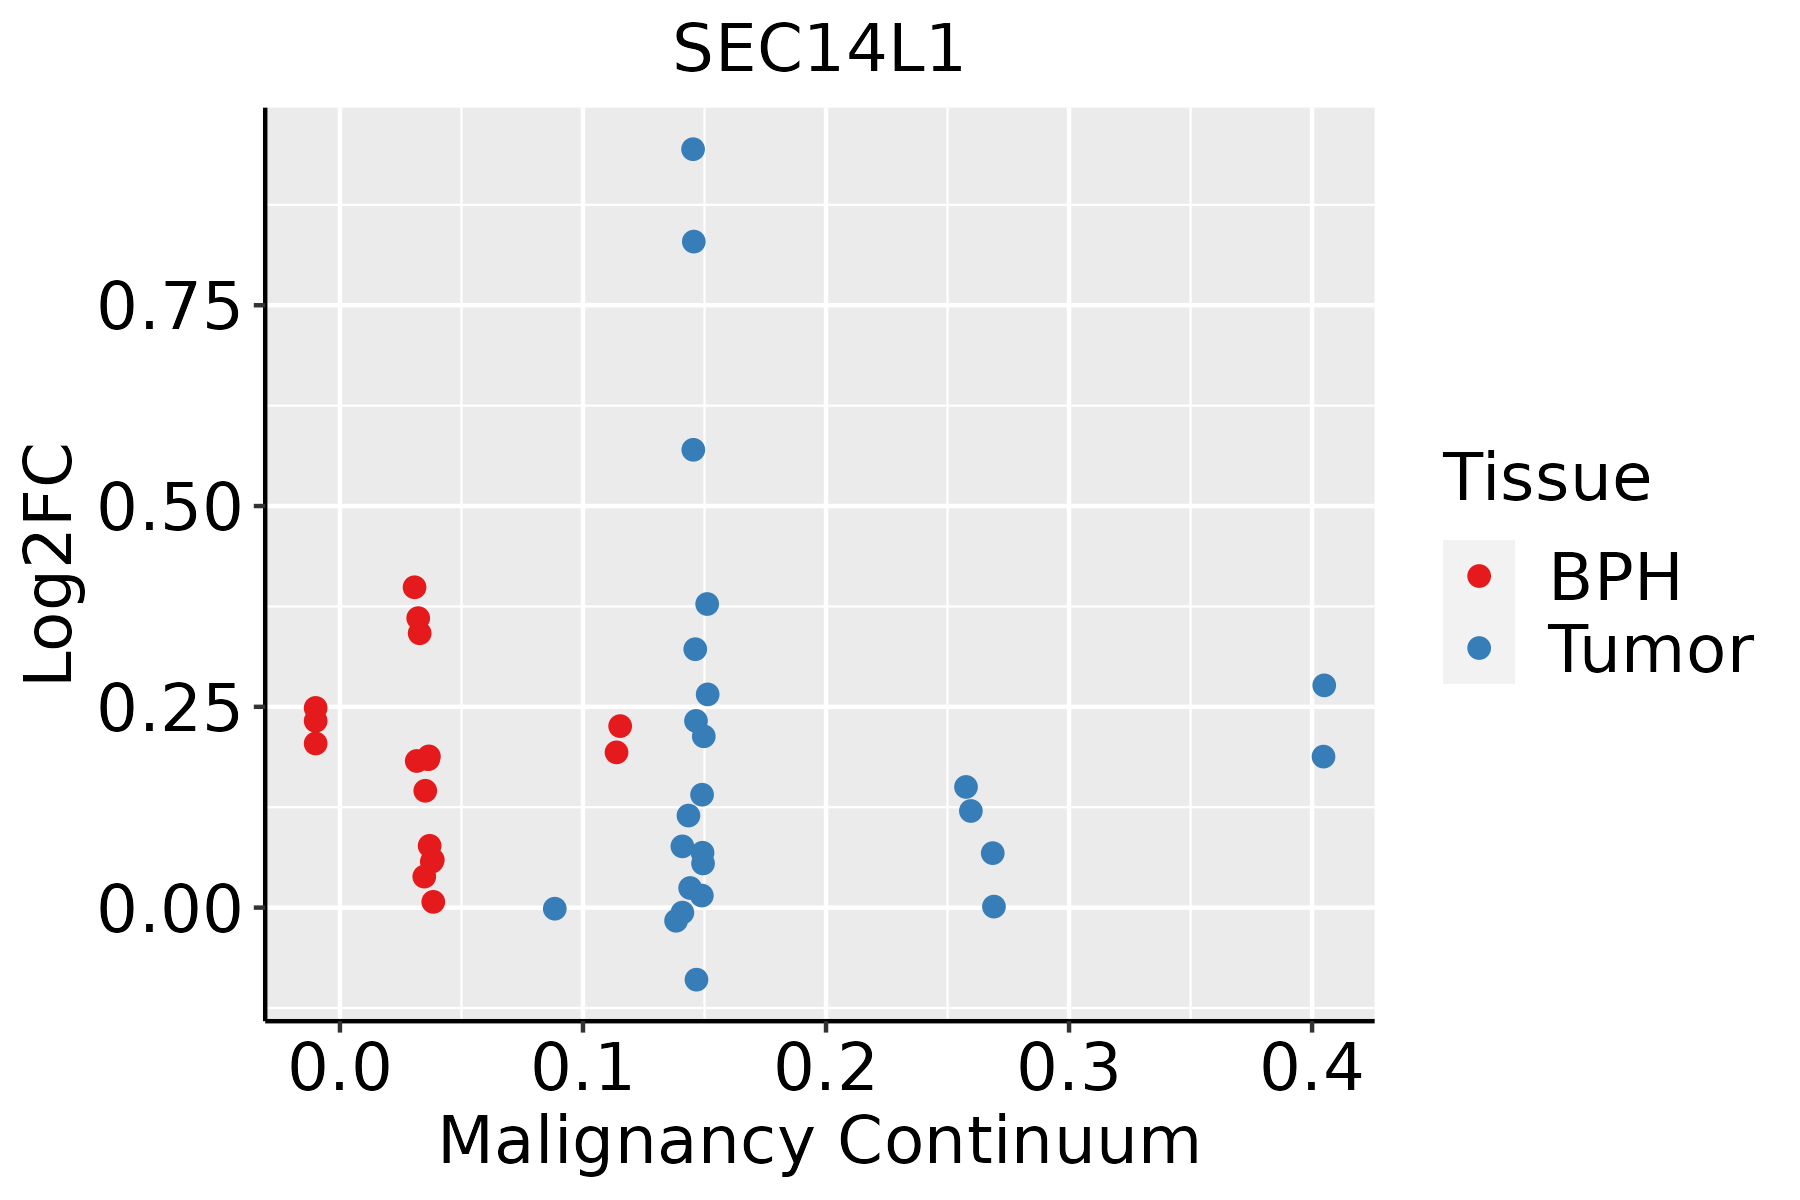
BPH: Benign Prostatic Hyperplasia
ThyroidThe image shows the transcriptomic changes along malignancy continuum.log2FC in expression of this searched gene in stem-like cells from each diseased tissue sample relative to stem-like cells in normal samples in each tissue plotted against the malignancy continuum. Samples are colored based on if they are from different disease stage.
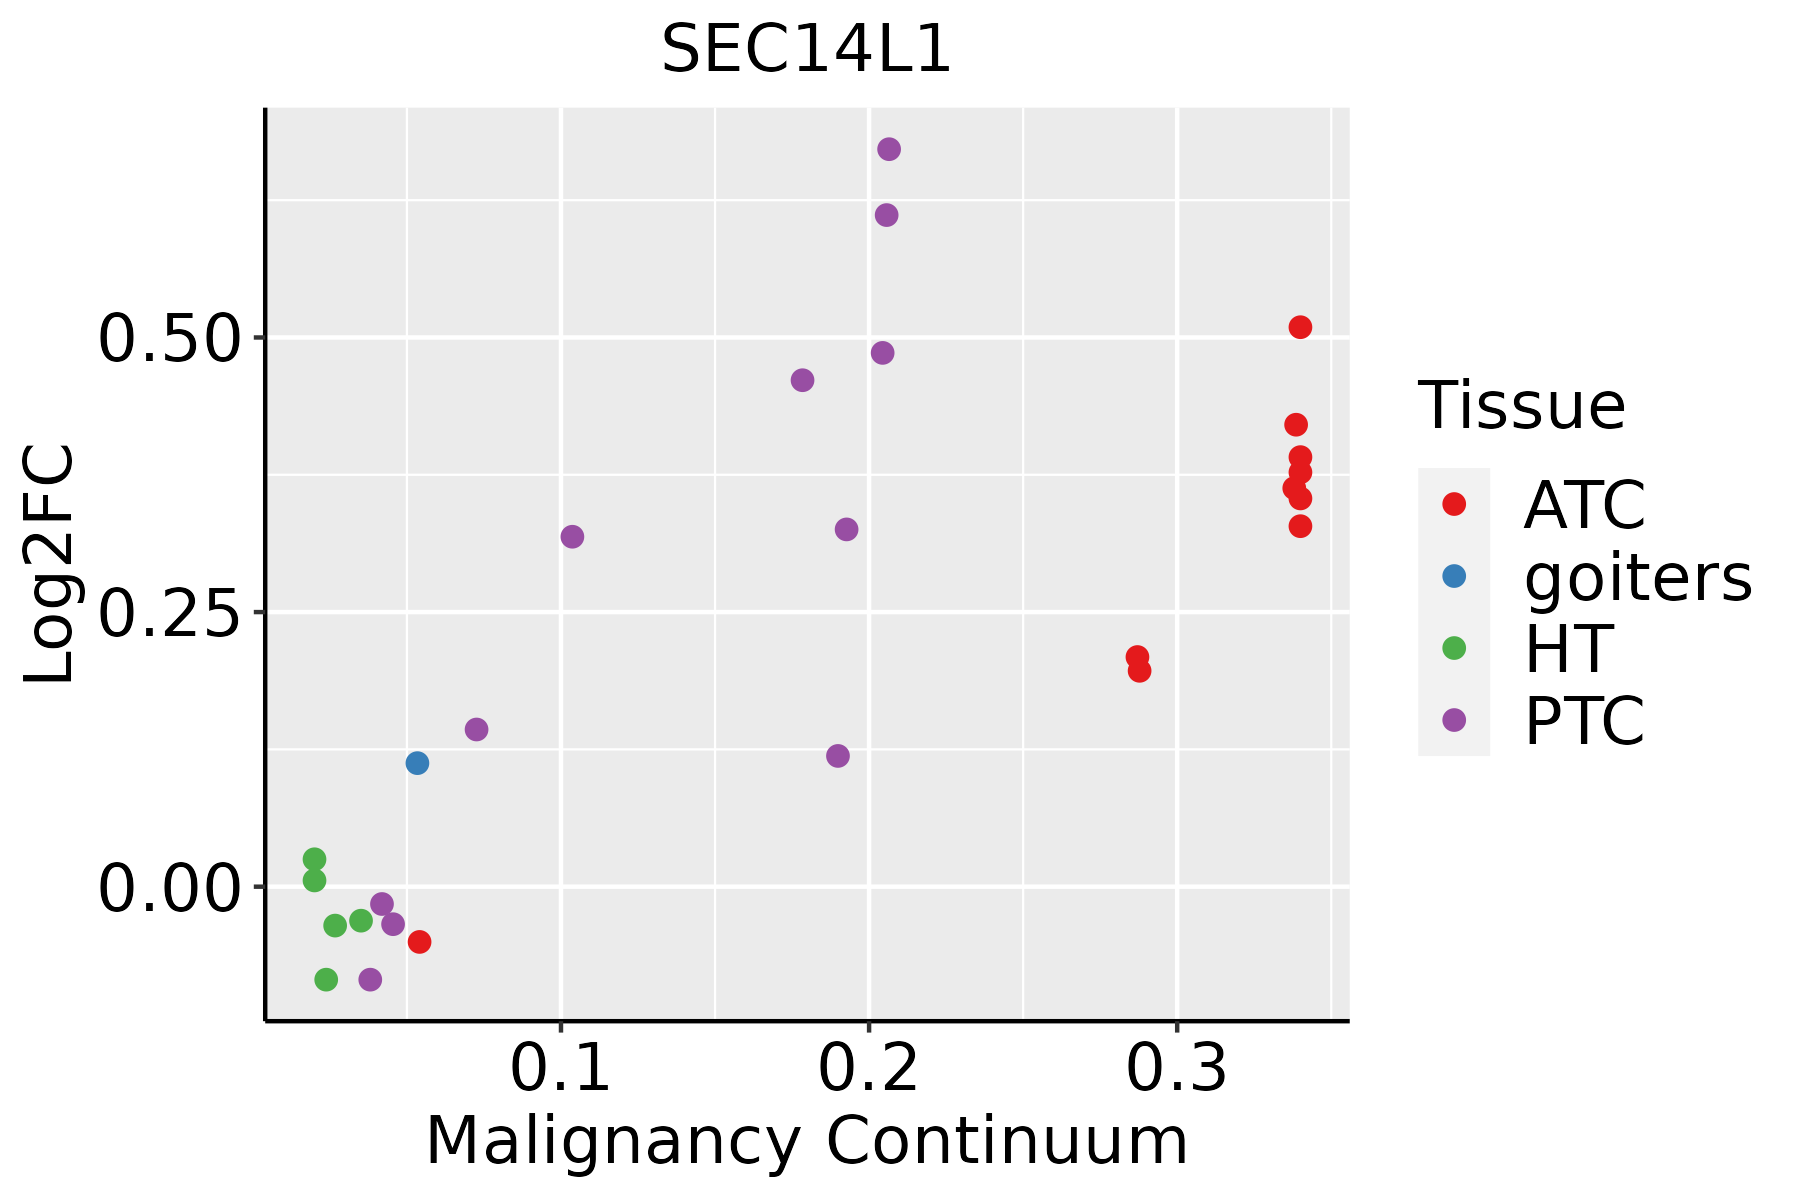
ATC: Anaplastic thyroid cancer
HT: Hashimoto's thyroiditis
PTC: Papillary thyroid cancer
∗log2FC in expression of this searched gene in stem-like cells from each diseased tissue sample relative to stem-like cells in normal samples in each tissue plotted against the malignancy continuum. Samples are colored based on if they are from different disease stage.

Top

Malignant transformation related pathway analysis

check buttonFind out the enriched GO biological processes and KEGG pathways involved in transition from healthy to precancer to cancer
check button Figure of enriched GO biological processes.
TissueDisease StageEnriched GO biological Processes
ColorectumADGO analysis - Figure of enriched GO biological processes: Top 15 enriched GO BP terms are showed in the bar plot of each disease state in each tissue. Each row represents a significant GO biological process which is colored according to the -log10(p.adjust).
ColorectumSERGO analysis - Figure of enriched GO biological processes: Top 15 enriched GO BP terms are showed in the bar plot of each disease state in each tissue. Each row represents a significant GO biological process which is colored according to the -log10(p.adjust).
ColorectumMSSGO analysis - Figure of enriched GO biological processes: Top 15 enriched GO BP terms are showed in the bar plot of each disease state in each tissue. Each row represents a significant GO biological process which is colored according to the -log10(p.adjust).
ColorectumMSI-HGO analysis - Figure of enriched GO biological processes: Top 15 enriched GO BP terms are showed in the bar plot of each disease state in each tissue. Each row represents a significant GO biological process which is colored according to the -log10(p.adjust).
ColorectumFAPGO analysis - Figure of enriched GO biological processes: Top 15 enriched GO BP terms are showed in the bar plot of each disease state in each tissue. Each row represents a significant GO biological process which is colored according to the -log10(p.adjust).
∗Top 15 enriched GO BP terms are showed in the bar plot of each disease state in each tissue. Each row represents a significant GO biological process which is colored according to the -log10(p.adjust).
Page: 1 2 3 4 5 6 7 8 9 

check button Enriched GO biological processes.
GO IDTissueDisease StageDescriptionGene RatioBg Ratiopvaluep.adjustCount
GO:003052210EndometriumAEHintracellular receptor signaling pathway60/2100265/187237.16e-083.77e-0660
GO:00395293EndometriumAEHRIG-I signaling pathway11/210027/187238.09e-051.21e-0311
GO:00395353EndometriumAEHregulation of RIG-I signaling pathway9/210020/187231.46e-041.94e-039
GO:00027535EndometriumAEHcytoplasmic pattern recognition receptor signaling pathway17/210060/187232.25e-042.75e-0317
GO:00096159EndometriumAEHresponse to virus63/2100367/187233.81e-044.10e-0363
GO:00027645EndometriumAEHimmune response-regulating signaling pathway76/2100468/187235.76e-045.71e-0376
GO:00395312EndometriumAEHregulation of viral-induced cytoplasmic pattern recognition receptor signaling pathway9/210024/187237.48e-047.12e-039
GO:00985864EndometriumAEHcellular response to virus20/210084/187238.14e-047.66e-0320
GO:00395282EndometriumAEHcytoplasmic pattern recognition receptor signaling pathway in response to virus11/210034/187238.45e-047.82e-0311
GO:00622074EndometriumAEHregulation of pattern recognition receptor signaling pathway23/2100105/187231.19e-031.02e-0223
GO:00026838EndometriumAEHnegative regulation of immune system process69/2100434/187231.76e-031.41e-0269
GO:00022213EndometriumAEHpattern recognition receptor signaling pathway31/2100172/187235.16e-033.23e-0231
GO:003052215EndometriumEECintracellular receptor signaling pathway65/2168265/187232.52e-091.96e-0765
GO:000275311EndometriumEECcytoplasmic pattern recognition receptor signaling pathway20/216860/187237.27e-061.67e-0420
GO:003952911EndometriumEECRIG-I signaling pathway11/216827/187231.08e-041.49e-0311
GO:000961513EndometriumEECresponse to virus66/2168367/187231.78e-042.20e-0366
GO:003953511EndometriumEECregulation of RIG-I signaling pathway9/216820/187231.87e-042.27e-039
GO:000276412EndometriumEECimmune response-regulating signaling pathway80/2168468/187232.20e-042.64e-0380
GO:003953111EndometriumEECregulation of viral-induced cytoplasmic pattern recognition receptor signaling pathway9/216824/187239.45e-048.45e-039
GO:000268313EndometriumEECnegative regulation of immune system process72/2168434/187231.04e-039.13e-0372
Page: 1 2 3 4 5 6 7 

check button Enriched KEGG pathways.
Pathway IDTissueDisease StageDescriptionGene RatioBg Ratiopvaluep.adjustqvalueCount
Page: 1 

Top

Cell-cell communication analysis

check buttonIdentification of potential cell-cell interactions between two cell types and their ligand-receptor pairs for different disease states
LigandReceptorLRpairPathwayTissueDisease Stage
Page: 1 

Top

Single-cell gene regulatory network inference analysis

check buttonFind out the significant the regulons (TFs) and the target genes of each regulon across cell types for different disease states
TFCell TypeTissueDisease StageTarget GeneRSSRegulon Activity
∗The dot plots of a searched regulon are shown for all cell subpopulations in each disease state of each tissue based on the regulon specific score inferred using pySCENIC and by calculating the average expression.
Page: 1 

Top

Somatic mutation of malignant transformation related genes

check buttonAnnotation of somatic variants for genes involved in malignant transformation
Hugo SymbolVariant ClassVariant ClassificationdbSNP RSHGVScHGVSpHGVSp ShortSWISSPROTBIOTYPESIFTPolyPhenTumor Sample BarcodeTissueHistologySexAgeStageTherapy TypesDrugsOutcome
SEC14L1SNVMissense_Mutationc.488N>Cp.Ile163Thrp.I163TQ92503protein_codingdeleterious(0)probably_damaging(0.982)TCGA-BH-A18G-01Breastbreast invasive carcinomaFemale>=65I/IIUnknownUnknownSD
SEC14L1SNVMissense_Mutationc.841N>Gp.Leu281Valp.L281VQ92503protein_codingdeleterious(0.02)possibly_damaging(0.858)TCGA-C8-A1HM-01Breastbreast invasive carcinomaFemale>=65I/IIChemotherapydoxorubicinCR
SEC14L1SNVMissense_Mutationnovelc.481N>Ap.Glu161Lysp.E161KQ92503protein_codingdeleterious(0)probably_damaging(0.992)TCGA-2W-A8YY-01Cervixcervical & endocervical cancerFemale<65I/IIChemotherapycisplatinCR
SEC14L1SNVMissense_Mutationnovelc.935N>Gp.Tyr312Cysp.Y312CQ92503protein_codingtolerated(0.17)benign(0.018)TCGA-2W-A8YY-01Cervixcervical & endocervical cancerFemale<65I/IIChemotherapycisplatinCR
SEC14L1SNVMissense_Mutationrs773798440c.2026N>Ap.Gly676Serp.G676SQ92503protein_codingtolerated(0.57)benign(0.003)TCGA-2W-A8YY-01Cervixcervical & endocervical cancerFemale<65I/IIChemotherapycisplatinCR
SEC14L1SNVMissense_Mutationrs752687715c.1528N>Ap.Glu510Lysp.E510KQ92503protein_codingtolerated(0.07)possibly_damaging(0.738)TCGA-EA-A3QE-01Cervixcervical & endocervical cancerFemale<65I/IIUnknownUnknownSD
SEC14L1SNVMissense_Mutationnovelc.2122N>Tp.His708Tyrp.H708YQ92503protein_codingtolerated(1)benign(0.271)TCGA-EA-A410-01Cervixcervical & endocervical cancerFemale<65I/IIUnknownUnknownSD
SEC14L1SNVMissense_Mutationnovelc.135N>Gp.Phe45Leup.F45LQ92503protein_codingtolerated(0.63)benign(0.015)TCGA-UC-A7PD-01Cervixcervical & endocervical cancerFemale<65I/IIUnknownUnknownPD
SEC14L1SNVMissense_Mutationrs375335873c.2098N>Ap.Ala700Thrp.A700TQ92503protein_codingtolerated(0.24)benign(0.39)TCGA-VS-A94Z-01Cervixcervical & endocervical cancerFemale<65I/IIChemotherapycisplatinCR
SEC14L1SNVMissense_Mutationnovelc.539N>Ap.Arg180Hisp.R180HQ92503protein_codingdeleterious(0.03)probably_damaging(0.923)TCGA-A6-3810-01Colorectumcolon adenocarcinomaMale<65I/IIUnknownUnknownSD
Page: 1 2 3 4 5 6 7 8 

Top

Related drugs of malignant transformation related genes

check buttonIdentification of chemicals and drugs interact with genes involved in malignant transfromation
(DGIdb 4.0)
Entrez IDSymbolCategoryInteraction TypesDrug Claim NameDrug NamePMIDs
Page: 1