
|
|||||
|
 | |
| |
| |
| |
| |
| |
|
Gene: SDF4 |
Gene summary for SDF4 |
| Gene information | Species | Human | Gene symbol | SDF4 | Gene ID | 51150 |
| Gene name | stromal cell derived factor 4 | |
| Gene Alias | Cab45 | |
| Cytomap | 1p36.33 | |
| Gene Type | protein-coding | GO ID | GO:0006810 | UniProtAcc | A0A024R084 |
Top |
Malignant transformation analysis |
| Identification of the aberrant gene expression in precancerous and cancerous lesions by comparing the gene expression of stem-like cells in diseased tissues with normal stem cells |
| Entrez ID | Symbol | Replicates | Species | Organ | Tissue | Adj P-value | Log2FC | Malignancy |
| 51150 | SDF4 | P37T-E | Human | Esophagus | ESCC | 8.83e-76 | 1.90e+00 | 0.1371 |
| 51150 | SDF4 | P38T-E | Human | Esophagus | ESCC | 3.46e-13 | 4.52e-01 | 0.127 |
| 51150 | SDF4 | P39T-E | Human | Esophagus | ESCC | 1.71e-45 | 8.83e-01 | 0.0894 |
| 51150 | SDF4 | P40T-E | Human | Esophagus | ESCC | 8.10e-46 | 1.61e+00 | 0.109 |
| 51150 | SDF4 | P42T-E | Human | Esophagus | ESCC | 1.35e-49 | 1.24e+00 | 0.1175 |
| 51150 | SDF4 | P44T-E | Human | Esophagus | ESCC | 3.61e-36 | 1.13e+00 | 0.1096 |
| 51150 | SDF4 | P47T-E | Human | Esophagus | ESCC | 7.80e-44 | 9.66e-01 | 0.1067 |
| 51150 | SDF4 | P48T-E | Human | Esophagus | ESCC | 5.36e-61 | 1.06e+00 | 0.0959 |
| 51150 | SDF4 | P49T-E | Human | Esophagus | ESCC | 1.68e-25 | 2.73e+00 | 0.1768 |
| 51150 | SDF4 | P52T-E | Human | Esophagus | ESCC | 5.58e-86 | 1.84e+00 | 0.1555 |
| 51150 | SDF4 | P54T-E | Human | Esophagus | ESCC | 5.55e-38 | 1.00e+00 | 0.0975 |
| 51150 | SDF4 | P56T-E | Human | Esophagus | ESCC | 3.20e-20 | 3.02e+00 | 0.1613 |
| 51150 | SDF4 | P57T-E | Human | Esophagus | ESCC | 1.66e-58 | 1.45e+00 | 0.0926 |
| 51150 | SDF4 | P61T-E | Human | Esophagus | ESCC | 2.79e-51 | 1.21e+00 | 0.099 |
| 51150 | SDF4 | P62T-E | Human | Esophagus | ESCC | 7.92e-109 | 1.97e+00 | 0.1302 |
| 51150 | SDF4 | P65T-E | Human | Esophagus | ESCC | 5.00e-62 | 1.37e+00 | 0.0978 |
| 51150 | SDF4 | P74T-E | Human | Esophagus | ESCC | 1.89e-73 | 2.01e+00 | 0.1479 |
| 51150 | SDF4 | P75T-E | Human | Esophagus | ESCC | 1.27e-89 | 1.83e+00 | 0.1125 |
| 51150 | SDF4 | P76T-E | Human | Esophagus | ESCC | 2.22e-97 | 1.90e+00 | 0.1207 |
| 51150 | SDF4 | P79T-E | Human | Esophagus | ESCC | 1.76e-85 | 1.55e+00 | 0.1154 |
| Page: 1 2 3 4 5 6 7 8 9 |
| Tissue | Expression Dynamics | Abbreviation |
| Colorectum (GSE201348) |  | FAP: Familial adenomatous polyposis |
| CRC: Colorectal cancer | ||
| Colorectum (HTA11) |  | AD: Adenomas |
| SER: Sessile serrated lesions | ||
| MSI-H: Microsatellite-high colorectal cancer | ||
| MSS: Microsatellite stable colorectal cancer | ||
| Endometrium | 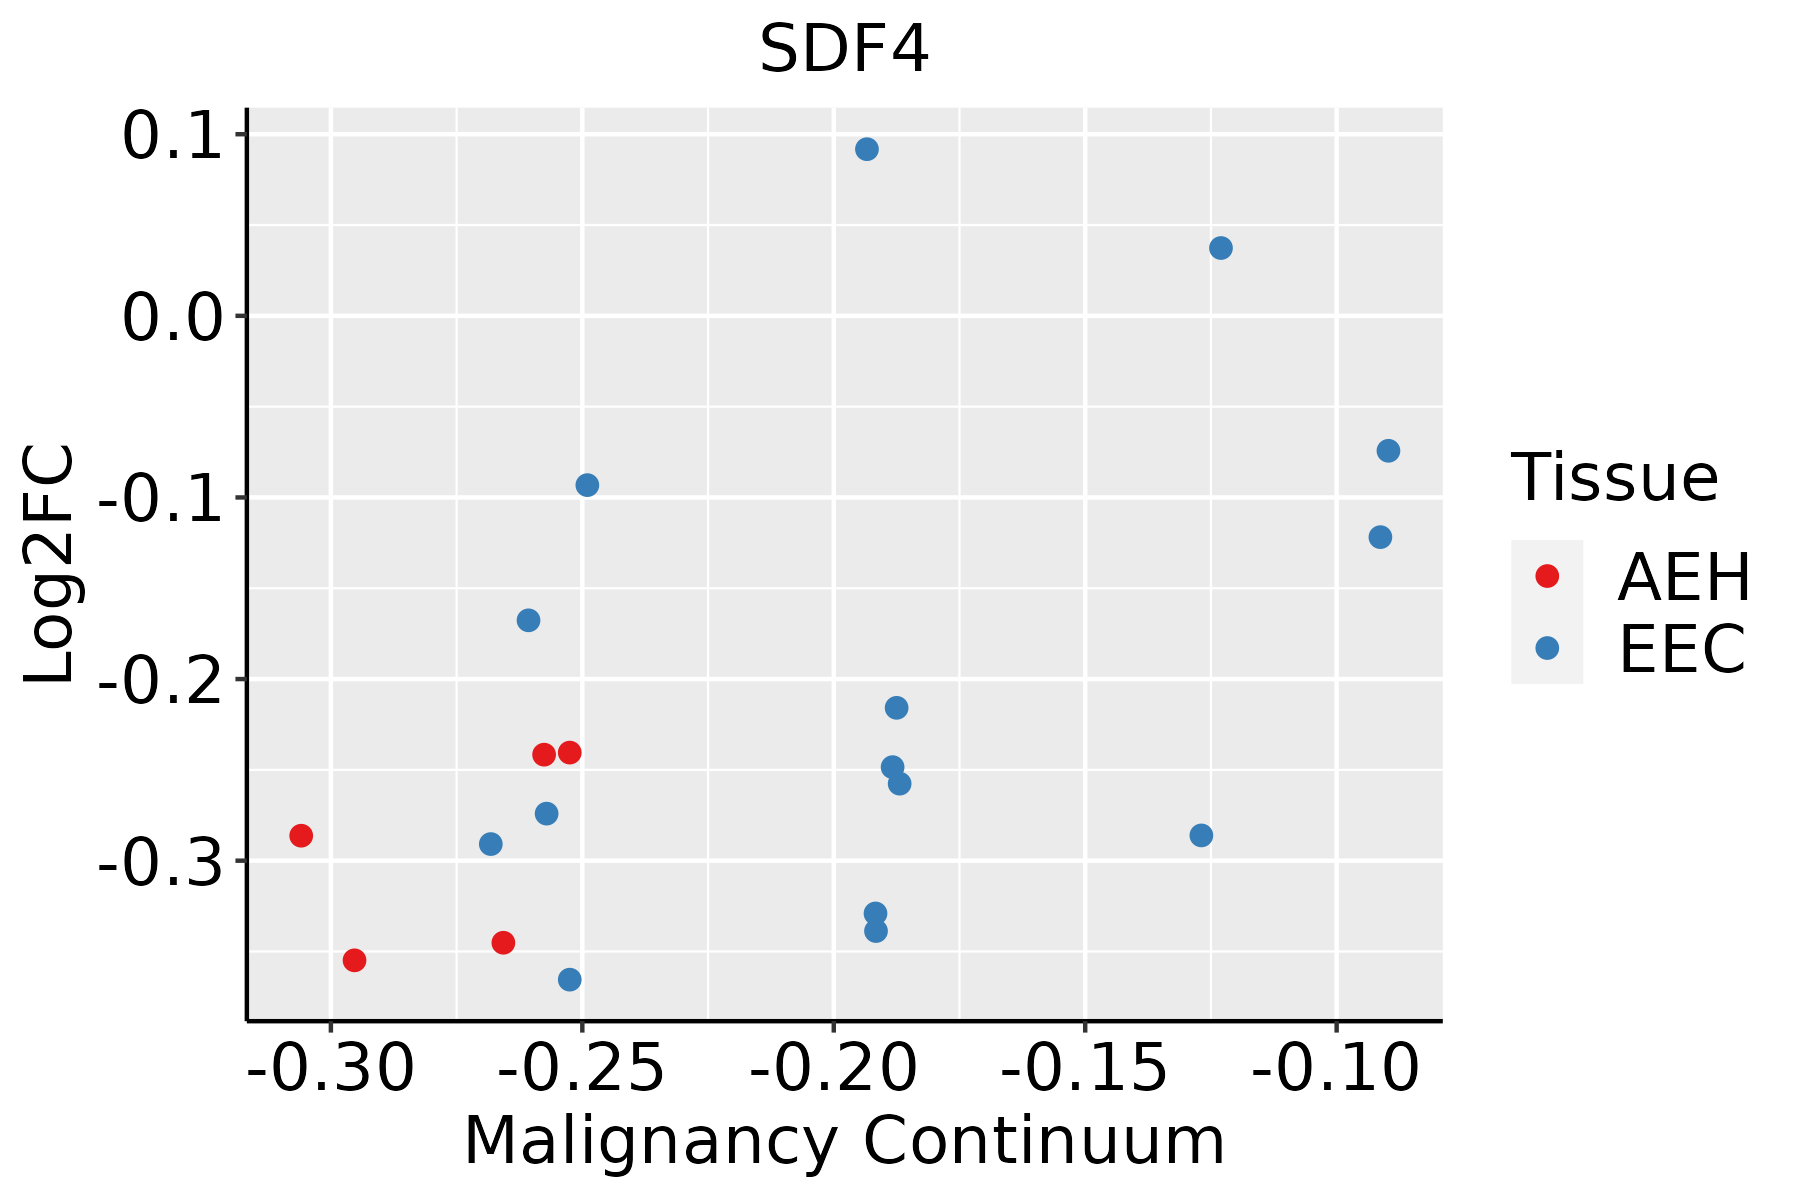 | AEH: Atypical endometrial hyperplasia |
| EEC: Endometrioid Cancer | ||
| Esophagus | 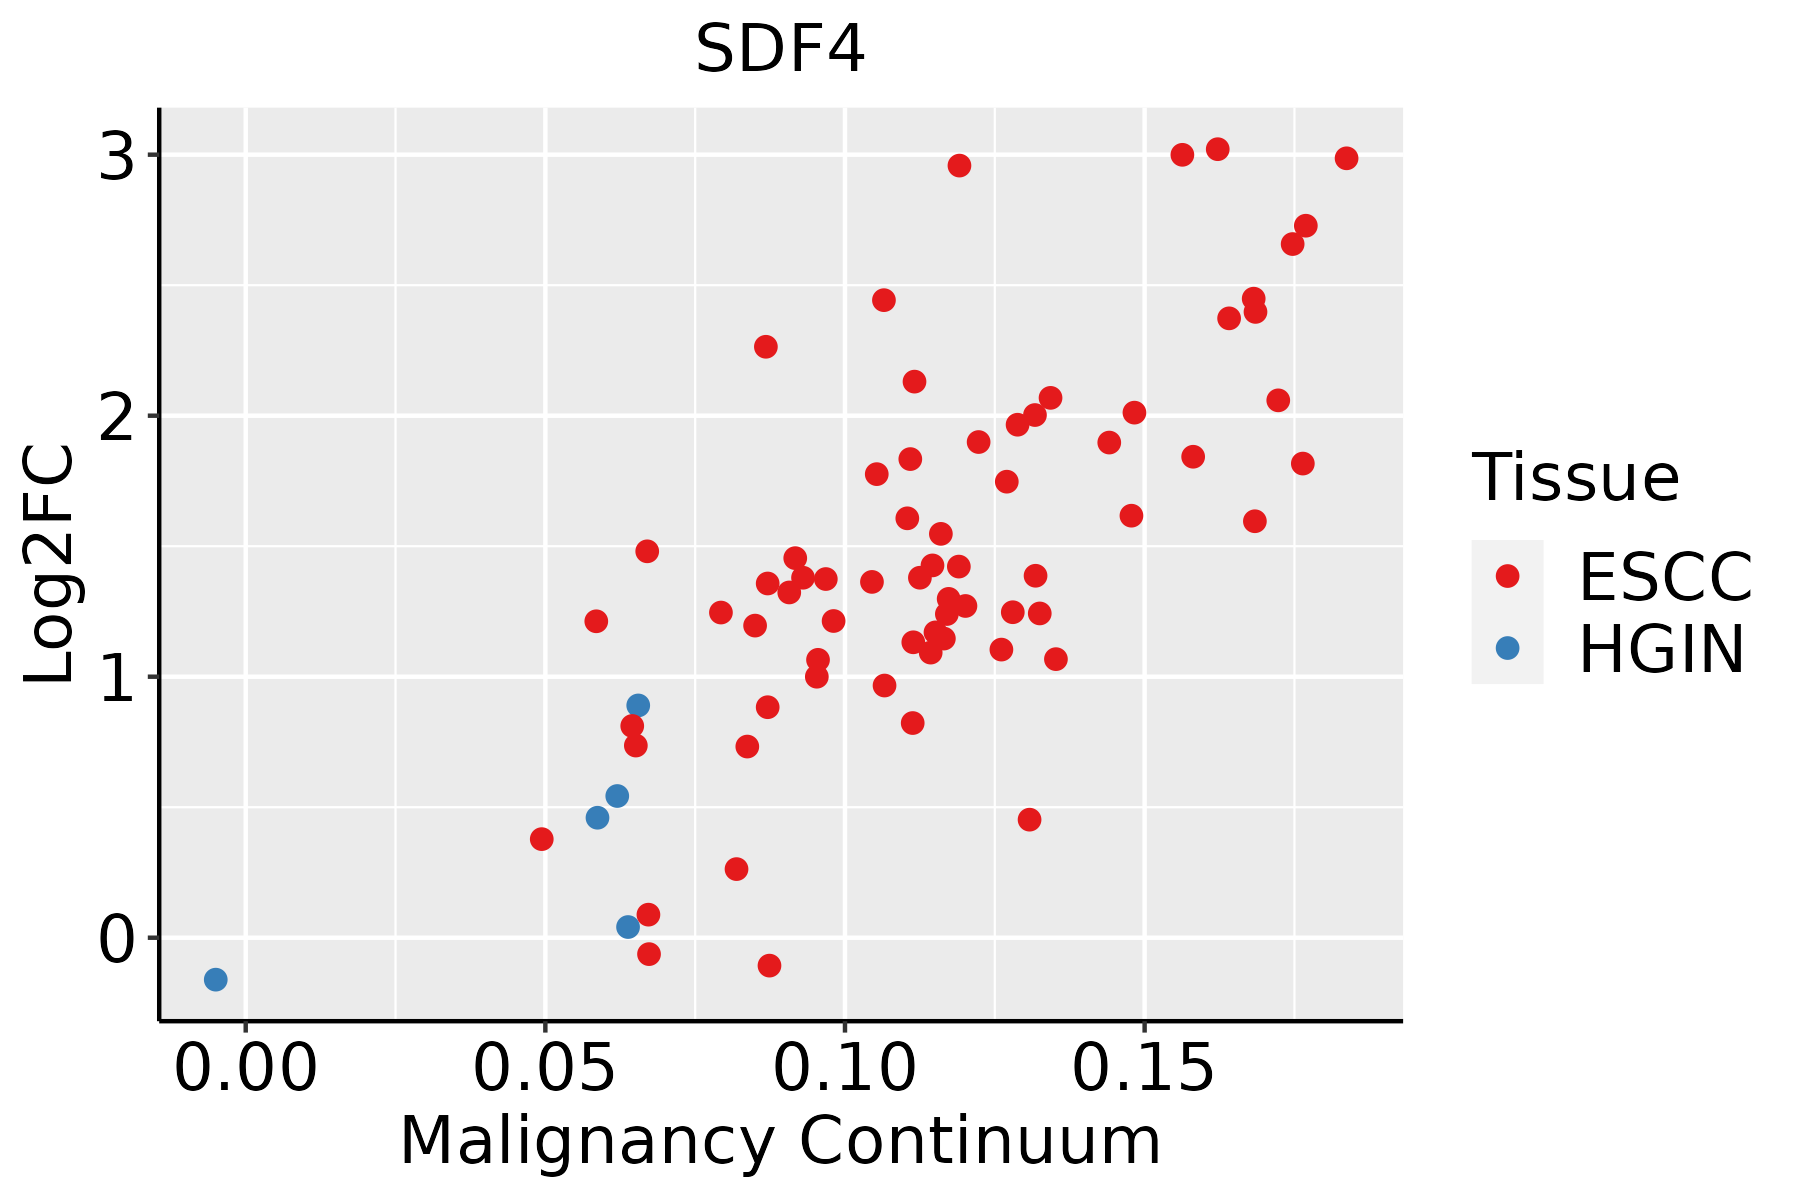 | ESCC: Esophageal squamous cell carcinoma |
| HGIN: High-grade intraepithelial neoplasias | ||
| LGIN: Low-grade intraepithelial neoplasias | ||
| Liver |  | HCC: Hepatocellular carcinoma |
| NAFLD: Non-alcoholic fatty liver disease | ||
| Oral Cavity |  | EOLP: Erosive Oral lichen planus |
| LP: leukoplakia | ||
| NEOLP: Non-erosive oral lichen planus | ||
| OSCC: Oral squamous cell carcinoma | ||
| Prostate |  | BPH: Benign Prostatic Hyperplasia |
| Skin | 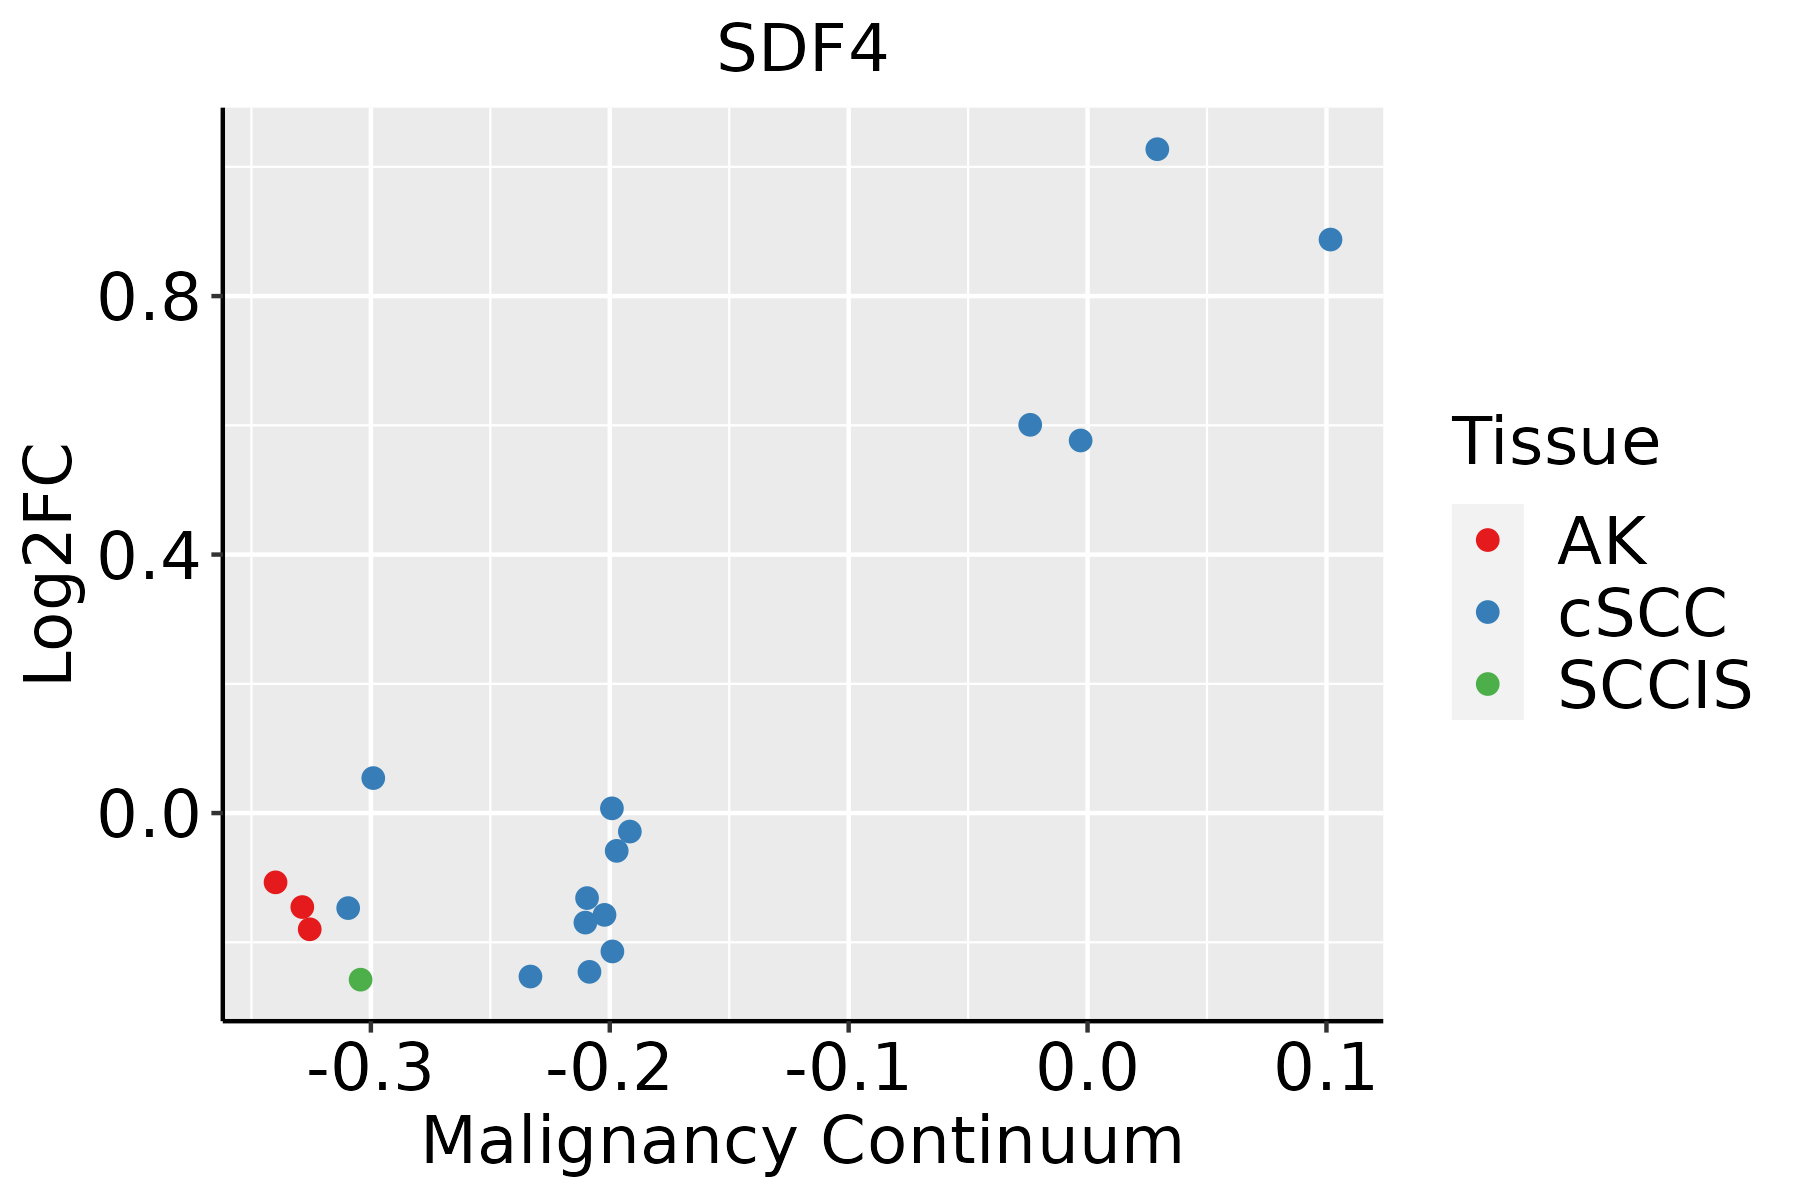 | AK: Actinic keratosis |
| cSCC: Cutaneous squamous cell carcinoma | ||
| SCCIS:squamous cell carcinoma in situ | ||
| Thyroid |  | ATC: Anaplastic thyroid cancer |
| HT: Hashimoto's thyroiditis | ||
| PTC: Papillary thyroid cancer |
| ∗log2FC in expression of this searched gene in stem-like cells from each diseased tissue sample relative to stem-like cells in normal samples in each tissue plotted against the malignancy continuum. Samples are colored based on if they are from different disease stage. |
Top |
Malignant transformation related pathway analysis |
| Find out the enriched GO biological processes and KEGG pathways involved in transition from healthy to precancer to cancer |
| Tissue | Disease Stage | Enriched GO biological Processes |
| Colorectum | AD |  |
| Colorectum | SER |  |
| Colorectum | MSS |  |
| Colorectum | MSI-H |  |
| Colorectum | FAP |  |
| ∗Top 15 enriched GO BP terms are showed in the bar plot of each disease state in each tissue. Each row represents a significant GO biological process which is colored according to the -log10(p.adjust). |
| Page: 1 2 3 4 5 6 7 8 9 |
| GO ID | Tissue | Disease Stage | Description | Gene Ratio | Bg Ratio | pvalue | p.adjust | Count |
| GO:0043954 | Colorectum | AD | cellular component maintenance | 26/3918 | 61/18723 | 1.04e-04 | 1.56e-03 | 26 |
| GO:0006887 | Colorectum | AD | exocytosis | 96/3918 | 352/18723 | 2.48e-03 | 1.90e-02 | 96 |
| GO:0034331 | Colorectum | AD | cell junction maintenance | 15/3918 | 35/18723 | 2.78e-03 | 2.09e-02 | 15 |
| GO:0097305 | Colorectum | AD | response to alcohol | 71/3918 | 253/18723 | 4.01e-03 | 2.80e-02 | 71 |
| GO:0050808 | Colorectum | AD | synapse organization | 112/3918 | 426/18723 | 4.25e-03 | 2.92e-02 | 112 |
| GO:00439541 | Colorectum | SER | cellular component maintenance | 22/2897 | 61/18723 | 6.47e-05 | 1.49e-03 | 22 |
| GO:00068871 | Colorectum | SER | exocytosis | 75/2897 | 352/18723 | 2.05e-03 | 2.03e-02 | 75 |
| GO:0045444 | Colorectum | SER | fat cell differentiation | 51/2897 | 229/18723 | 3.96e-03 | 3.26e-02 | 51 |
| GO:00343311 | Colorectum | SER | cell junction maintenance | 12/2897 | 35/18723 | 4.72e-03 | 3.71e-02 | 12 |
| GO:00508081 | Colorectum | SER | synapse organization | 85/2897 | 426/18723 | 7.17e-03 | 4.99e-02 | 85 |
| GO:00439542 | Colorectum | MSS | cellular component maintenance | 22/3467 | 61/18723 | 9.05e-04 | 9.21e-03 | 22 |
| GO:00973051 | Colorectum | MSS | response to alcohol | 66/3467 | 253/18723 | 1.73e-03 | 1.54e-02 | 66 |
| GO:00508082 | Colorectum | MSS | synapse organization | 101/3467 | 426/18723 | 3.96e-03 | 2.89e-02 | 101 |
| GO:00343312 | Colorectum | MSS | cell junction maintenance | 13/3467 | 35/18723 | 7.38e-03 | 4.68e-02 | 13 |
| GO:00973052 | Colorectum | MSI-H | response to alcohol | 33/1319 | 253/18723 | 4.53e-04 | 9.61e-03 | 33 |
| GO:009730510 | Endometrium | AEH | response to alcohol | 48/2100 | 253/18723 | 1.80e-04 | 2.31e-03 | 48 |
| GO:00439546 | Endometrium | AEH | cellular component maintenance | 16/2100 | 61/18723 | 8.71e-04 | 8.04e-03 | 16 |
| GO:00508086 | Endometrium | AEH | synapse organization | 67/2100 | 426/18723 | 2.67e-03 | 1.94e-02 | 67 |
| GO:000931410 | Endometrium | AEH | response to radiation | 70/2100 | 456/18723 | 3.99e-03 | 2.68e-02 | 70 |
| GO:00343317 | Endometrium | AEH | cell junction maintenance | 10/2100 | 35/18723 | 4.04e-03 | 2.69e-02 | 10 |
| Page: 1 2 3 4 5 |
| Pathway ID | Tissue | Disease Stage | Description | Gene Ratio | Bg Ratio | pvalue | p.adjust | qvalue | Count |
| Page: 1 |
Top |
Cell-cell communication analysis |
| Identification of potential cell-cell interactions between two cell types and their ligand-receptor pairs for different disease states |
| Ligand | Receptor | LRpair | Pathway | Tissue | Disease Stage |
| Page: 1 |
Top |
Single-cell gene regulatory network inference analysis |
| Find out the significant the regulons (TFs) and the target genes of each regulon across cell types for different disease states |
| TF | Cell Type | Tissue | Disease Stage | Target Gene | RSS | Regulon Activity |
| ∗The dot plots of a searched regulon are shown for all cell subpopulations in each disease state of each tissue based on the regulon specific score inferred using pySCENIC and by calculating the average expression. |
| Page: 1 |
Top |
Somatic mutation of malignant transformation related genes |
| Annotation of somatic variants for genes involved in malignant transformation |
| Hugo Symbol | Variant Class | Variant Classification | dbSNP RS | HGVSc | HGVSp | HGVSp Short | SWISSPROT | BIOTYPE | SIFT | PolyPhen | Tumor Sample Barcode | Tissue | Histology | Sex | Age | Stage | Therapy Types | Drugs | Outcome |
| SDF4 | SNV | Missense_Mutation | novel | c.491N>C | p.Val164Ala | p.V164A | Q9BRK5 | protein_coding | tolerated(0.09) | benign(0.01) | TCGA-AO-A128-01 | Breast | breast invasive carcinoma | Female | <65 | I/II | Chemotherapy | doxorubicin | SD |
| SDF4 | SNV | Missense_Mutation | c.538G>C | p.Ala180Pro | p.A180P | Q9BRK5 | protein_coding | tolerated(0.12) | benign(0.006) | TCGA-BH-A1F0-01 | Breast | breast invasive carcinoma | Female | >=65 | I/II | Unknown | Unknown | PD | |
| SDF4 | SNV | Missense_Mutation | c.202G>A | p.Glu68Lys | p.E68K | Q9BRK5 | protein_coding | deleterious(0.01) | possibly_damaging(0.833) | TCGA-E9-A1R0-01 | Breast | breast invasive carcinoma | Female | <65 | I/II | Chemotherapy | cyclophosphamide | SD | |
| SDF4 | deletion | In_Frame_Del | novel | c.826_843delNNNNNNNNNNNNNNNNNN | p.Asp276_Asp281del | p.D276_D281del | Q9BRK5 | protein_coding | TCGA-AN-A0XU-01 | Breast | breast invasive carcinoma | Female | <65 | I/II | Unknown | Unknown | SD | ||
| SDF4 | SNV | Missense_Mutation | c.943G>A | p.Ala315Thr | p.A315T | Q9BRK5 | protein_coding | deleterious(0.02) | possibly_damaging(0.84) | TCGA-A6-2686-01 | Colorectum | colon adenocarcinoma | Female | >=65 | I/II | Unknown | Unknown | SD | |
| SDF4 | SNV | Missense_Mutation | novel | c.268N>G | p.Phe90Val | p.F90V | Q9BRK5 | protein_coding | deleterious(0.03) | benign(0.313) | TCGA-AA-A010-01 | Colorectum | colon adenocarcinoma | Female | <65 | I/II | Chemotherapy | folinic | CR |
| SDF4 | SNV | Missense_Mutation | c.1063N>A | p.Ala355Thr | p.A355T | Q9BRK5 | protein_coding | deleterious(0) | possibly_damaging(0.895) | TCGA-D5-6928-01 | Colorectum | colon adenocarcinoma | Male | >=65 | I/II | Unknown | Unknown | SD | |
| SDF4 | SNV | Missense_Mutation | rs778380110 | c.826G>A | p.Asp276Asn | p.D276N | Q9BRK5 | protein_coding | deleterious(0.01) | possibly_damaging(0.468) | TCGA-DM-A1HA-01 | Colorectum | colon adenocarcinoma | Male | >=65 | III/IV | Unknown | Unknown | SD |
| SDF4 | SNV | Missense_Mutation | novel | c.1055N>C | p.Val352Ala | p.V352A | Q9BRK5 | protein_coding | tolerated(0.2) | benign(0.01) | TCGA-A5-A2K7-01 | Endometrium | uterine corpus endometrioid carcinoma | Female | <65 | I/II | Chemotherapy | taxol | SD |
| SDF4 | SNV | Missense_Mutation | novel | c.910G>C | p.Glu304Gln | p.E304Q | Q9BRK5 | protein_coding | tolerated(0.1) | possibly_damaging(0.634) | TCGA-AJ-A2QM-01 | Endometrium | uterine corpus endometrioid carcinoma | Female | >=65 | I/II | Chemotherapy | carboplatin | CR |
| Page: 1 2 3 4 |
Top |
Related drugs of malignant transformation related genes |
| Identification of chemicals and drugs interact with genes involved in malignant transfromation |
| (DGIdb 4.0) |
| Entrez ID | Symbol | Category | Interaction Types | Drug Claim Name | Drug Name | PMIDs |
| 51150 | SDF4 | NA | ETHANOL | ALCOHOL | 18355758 |
| Page: 1 |

Copyright 2023-Present -The University of Texas Health Science Center at Houston |