
|
|||||
|
 | |
| |
| |
| |
| |
| |
|
Gene: SDCBP2 |
Gene summary for SDCBP2 |
| Gene information | Species | Human | Gene symbol | SDCBP2 | Gene ID | 27111 |
| Gene name | syndecan binding protein 2 | |
| Gene Alias | SITAC | |
| Cytomap | 20p13 | |
| Gene Type | protein-coding | GO ID | GO:0006810 | UniProtAcc | Q9H190 |
Top |
Malignant transformation analysis |
| Identification of the aberrant gene expression in precancerous and cancerous lesions by comparing the gene expression of stem-like cells in diseased tissues with normal stem cells |
| Entrez ID | Symbol | Replicates | Species | Organ | Tissue | Adj P-value | Log2FC | Malignancy |
| 27111 | SDCBP2 | Pat22-B | Human | Stomach | GC | 3.77e-34 | 5.23e-01 | -0.1042 |
| 27111 | SDCBP2 | Pat24-B | Human | Stomach | GC | 5.50e-14 | 3.20e-01 | -0.1184 |
| 27111 | SDCBP2 | Pat25-A | Human | Stomach | CAG with IM | 1.10e-29 | -1.50e-02 | -0.1648 |
| 27111 | SDCBP2 | Pat26-A | Human | Stomach | CSG | 9.68e-33 | 1.12e-01 | -0.2402 |
| 27111 | SDCBP2 | Pat28-A | Human | Stomach | CSG | 1.22e-07 | 6.86e-02 | -0.2594 |
| 27111 | SDCBP2 | Pat29-A | Human | Stomach | CAG with IM | 5.50e-03 | -6.10e-02 | -0.2769 |
| 27111 | SDCBP2 | NAG_2 | Human | Stomach | CSG | 5.49e-03 | 4.19e-01 | -0.3324 |
| 27111 | SDCBP2 | SIM_1 | Human | Stomach | SIM | 9.65e-06 | 4.12e-01 | 0.3573 |
| 27111 | SDCBP2 | SIM_2 | Human | Stomach | SIM | 4.92e-05 | 1.27e-01 | 0.3139 |
| 27111 | SDCBP2 | SIM_4 | Human | Stomach | SIM | 1.70e-02 | 4.76e-01 | 0.2664 |
| 27111 | SDCBP2 | male-WTA | Human | Thyroid | PTC | 1.36e-05 | 2.62e-02 | 0.1037 |
| 27111 | SDCBP2 | PTC01 | Human | Thyroid | PTC | 4.23e-07 | 7.05e-02 | 0.1899 |
| 27111 | SDCBP2 | PTC05 | Human | Thyroid | PTC | 7.55e-09 | 3.66e-01 | 0.2065 |
| 27111 | SDCBP2 | PTC06 | Human | Thyroid | PTC | 4.30e-13 | 5.05e-01 | 0.2057 |
| 27111 | SDCBP2 | PTC07 | Human | Thyroid | PTC | 1.90e-22 | 9.38e-02 | 0.2044 |
| 27111 | SDCBP2 | ATC13 | Human | Thyroid | ATC | 7.53e-12 | 1.52e-01 | 0.34 |
| 27111 | SDCBP2 | ATC5 | Human | Thyroid | ATC | 2.87e-16 | 1.70e-01 | 0.34 |
| Page: 1 2 3 4 5 |
| Tissue | Expression Dynamics | Abbreviation |
| Cervix | 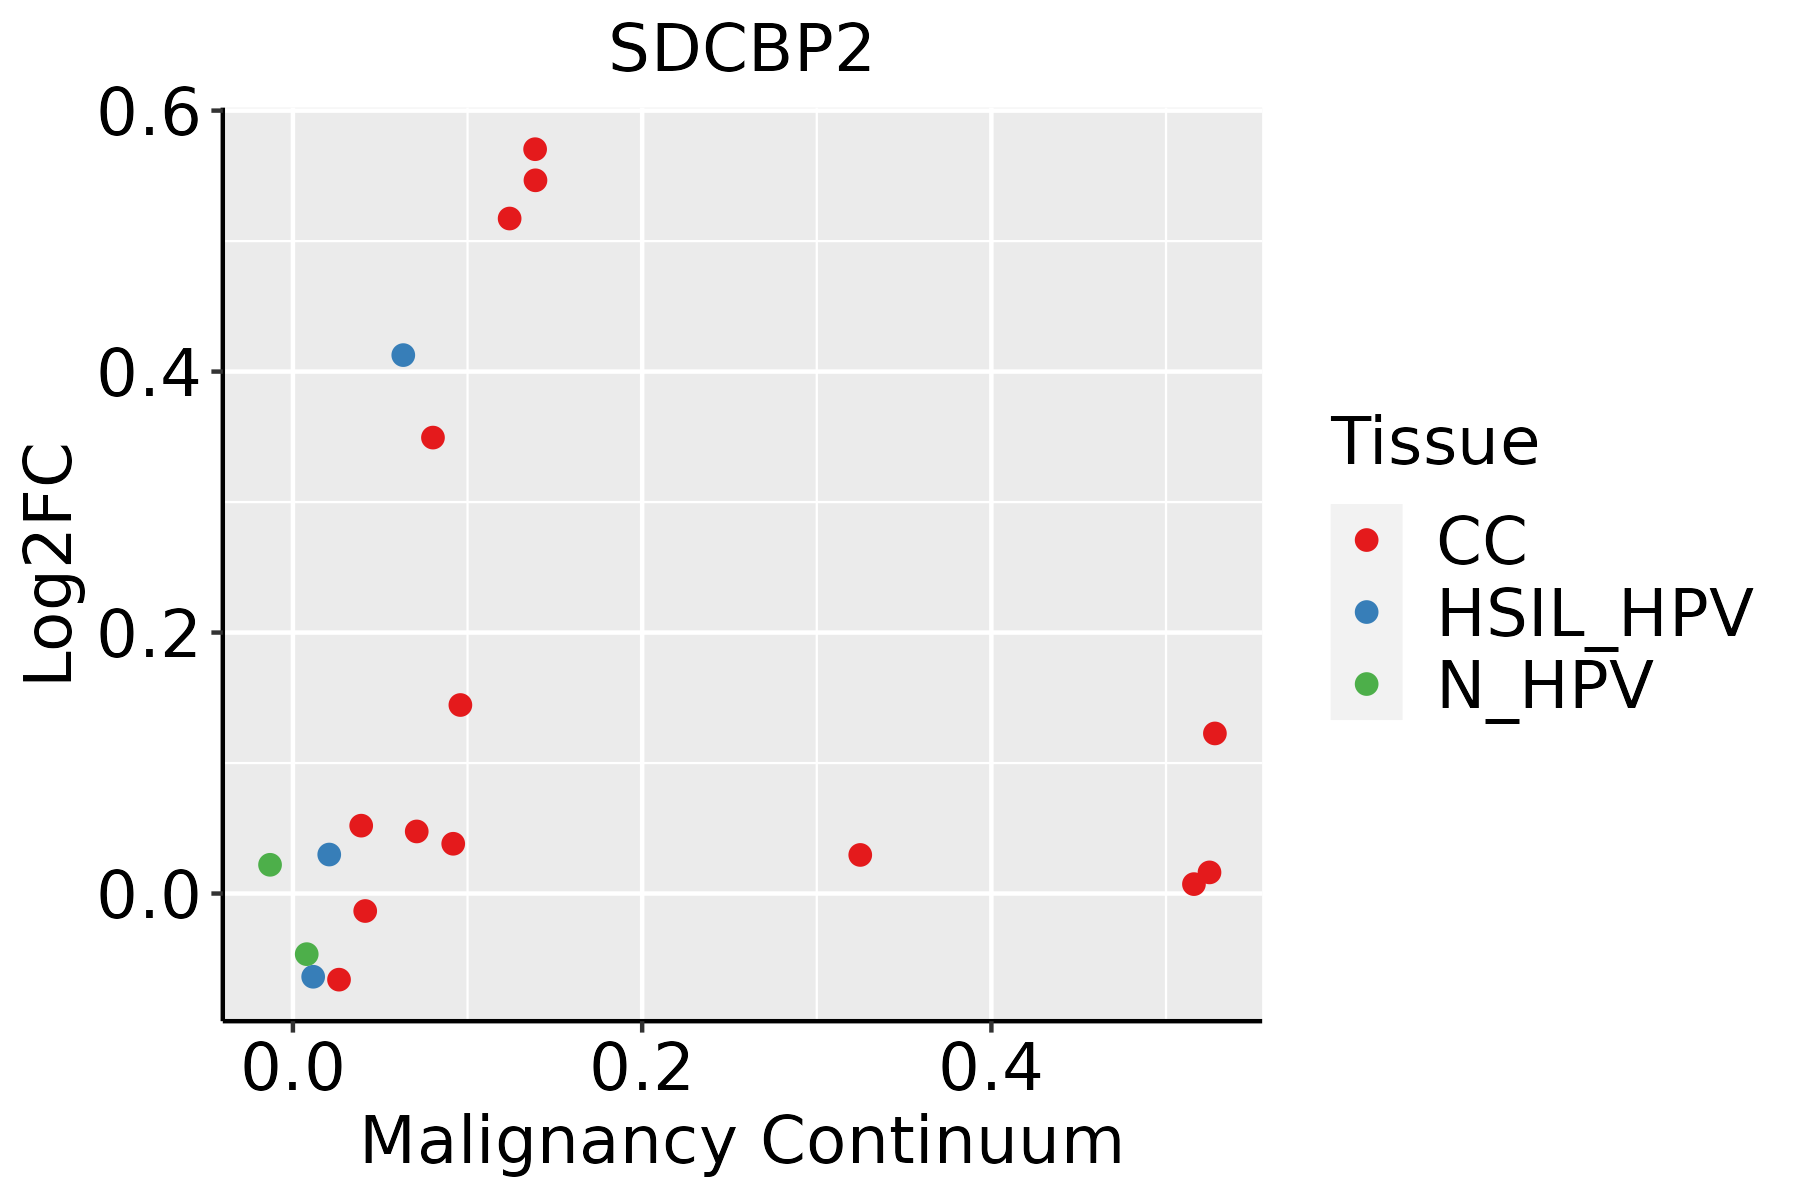 | CC: Cervix cancer |
| HSIL_HPV: HPV-infected high-grade squamous intraepithelial lesions | ||
| N_HPV: HPV-infected normal cervix | ||
| Colorectum (GSE201348) |  | FAP: Familial adenomatous polyposis |
| CRC: Colorectal cancer | ||
| Colorectum (HTA11) |  | AD: Adenomas |
| SER: Sessile serrated lesions | ||
| MSI-H: Microsatellite-high colorectal cancer | ||
| MSS: Microsatellite stable colorectal cancer | ||
| Esophagus |  | ESCC: Esophageal squamous cell carcinoma |
| HGIN: High-grade intraepithelial neoplasias | ||
| LGIN: Low-grade intraepithelial neoplasias | ||
| GC | 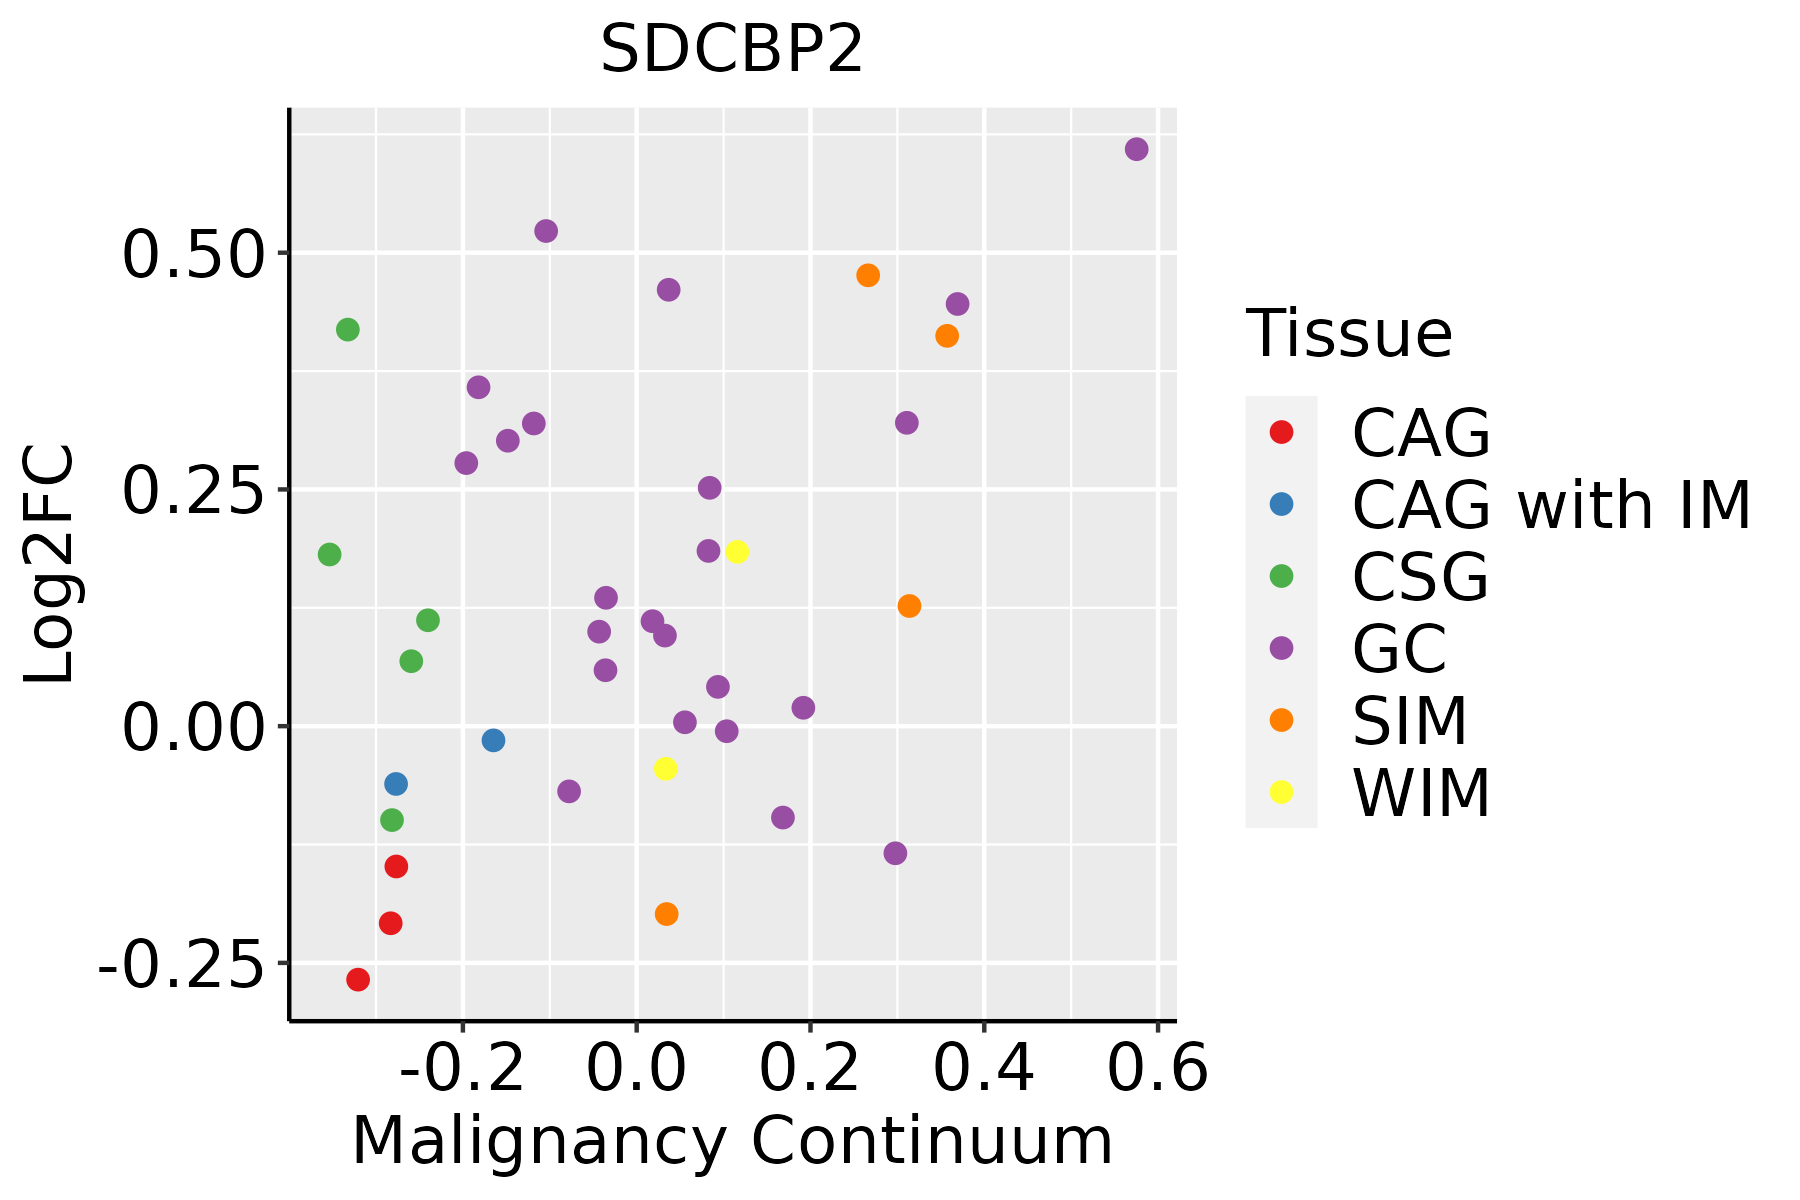 | CAG: Chronic atrophic gastritis |
| CAG with IM: Chronic atrophic gastritis with intestinal metaplasia | ||
| CSG: Chronic superficial gastritis | ||
| GC: Gastric cancer | ||
| SIM: Severe intestinal metaplasia | ||
| WIM: Wild intestinal metaplasia | ||
| Liver | 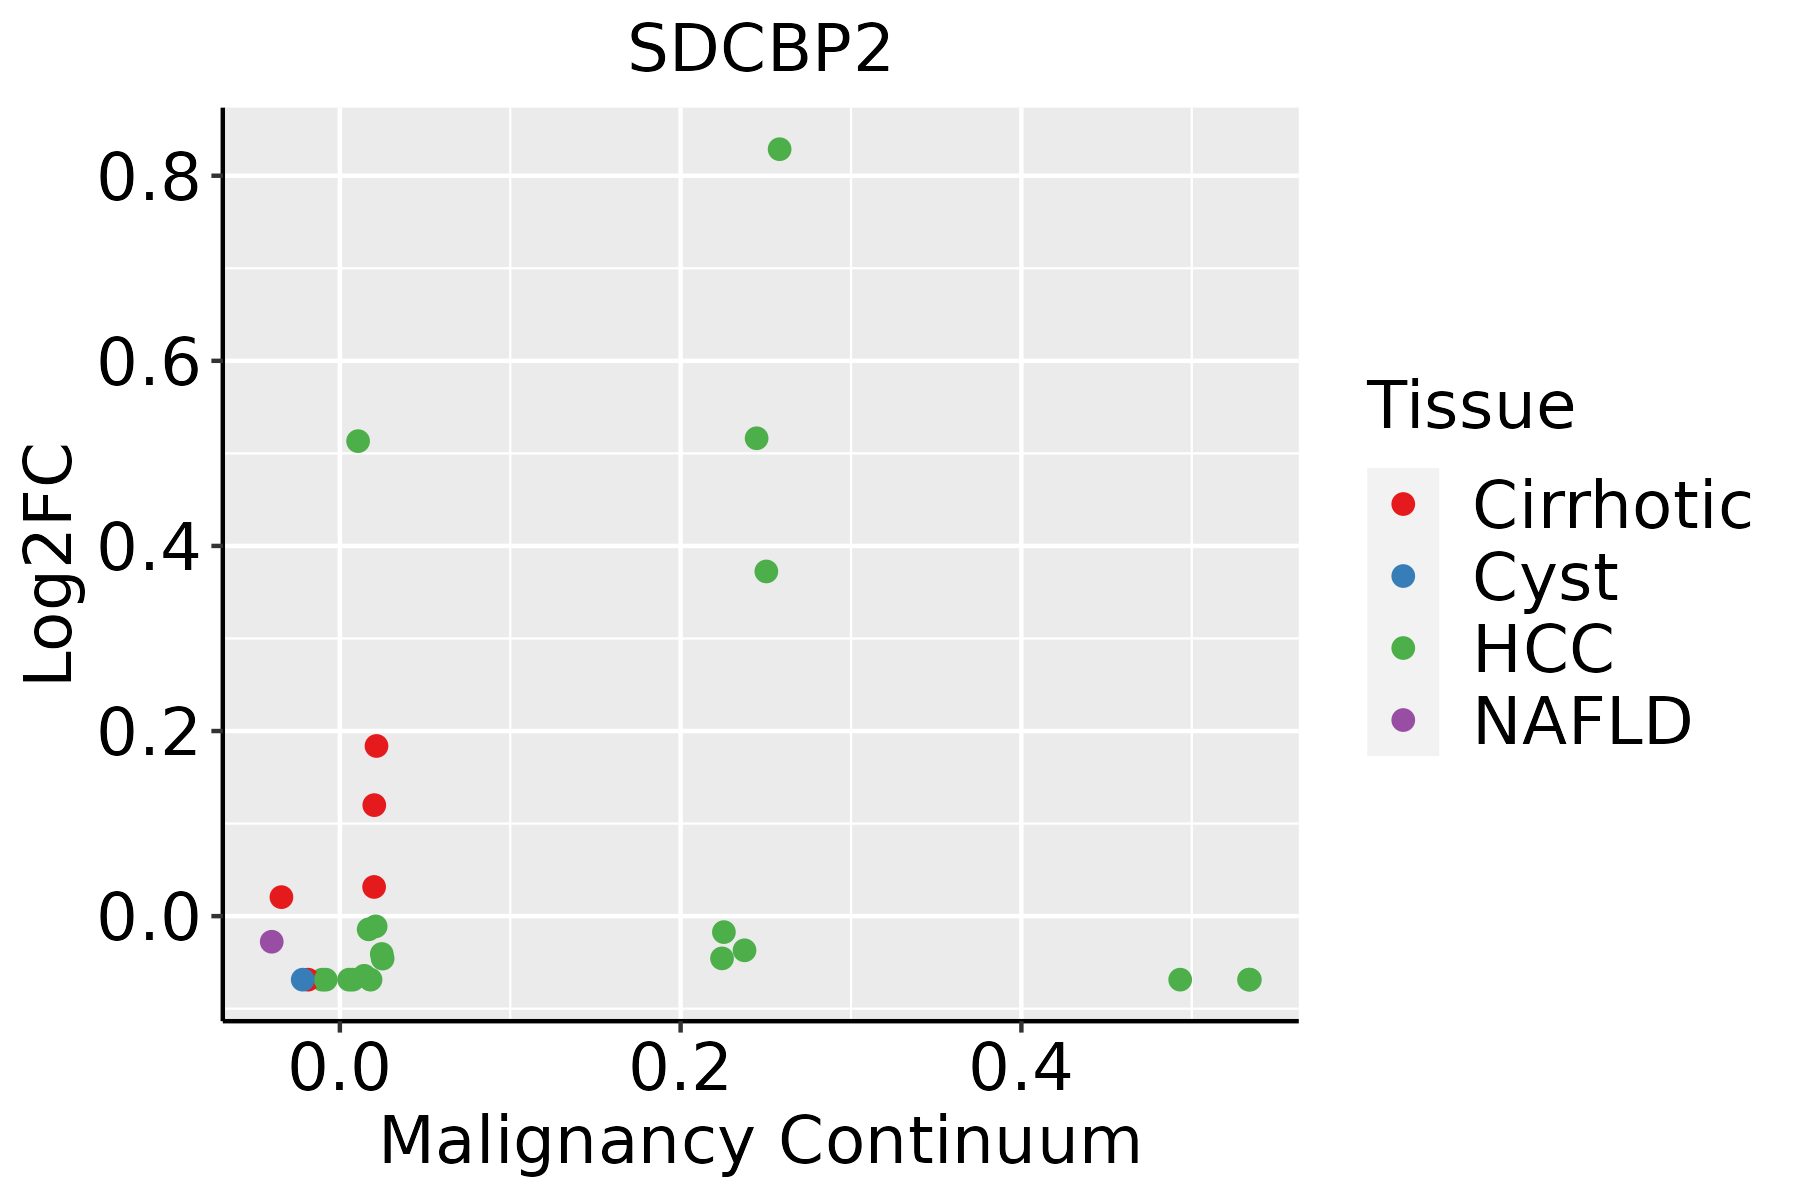 | HCC: Hepatocellular carcinoma |
| NAFLD: Non-alcoholic fatty liver disease | ||
| Oral Cavity |  | EOLP: Erosive Oral lichen planus |
| LP: leukoplakia | ||
| NEOLP: Non-erosive oral lichen planus | ||
| OSCC: Oral squamous cell carcinoma | ||
| Skin | 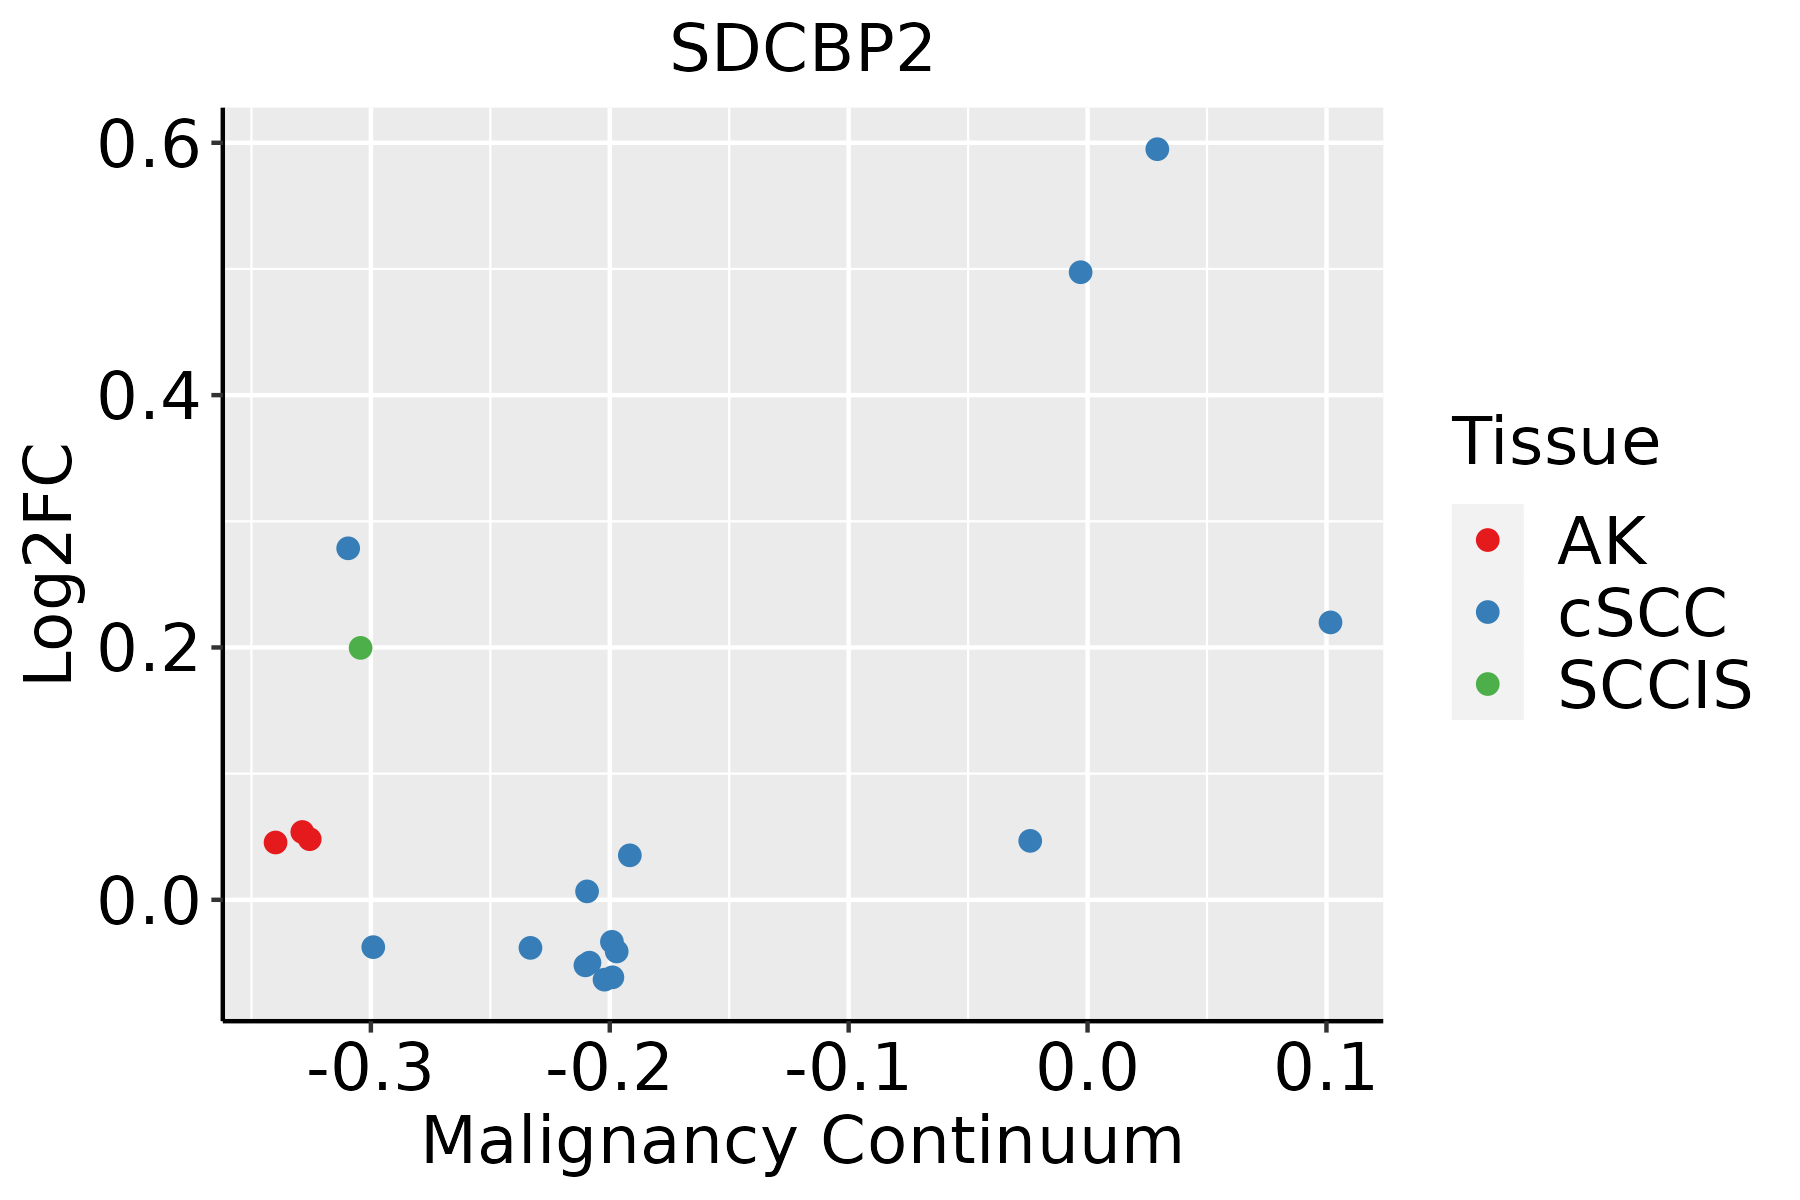 | AK: Actinic keratosis |
| cSCC: Cutaneous squamous cell carcinoma | ||
| SCCIS:squamous cell carcinoma in situ | ||
| Thyroid | 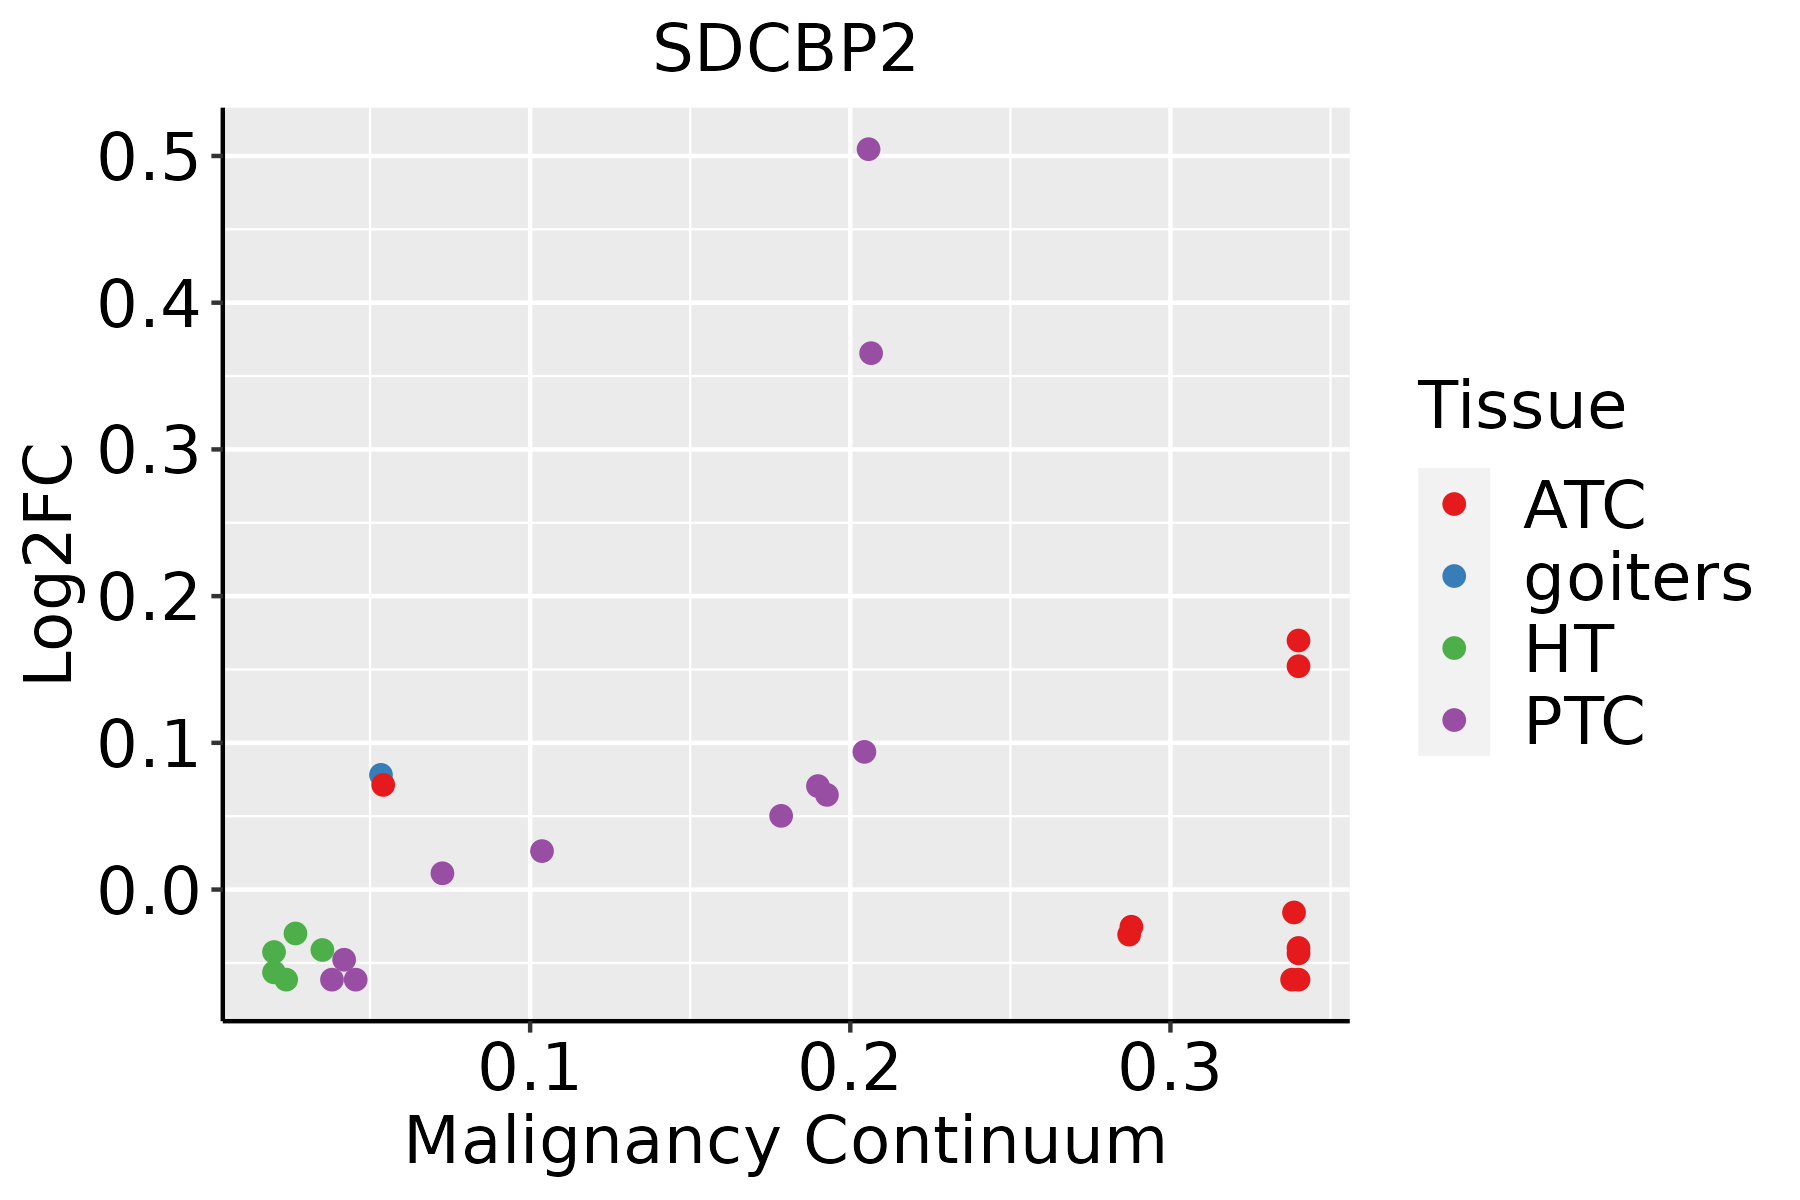 | ATC: Anaplastic thyroid cancer |
| HT: Hashimoto's thyroiditis | ||
| PTC: Papillary thyroid cancer |
| ∗log2FC in expression of this searched gene in stem-like cells from each diseased tissue sample relative to stem-like cells in normal samples in each tissue plotted against the malignancy continuum. Samples are colored based on if they are from different disease stage. |
Top |
Malignant transformation related pathway analysis |
| Find out the enriched GO biological processes and KEGG pathways involved in transition from healthy to precancer to cancer |
| Tissue | Disease Stage | Enriched GO biological Processes |
| Colorectum | AD |  |
| Colorectum | SER |  |
| Colorectum | MSS |  |
| Colorectum | MSI-H |  |
| Colorectum | FAP |  |
| ∗Top 15 enriched GO BP terms are showed in the bar plot of each disease state in each tissue. Each row represents a significant GO biological process which is colored according to the -log10(p.adjust). |
| Page: 1 2 3 4 5 6 7 8 9 |
| GO ID | Tissue | Disease Stage | Description | Gene Ratio | Bg Ratio | pvalue | p.adjust | Count |
| Page: 1 |
| Pathway ID | Tissue | Disease Stage | Description | Gene Ratio | Bg Ratio | pvalue | p.adjust | qvalue | Count |
| Page: 1 |
Top |
Cell-cell communication analysis |
| Identification of potential cell-cell interactions between two cell types and their ligand-receptor pairs for different disease states |
| Ligand | Receptor | LRpair | Pathway | Tissue | Disease Stage |
| Page: 1 |
Top |
Single-cell gene regulatory network inference analysis |
| Find out the significant the regulons (TFs) and the target genes of each regulon across cell types for different disease states |
| TF | Cell Type | Tissue | Disease Stage | Target Gene | RSS | Regulon Activity |
| ∗The dot plots of a searched regulon are shown for all cell subpopulations in each disease state of each tissue based on the regulon specific score inferred using pySCENIC and by calculating the average expression. |
| Page: 1 |
Top |
Somatic mutation of malignant transformation related genes |
| Annotation of somatic variants for genes involved in malignant transformation |
| Hugo Symbol | Variant Class | Variant Classification | dbSNP RS | HGVSc | HGVSp | HGVSp Short | SWISSPROT | BIOTYPE | SIFT | PolyPhen | Tumor Sample Barcode | Tissue | Histology | Sex | Age | Stage | Therapy Types | Drugs | Outcome |
| SDCBP2 | SNV | Missense_Mutation | c.130N>C | p.Tyr44His | p.Y44H | Q9H190 | protein_coding | deleterious(0.03) | probably_damaging(0.94) | TCGA-AR-A256-01 | Breast | breast invasive carcinoma | Female | <65 | I/II | Chemotherapy | doxorubicin | PD | |
| SDCBP2 | SNV | Missense_Mutation | c.107N>G | p.Ala36Gly | p.A36G | Q9H190 | protein_coding | tolerated(0.22) | benign(0.015) | TCGA-BH-A0BZ-01 | Breast | breast invasive carcinoma | Female | <65 | III/IV | Chemotherapy | doxorubicin | CR | |
| SDCBP2 | insertion | Frame_Shift_Ins | novel | c.609_610insAAGCGTGGTGCCTCCTGGATTCAAGG | p.Gly204LysfsTer12 | p.G204Kfs*12 | Q9H190 | protein_coding | TCGA-B6-A0I6-01 | Breast | breast invasive carcinoma | Female | <65 | I/II | Unknown | Unknown | PD | ||
| SDCBP2 | SNV | Missense_Mutation | c.349N>A | p.Gly117Ser | p.G117S | Q9H190 | protein_coding | deleterious(0.01) | possibly_damaging(0.85) | TCGA-A6-6138-01 | Colorectum | colon adenocarcinoma | Male | <65 | I/II | Unknown | Unknown | SD | |
| SDCBP2 | SNV | Missense_Mutation | rs762408353 | c.616N>A | p.Val206Met | p.V206M | Q9H190 | protein_coding | tolerated(0.08) | benign(0.067) | TCGA-A6-6654-01 | Colorectum | colon adenocarcinoma | Female | >=65 | III/IV | Chemotherapy | oxaliplatin | SD |
| SDCBP2 | SNV | Missense_Mutation | rs138600579 | c.439N>T | p.Arg147Cys | p.R147C | Q9H190 | protein_coding | deleterious(0) | probably_damaging(0.998) | TCGA-AA-3673-01 | Colorectum | colon adenocarcinoma | Female | <65 | I/II | Unknown | Unknown | SD |
| SDCBP2 | SNV | Missense_Mutation | novel | c.629N>T | p.Gly210Val | p.G210V | Q9H190 | protein_coding | deleterious(0) | probably_damaging(0.999) | TCGA-AA-3867-01 | Colorectum | colon adenocarcinoma | Male | >=65 | III/IV | Unknown | Unknown | PD |
| SDCBP2 | SNV | Missense_Mutation | c.553N>T | p.Arg185Trp | p.R185W | Q9H190 | protein_coding | deleterious(0) | probably_damaging(1) | TCGA-CK-6746-01 | Colorectum | colon adenocarcinoma | Female | >=65 | I/II | Unknown | Unknown | SD | |
| SDCBP2 | SNV | Missense_Mutation | rs762408353 | c.616G>A | p.Val206Met | p.V206M | Q9H190 | protein_coding | tolerated(0.08) | benign(0.067) | TCGA-G4-6586-01 | Colorectum | colon adenocarcinoma | Female | >=65 | I/II | Unknown | Unknown | SD |
| SDCBP2 | SNV | Missense_Mutation | c.553N>T | p.Arg185Trp | p.R185W | Q9H190 | protein_coding | deleterious(0) | probably_damaging(1) | TCGA-QG-A5Z2-01 | Colorectum | colon adenocarcinoma | Male | <65 | I/II | Unknown | Unknown | SD |
| Page: 1 2 3 4 |
Top |
Related drugs of malignant transformation related genes |
| Identification of chemicals and drugs interact with genes involved in malignant transfromation |
| (DGIdb 4.0) |
| Entrez ID | Symbol | Category | Interaction Types | Drug Claim Name | Drug Name | PMIDs |
| Page: 1 |

Copyright 2023-Present -The University of Texas Health Science Center at Houston |