
|
|||||
|
 | |
| |
| |
| |
| |
| |
|
Gene: RPRD2 |
Gene summary for RPRD2 |
| Gene information | Species | Human | Gene symbol | RPRD2 | Gene ID | 23248 |
| Gene name | regulation of nuclear pre-mRNA domain containing 2 | |
| Gene Alias | HSPC099 | |
| Cytomap | 1q21.2 | |
| Gene Type | protein-coding | GO ID | GO:0006139 | UniProtAcc | Q5VT52 |
Top |
Malignant transformation analysis |
| Identification of the aberrant gene expression in precancerous and cancerous lesions by comparing the gene expression of stem-like cells in diseased tissues with normal stem cells |
| Entrez ID | Symbol | Replicates | Species | Organ | Tissue | Adj P-value | Log2FC | Malignancy |
| 23248 | RPRD2 | P65T-E | Human | Esophagus | ESCC | 5.15e-18 | 2.09e-01 | 0.0978 |
| 23248 | RPRD2 | P74T-E | Human | Esophagus | ESCC | 1.50e-46 | 1.19e+00 | 0.1479 |
| 23248 | RPRD2 | P75T-E | Human | Esophagus | ESCC | 4.87e-22 | 3.86e-01 | 0.1125 |
| 23248 | RPRD2 | P76T-E | Human | Esophagus | ESCC | 3.84e-07 | 2.01e-01 | 0.1207 |
| 23248 | RPRD2 | P79T-E | Human | Esophagus | ESCC | 2.34e-16 | 2.26e-01 | 0.1154 |
| 23248 | RPRD2 | P80T-E | Human | Esophagus | ESCC | 1.28e-15 | 5.14e-01 | 0.155 |
| 23248 | RPRD2 | P82T-E | Human | Esophagus | ESCC | 4.21e-08 | 4.28e-01 | 0.1072 |
| 23248 | RPRD2 | P83T-E | Human | Esophagus | ESCC | 2.32e-09 | 2.11e-01 | 0.1738 |
| 23248 | RPRD2 | P84T-E | Human | Esophagus | ESCC | 3.12e-05 | 3.11e-01 | 0.0933 |
| 23248 | RPRD2 | P89T-E | Human | Esophagus | ESCC | 3.20e-16 | 6.69e-01 | 0.1752 |
| 23248 | RPRD2 | P91T-E | Human | Esophagus | ESCC | 2.69e-04 | 4.46e-01 | 0.1828 |
| 23248 | RPRD2 | P107T-E | Human | Esophagus | ESCC | 4.77e-20 | 4.63e-01 | 0.171 |
| 23248 | RPRD2 | P126T-E | Human | Esophagus | ESCC | 9.18e-03 | 2.63e-01 | 0.1125 |
| 23248 | RPRD2 | P127T-E | Human | Esophagus | ESCC | 3.53e-22 | 2.12e-01 | 0.0826 |
| 23248 | RPRD2 | P128T-E | Human | Esophagus | ESCC | 2.38e-17 | 5.72e-01 | 0.1241 |
| 23248 | RPRD2 | P130T-E | Human | Esophagus | ESCC | 1.22e-25 | 5.82e-01 | 0.1676 |
| 23248 | RPRD2 | NAFLD1 | Human | Liver | NAFLD | 2.15e-04 | 5.79e-01 | -0.04 |
| 23248 | RPRD2 | HCC1_Meng | Human | Liver | HCC | 1.10e-46 | -3.65e-02 | 0.0246 |
| 23248 | RPRD2 | HCC2_Meng | Human | Liver | HCC | 3.22e-19 | 4.54e-02 | 0.0107 |
| 23248 | RPRD2 | HCC1 | Human | Liver | HCC | 2.69e-03 | 3.70e+00 | 0.5336 |
| Page: 1 2 3 4 5 6 7 8 |
| Tissue | Expression Dynamics | Abbreviation |
| Cervix |  | CC: Cervix cancer |
| HSIL_HPV: HPV-infected high-grade squamous intraepithelial lesions | ||
| N_HPV: HPV-infected normal cervix | ||
| Colorectum (GSE201348) |  | FAP: Familial adenomatous polyposis |
| CRC: Colorectal cancer | ||
| Colorectum (HTA11) |  | AD: Adenomas |
| SER: Sessile serrated lesions | ||
| MSI-H: Microsatellite-high colorectal cancer | ||
| MSS: Microsatellite stable colorectal cancer | ||
| Endometrium | 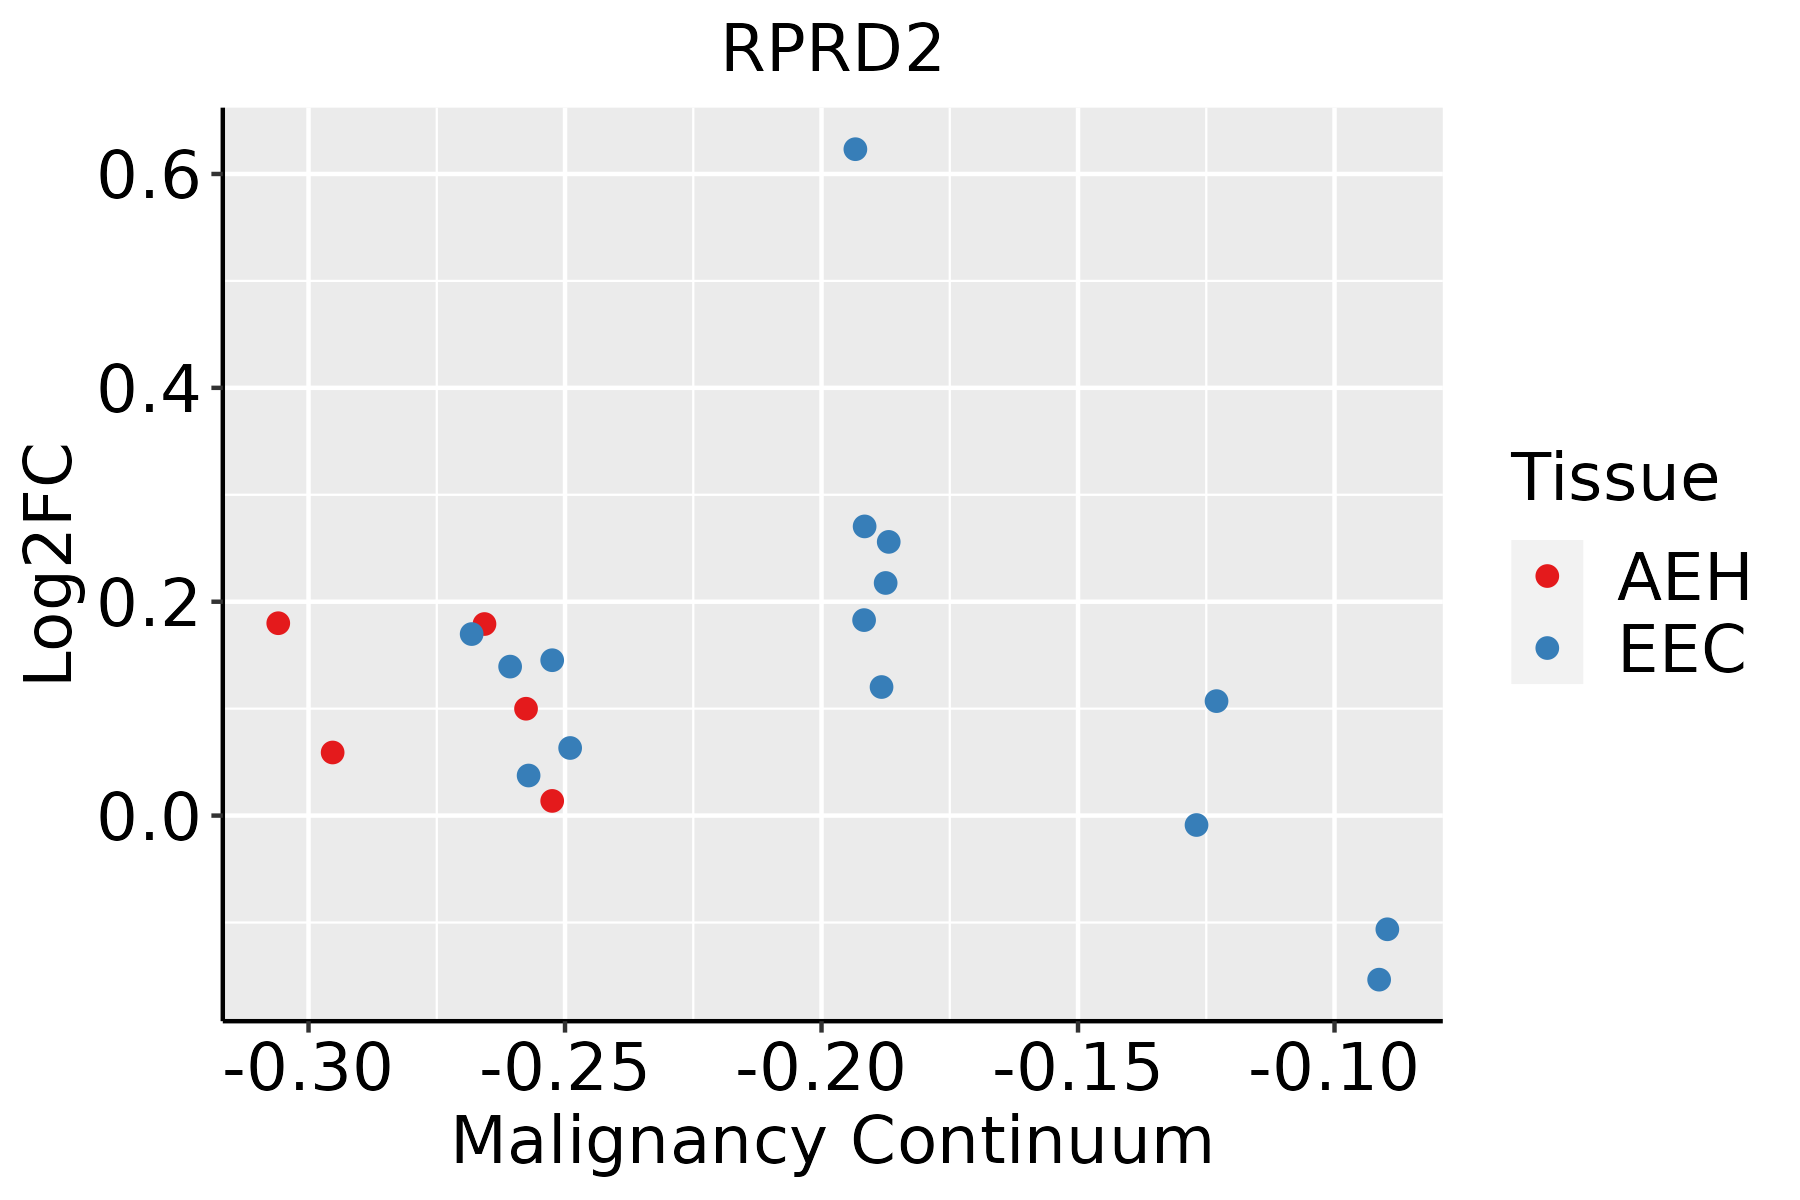 | AEH: Atypical endometrial hyperplasia |
| EEC: Endometrioid Cancer | ||
| Esophagus |  | ESCC: Esophageal squamous cell carcinoma |
| HGIN: High-grade intraepithelial neoplasias | ||
| LGIN: Low-grade intraepithelial neoplasias | ||
| Liver | 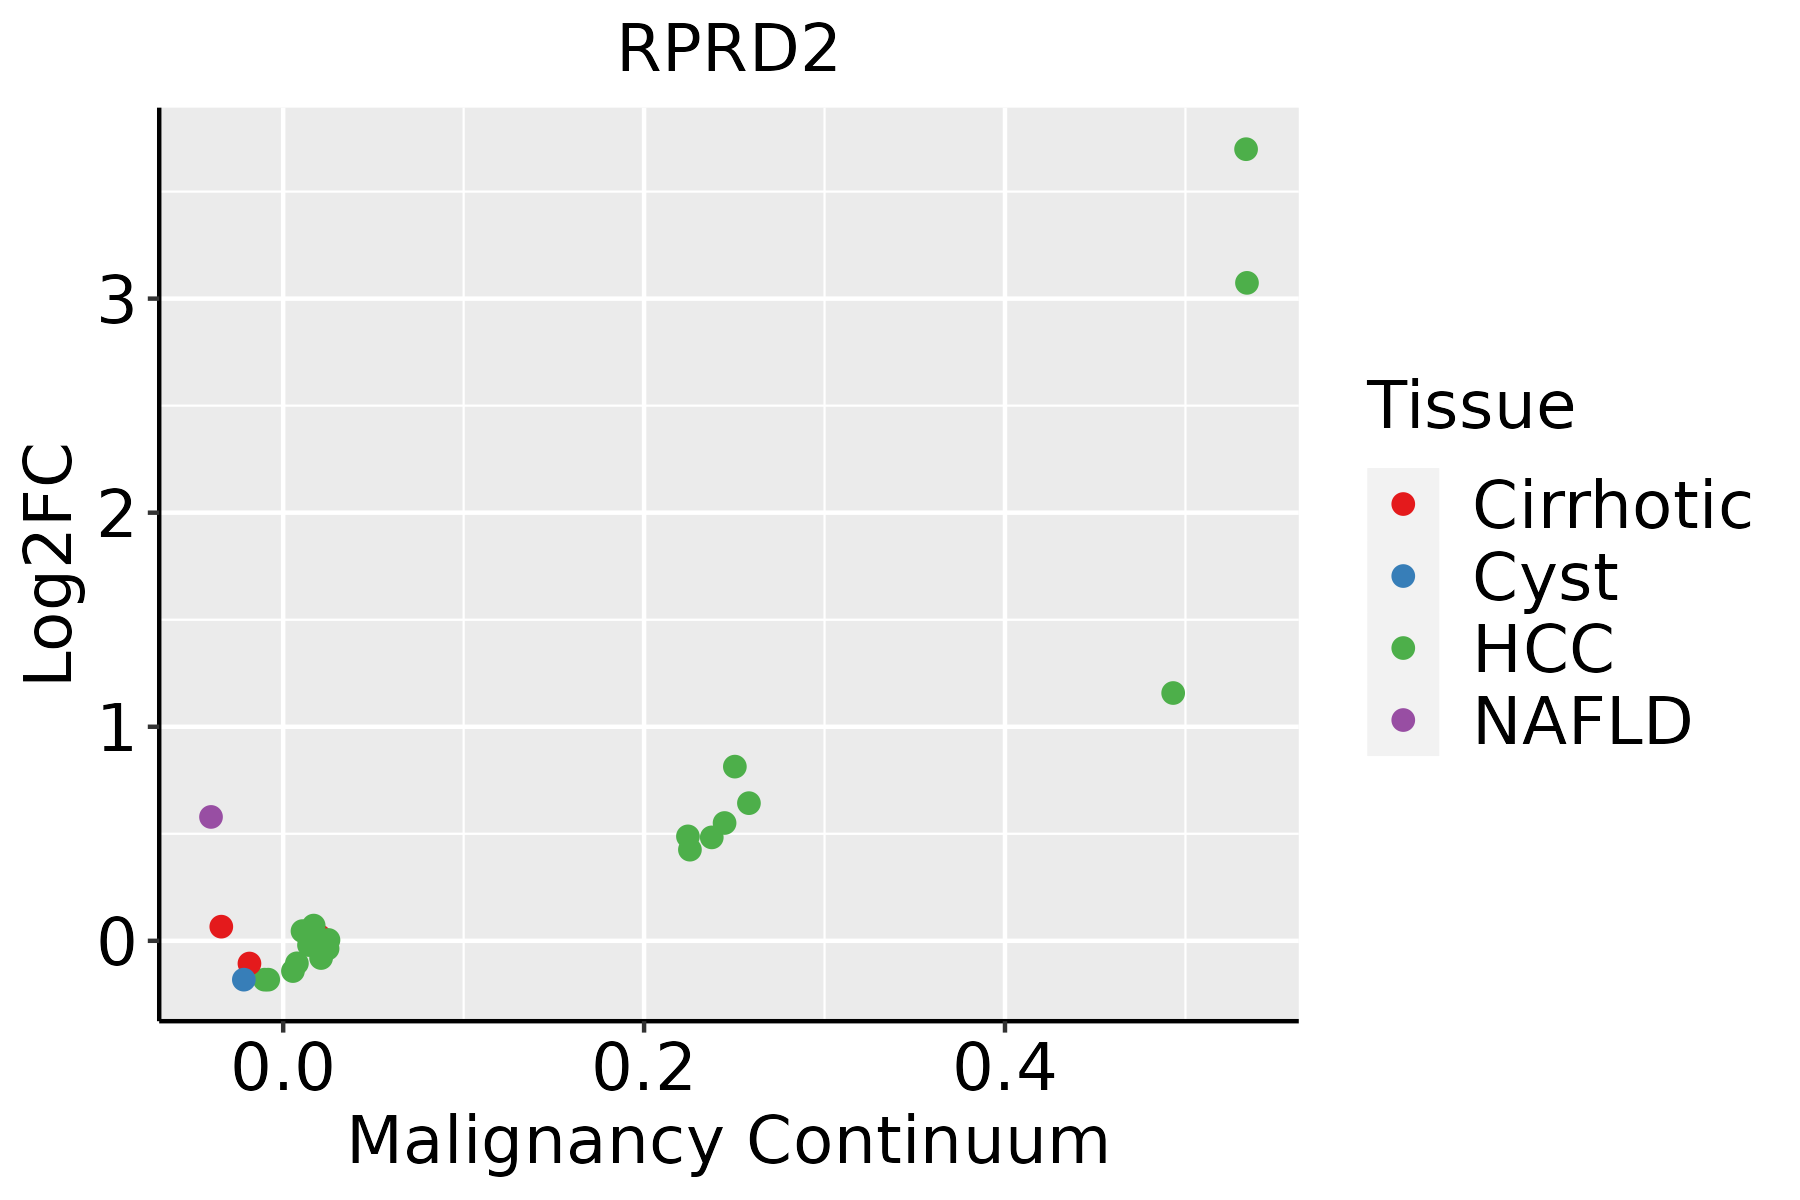 | HCC: Hepatocellular carcinoma |
| NAFLD: Non-alcoholic fatty liver disease | ||
| Lung | 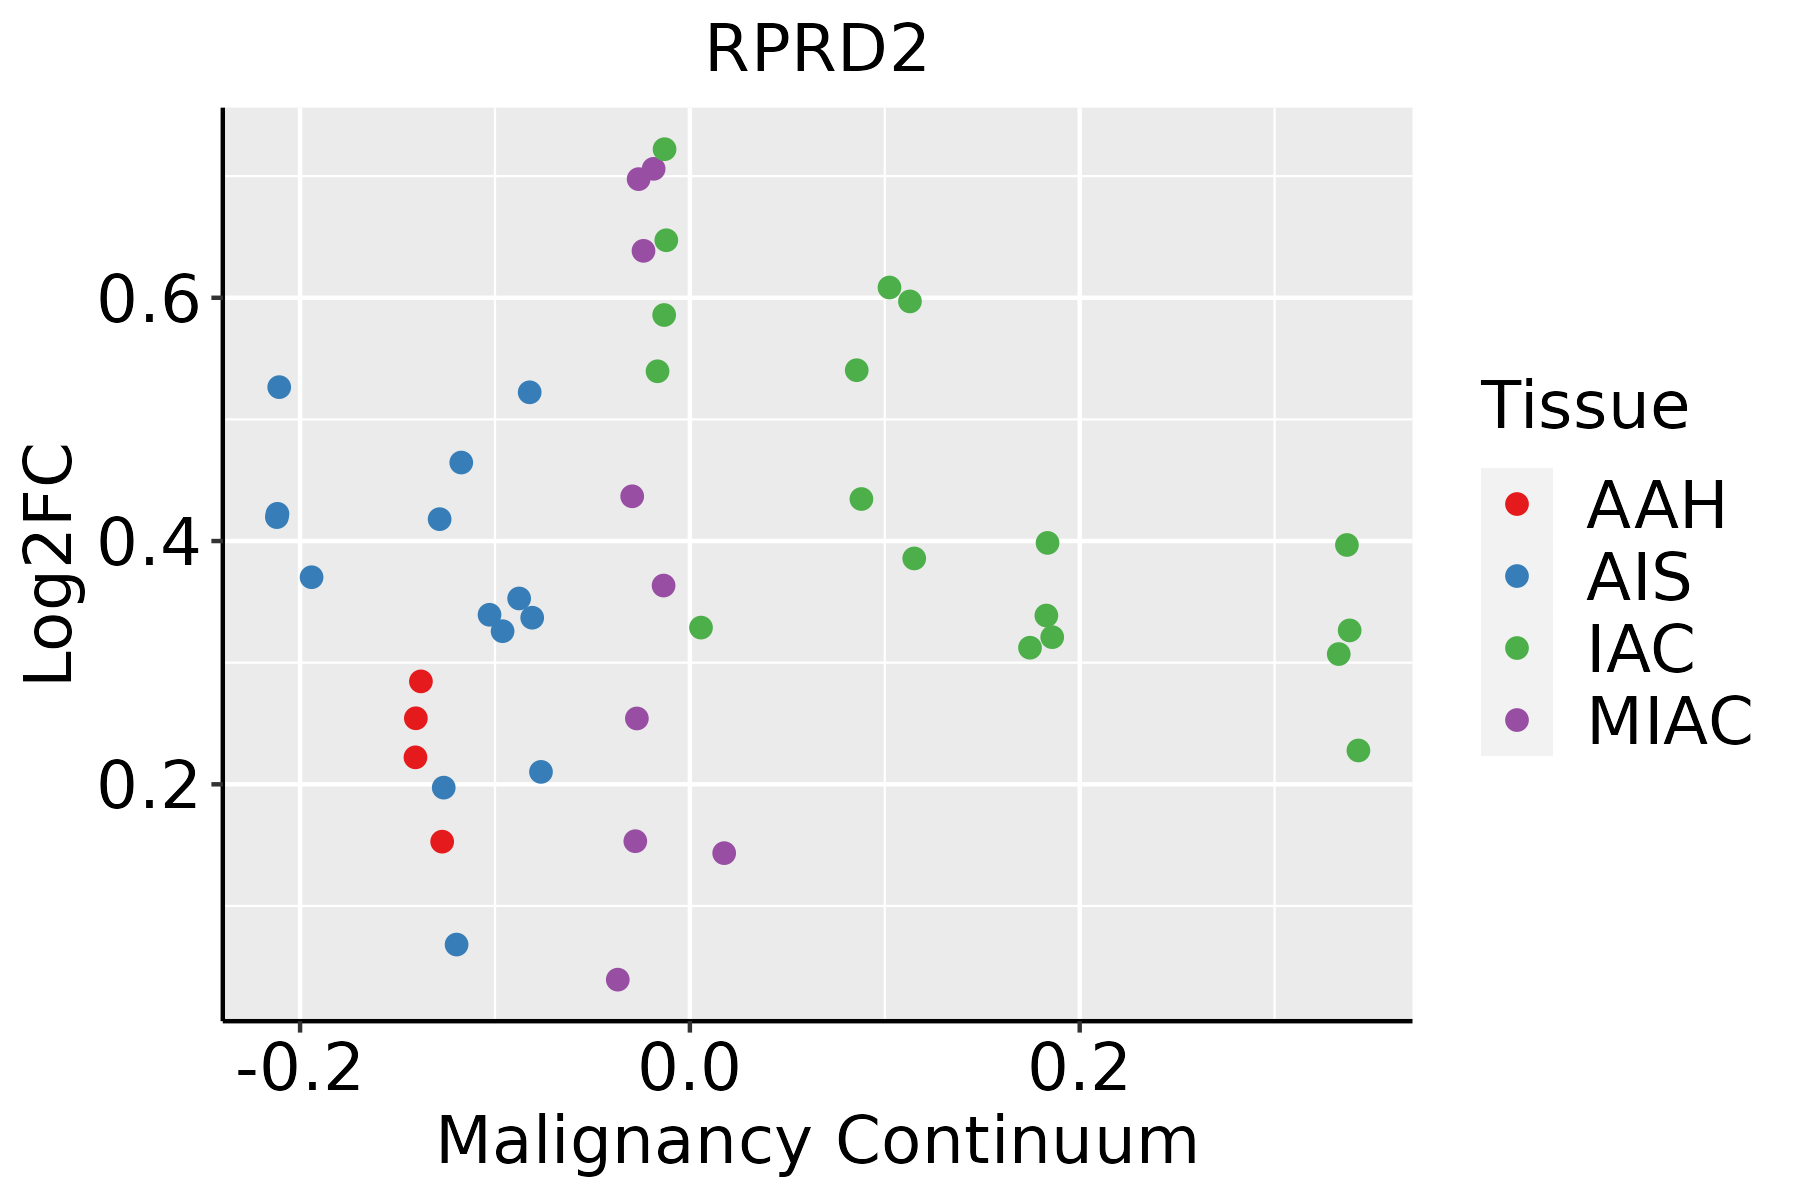 | AAH: Atypical adenomatous hyperplasia |
| AIS: Adenocarcinoma in situ | ||
| IAC: Invasive lung adenocarcinoma | ||
| MIA: Minimally invasive adenocarcinoma | ||
| Oral Cavity | 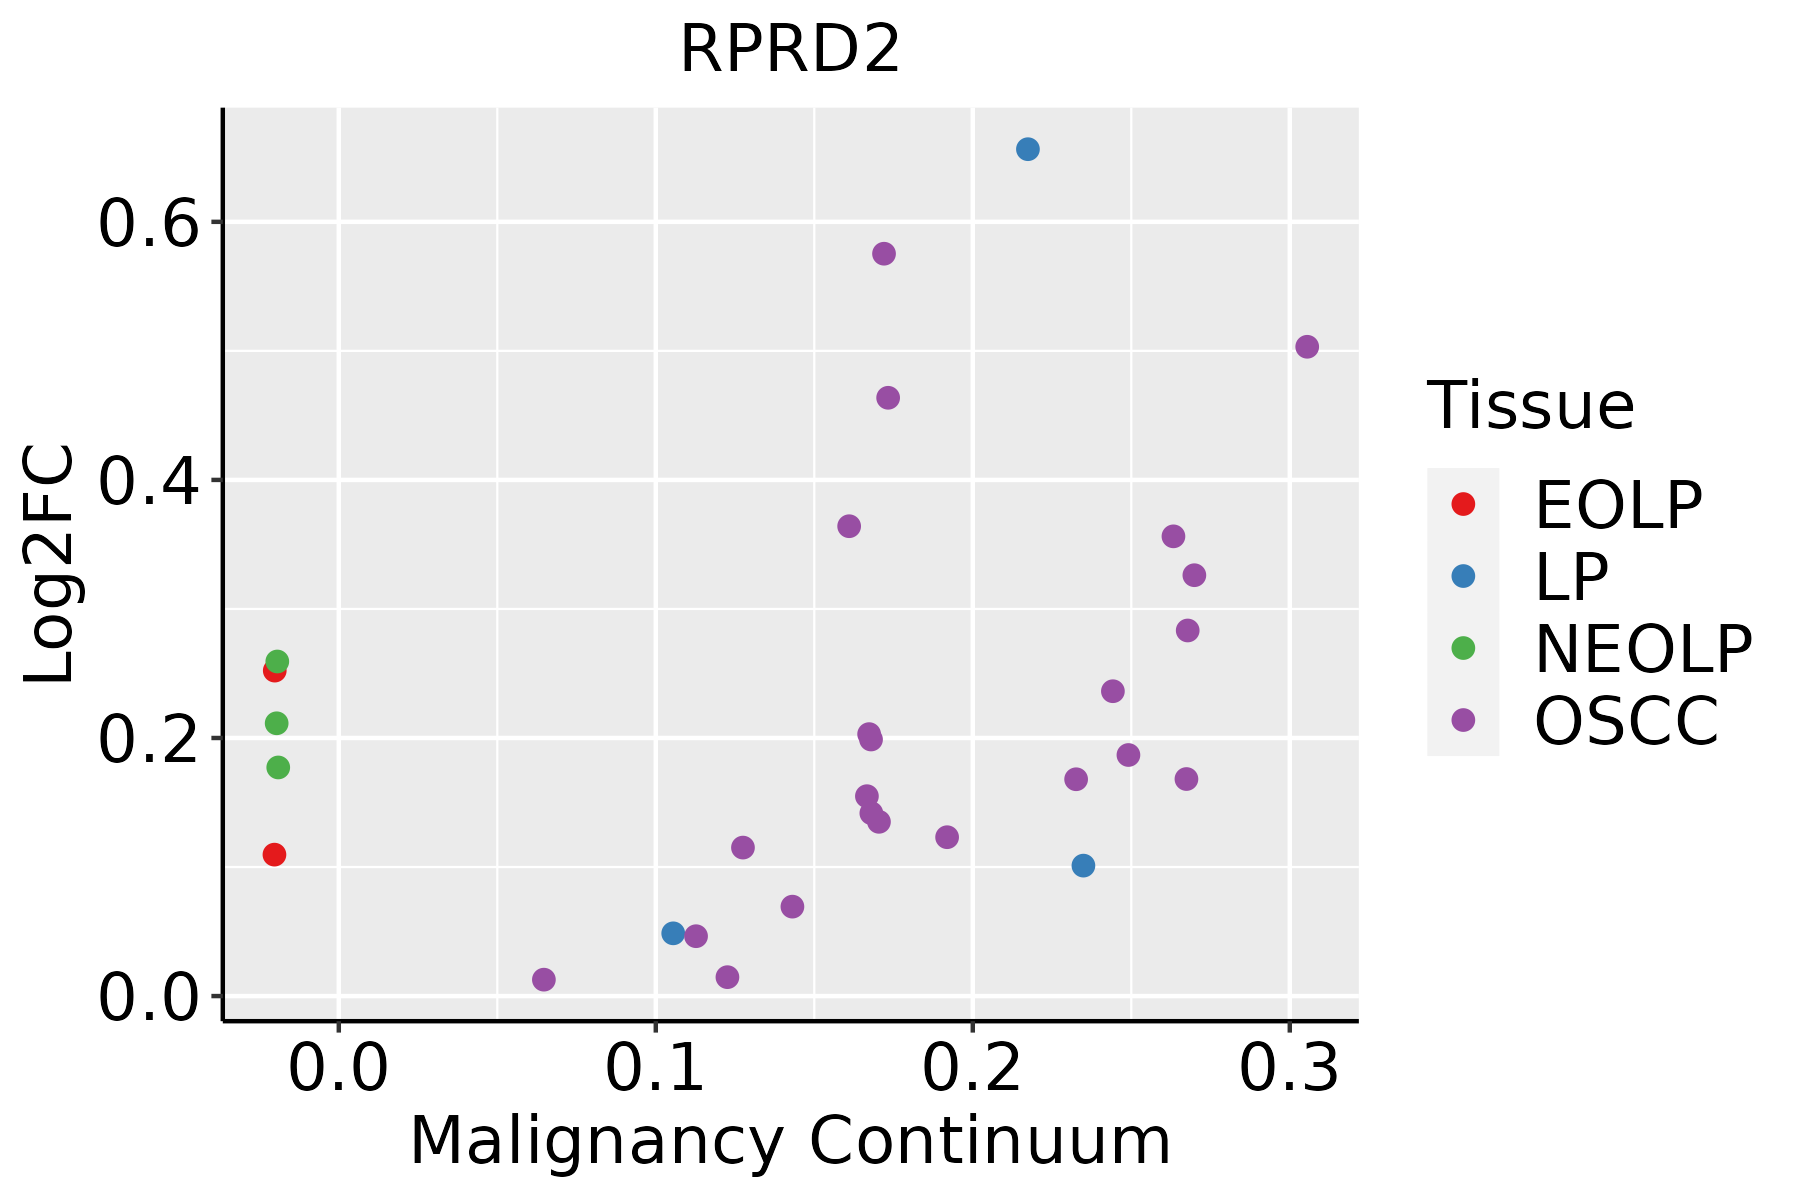 | EOLP: Erosive Oral lichen planus |
| LP: leukoplakia | ||
| NEOLP: Non-erosive oral lichen planus | ||
| OSCC: Oral squamous cell carcinoma | ||
| Prostate | 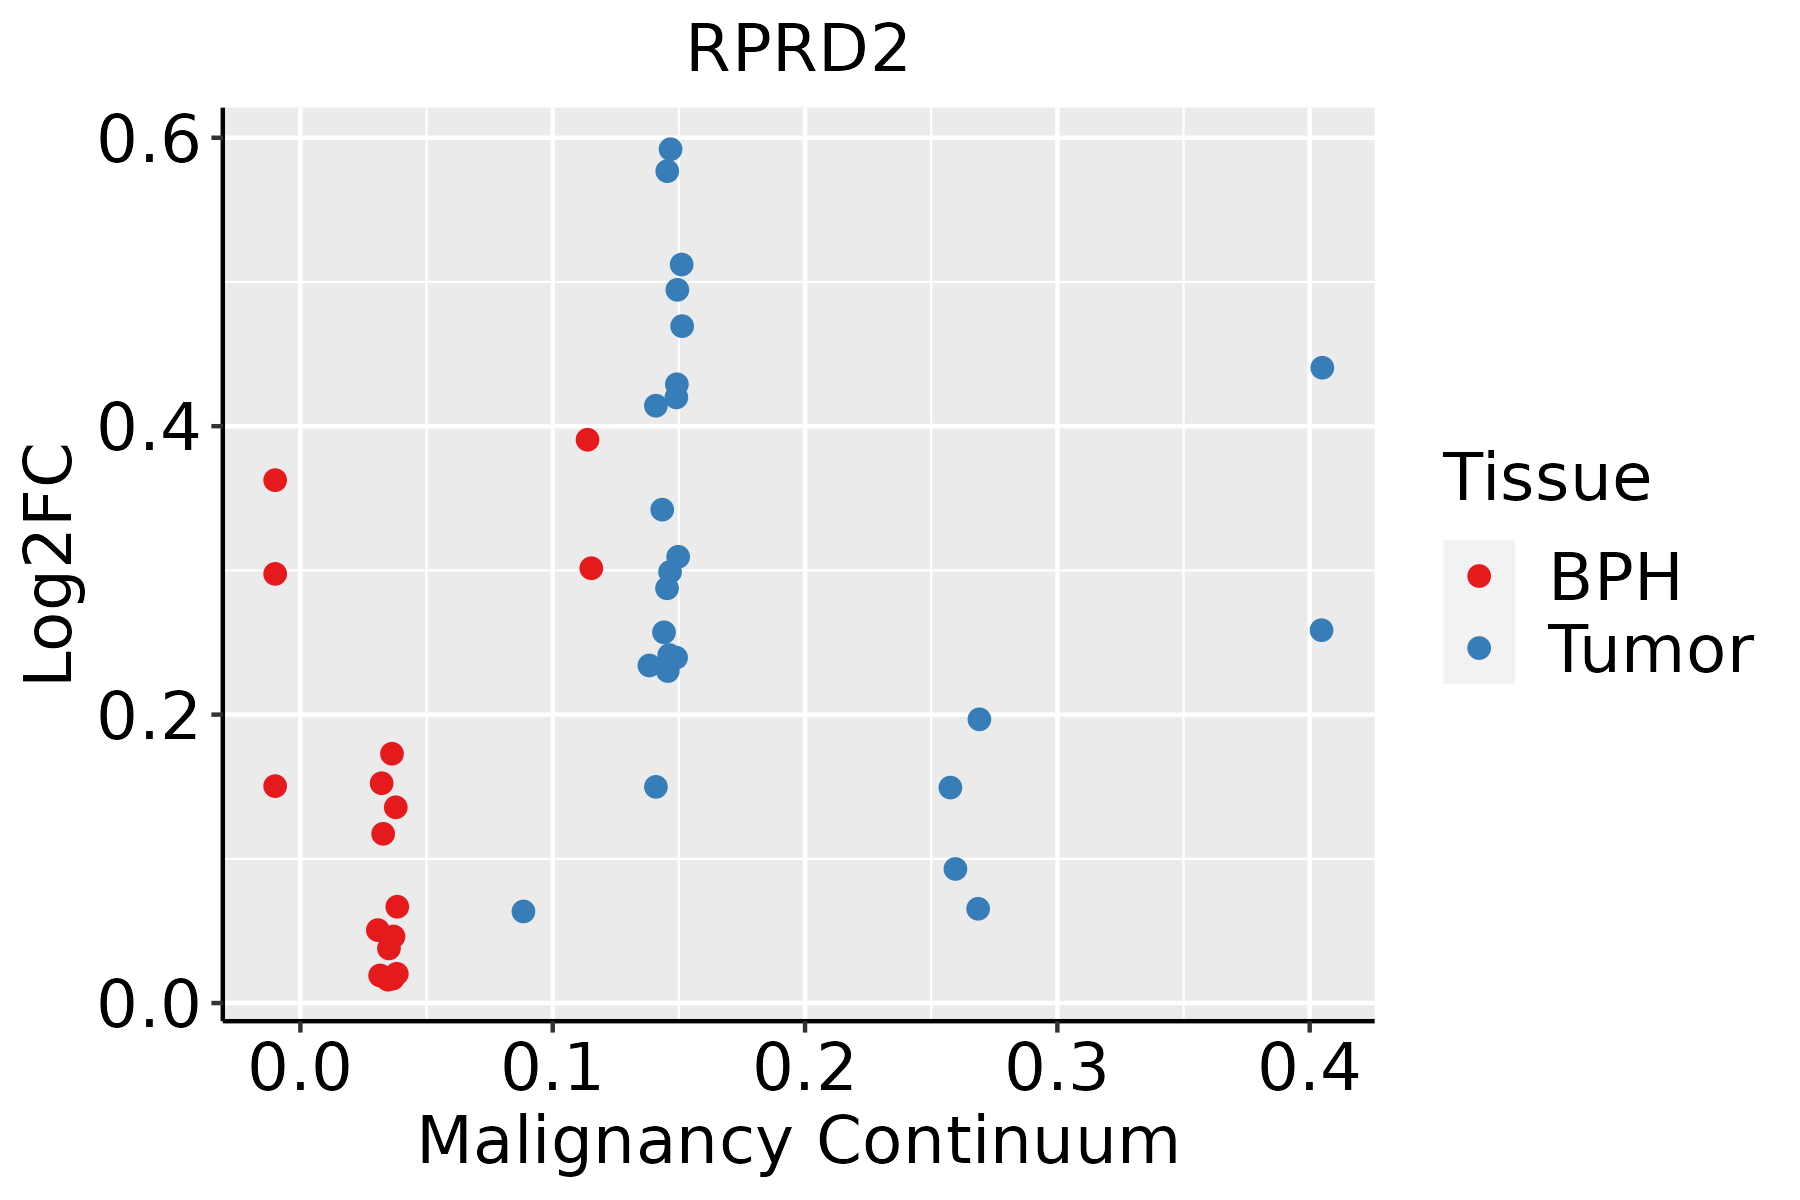 | BPH: Benign Prostatic Hyperplasia |
| Thyroid | 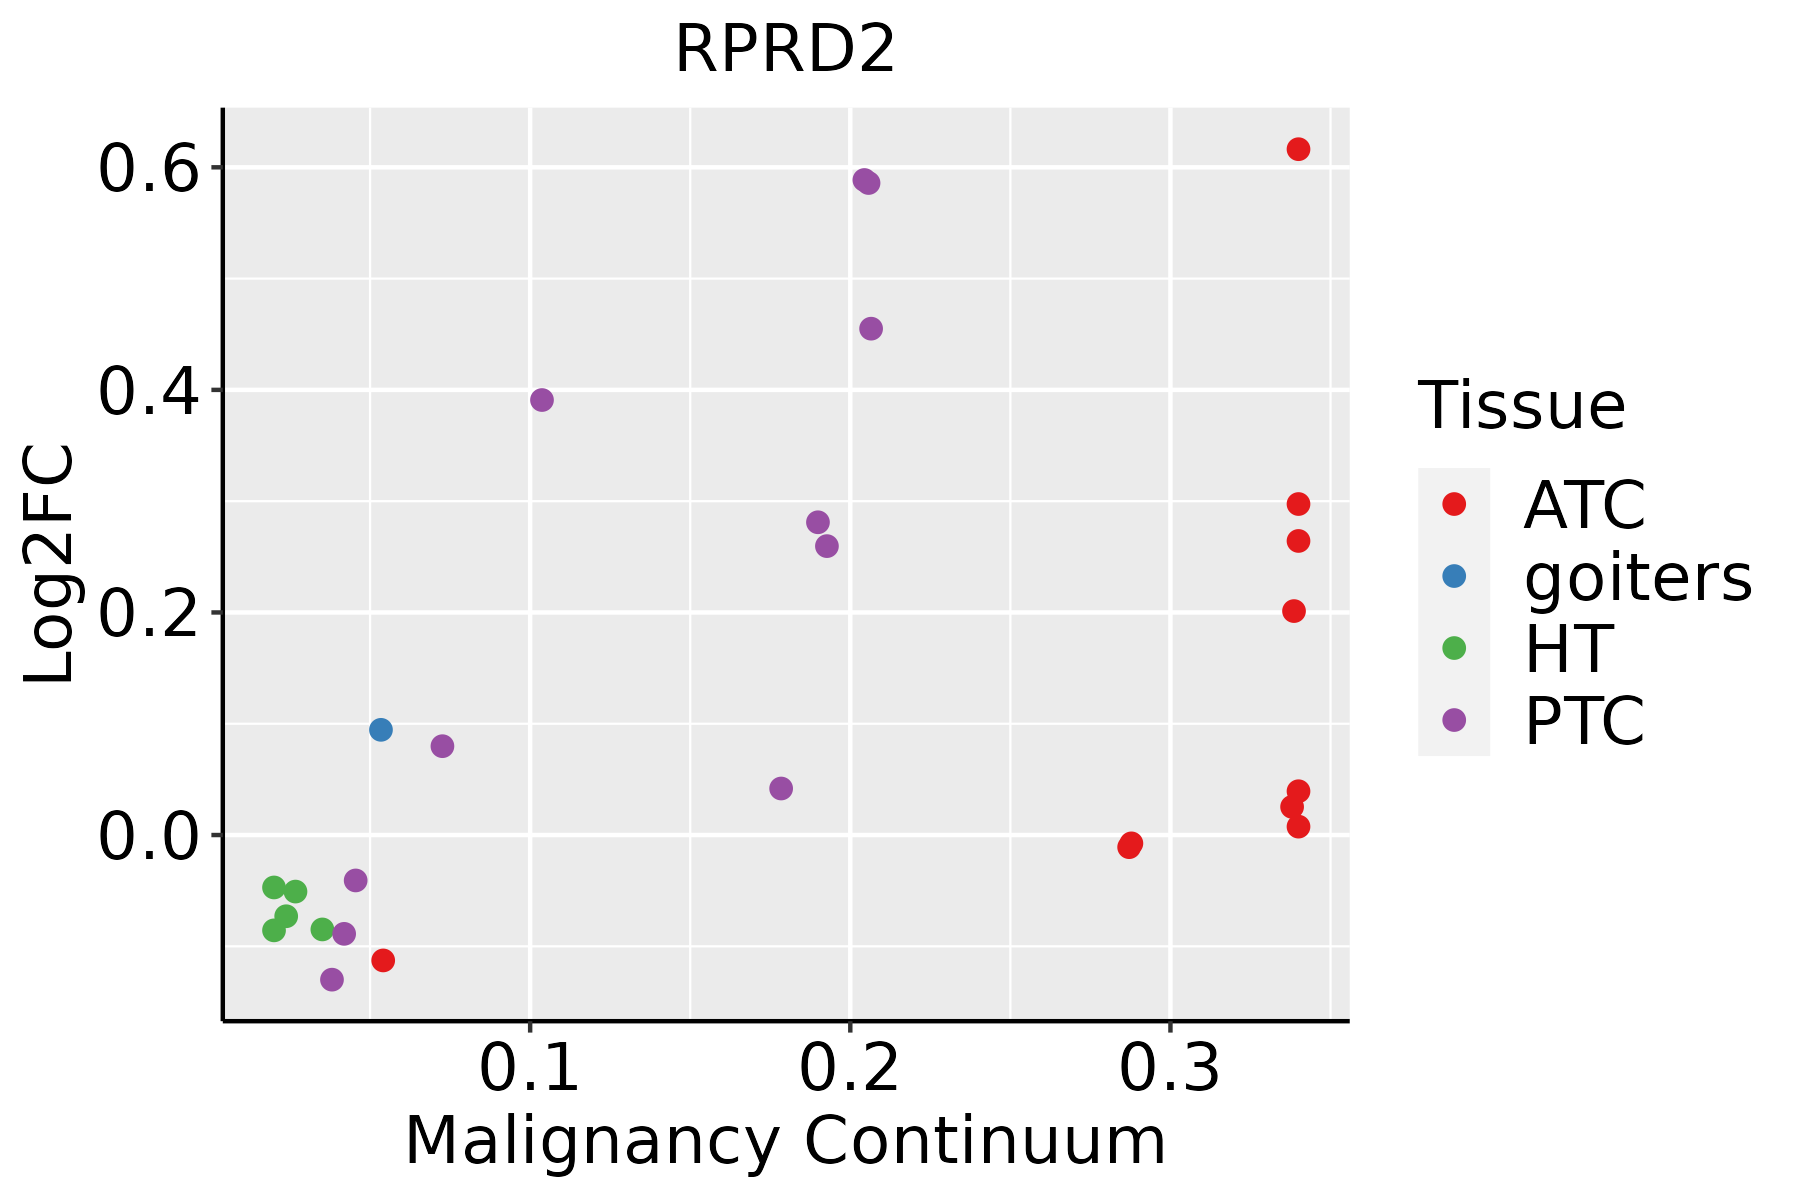 | ATC: Anaplastic thyroid cancer |
| HT: Hashimoto's thyroiditis | ||
| PTC: Papillary thyroid cancer |
| ∗log2FC in expression of this searched gene in stem-like cells from each diseased tissue sample relative to stem-like cells in normal samples in each tissue plotted against the malignancy continuum. Samples are colored based on if they are from different disease stage. |
Top |
Malignant transformation related pathway analysis |
| Find out the enriched GO biological processes and KEGG pathways involved in transition from healthy to precancer to cancer |
| Tissue | Disease Stage | Enriched GO biological Processes |
| Colorectum | AD |  |
| Colorectum | SER |  |
| Colorectum | MSS |  |
| Colorectum | MSI-H |  |
| Colorectum | FAP |  |
| ∗Top 15 enriched GO BP terms are showed in the bar plot of each disease state in each tissue. Each row represents a significant GO biological process which is colored according to the -log10(p.adjust). |
| Page: 1 2 3 4 5 6 7 8 9 |
| GO ID | Tissue | Disease Stage | Description | Gene Ratio | Bg Ratio | pvalue | p.adjust | Count |
| GO:003112412 | Esophagus | ESCC | mRNA 3'-end processing | 47/8552 | 62/18723 | 1.29e-06 | 1.58e-05 | 47 |
| GO:00311233 | Esophagus | ESCC | RNA 3'-end processing | 76/8552 | 116/18723 | 1.25e-05 | 1.15e-04 | 76 |
| GO:00311241 | Liver | HCC | mRNA 3'-end processing | 50/7958 | 62/18723 | 8.44e-10 | 2.60e-08 | 50 |
| GO:00311231 | Liver | HCC | RNA 3'-end processing | 81/7958 | 116/18723 | 2.27e-09 | 6.32e-08 | 81 |
| GO:00311242 | Oral cavity | OSCC | mRNA 3'-end processing | 49/7305 | 62/18723 | 1.40e-10 | 4.14e-09 | 49 |
| GO:00311232 | Oral cavity | OSCC | RNA 3'-end processing | 75/7305 | 116/18723 | 1.93e-08 | 3.79e-07 | 75 |
| GO:00311235 | Thyroid | PTC | RNA 3'-end processing | 65/5968 | 116/18723 | 6.24e-08 | 1.30e-06 | 65 |
| GO:00311245 | Thyroid | PTC | mRNA 3'-end processing | 40/5968 | 62/18723 | 1.28e-07 | 2.48e-06 | 40 |
| GO:003112312 | Thyroid | ATC | RNA 3'-end processing | 65/6293 | 116/18723 | 5.58e-07 | 7.93e-06 | 65 |
| GO:003112413 | Thyroid | ATC | mRNA 3'-end processing | 40/6293 | 62/18723 | 6.25e-07 | 8.65e-06 | 40 |
| Page: 1 |
| Pathway ID | Tissue | Disease Stage | Description | Gene Ratio | Bg Ratio | pvalue | p.adjust | qvalue | Count |
| Page: 1 |
Top |
Cell-cell communication analysis |
| Identification of potential cell-cell interactions between two cell types and their ligand-receptor pairs for different disease states |
| Ligand | Receptor | LRpair | Pathway | Tissue | Disease Stage |
| Page: 1 |
Top |
Single-cell gene regulatory network inference analysis |
| Find out the significant the regulons (TFs) and the target genes of each regulon across cell types for different disease states |
| TF | Cell Type | Tissue | Disease Stage | Target Gene | RSS | Regulon Activity |
| ∗The dot plots of a searched regulon are shown for all cell subpopulations in each disease state of each tissue based on the regulon specific score inferred using pySCENIC and by calculating the average expression. |
| Page: 1 |
Top |
Somatic mutation of malignant transformation related genes |
| Annotation of somatic variants for genes involved in malignant transformation |
| Hugo Symbol | Variant Class | Variant Classification | dbSNP RS | HGVSc | HGVSp | HGVSp Short | SWISSPROT | BIOTYPE | SIFT | PolyPhen | Tumor Sample Barcode | Tissue | Histology | Sex | Age | Stage | Therapy Types | Drugs | Outcome |
| RPRD2 | SNV | Missense_Mutation | novel | c.443N>G | p.Thr148Ser | p.T148S | Q5VT52 | protein_coding | tolerated_low_confidence(0.18) | benign(0.011) | TCGA-3C-AALI-01 | Breast | breast invasive carcinoma | Female | <65 | I/II | Unspecific | Poly E | Complete Response |
| RPRD2 | SNV | Missense_Mutation | novel | c.3275G>T | p.Ser1092Ile | p.S1092I | Q5VT52 | protein_coding | deleterious_low_confidence(0) | benign(0.054) | TCGA-A2-A0EP-01 | Breast | breast invasive carcinoma | Female | <65 | I/II | Chemotherapy | cyclophosphamide | CR |
| RPRD2 | SNV | Missense_Mutation | novel | c.3706N>G | p.Pro1236Ala | p.P1236A | Q5VT52 | protein_coding | deleterious_low_confidence(0) | benign(0.001) | TCGA-AO-A0JD-01 | Breast | breast invasive carcinoma | Female | <65 | III/IV | Chemotherapy | cyclophosphamide | SD |
| RPRD2 | SNV | Missense_Mutation | c.1123G>T | p.Asp375Tyr | p.D375Y | Q5VT52 | protein_coding | deleterious_low_confidence(0) | probably_damaging(0.986) | TCGA-AR-A1AR-01 | Breast | breast invasive carcinoma | Female | <65 | III/IV | Unspecific | Docetaxel | PD | |
| RPRD2 | deletion | In_Frame_Del | novel | c.2878_2883delAAGCAG | p.Lys960_Gln961del | p.K960_Q961del | Q5VT52 | protein_coding | TCGA-A2-A3XT-01 | Breast | breast invasive carcinoma | Female | <65 | I/II | Chemotherapy | cyclophosphamide | PR | ||
| RPRD2 | insertion | Frame_Shift_Ins | novel | c.3704_3705insCAGAGAG | p.Pro1236ArgfsTer47 | p.P1236Rfs*47 | Q5VT52 | protein_coding | TCGA-AO-A0JD-01 | Breast | breast invasive carcinoma | Female | <65 | III/IV | Chemotherapy | cyclophosphamide | SD | ||
| RPRD2 | insertion | In_Frame_Ins | novel | c.1383_1384insGATTCTCGTGTCTCAGCCTCTGTAGTAGCTGGG | p.Ser461_Ser462insAspSerArgValSerAlaSerValValAlaGly | p.S461_S462insDSRVSASVVAG | Q5VT52 | protein_coding | TCGA-B6-A0RE-01 | Breast | breast invasive carcinoma | Female | <65 | I/II | Unknown | Unknown | SD | ||
| RPRD2 | SNV | Missense_Mutation | novel | c.381G>T | p.Trp127Cys | p.W127C | Q5VT52 | protein_coding | deleterious_low_confidence(0) | possibly_damaging(0.887) | TCGA-C5-A2M1-01 | Cervix | cervical & endocervical cancer | Female | <65 | I/II | Unknown | Unknown | SD |
| RPRD2 | SNV | Missense_Mutation | rs748820473 | c.3469G>A | p.Gly1157Arg | p.G1157R | Q5VT52 | protein_coding | deleterious_low_confidence(0) | benign(0.344) | TCGA-MA-AA42-01 | Cervix | cervical & endocervical cancer | Female | >=65 | I/II | Unknown | Unknown | SD |
| RPRD2 | SNV | Missense_Mutation | c.1060G>A | p.Glu354Lys | p.E354K | Q5VT52 | protein_coding | tolerated_low_confidence(0.21) | benign(0) | TCGA-Q1-A73O-01 | Cervix | cervical & endocervical cancer | Female | <65 | I/II | Chemotherapy | cisplatin | CR |
| Page: 1 2 3 4 5 6 7 8 9 10 11 12 13 |
Top |
Related drugs of malignant transformation related genes |
| Identification of chemicals and drugs interact with genes involved in malignant transfromation |
| (DGIdb 4.0) |
| Entrez ID | Symbol | Category | Interaction Types | Drug Claim Name | Drug Name | PMIDs |
| Page: 1 |

Copyright 2023-Present -The University of Texas Health Science Center at Houston |