| Tissue | Expression Dynamics | Abbreviation |
| Breast | 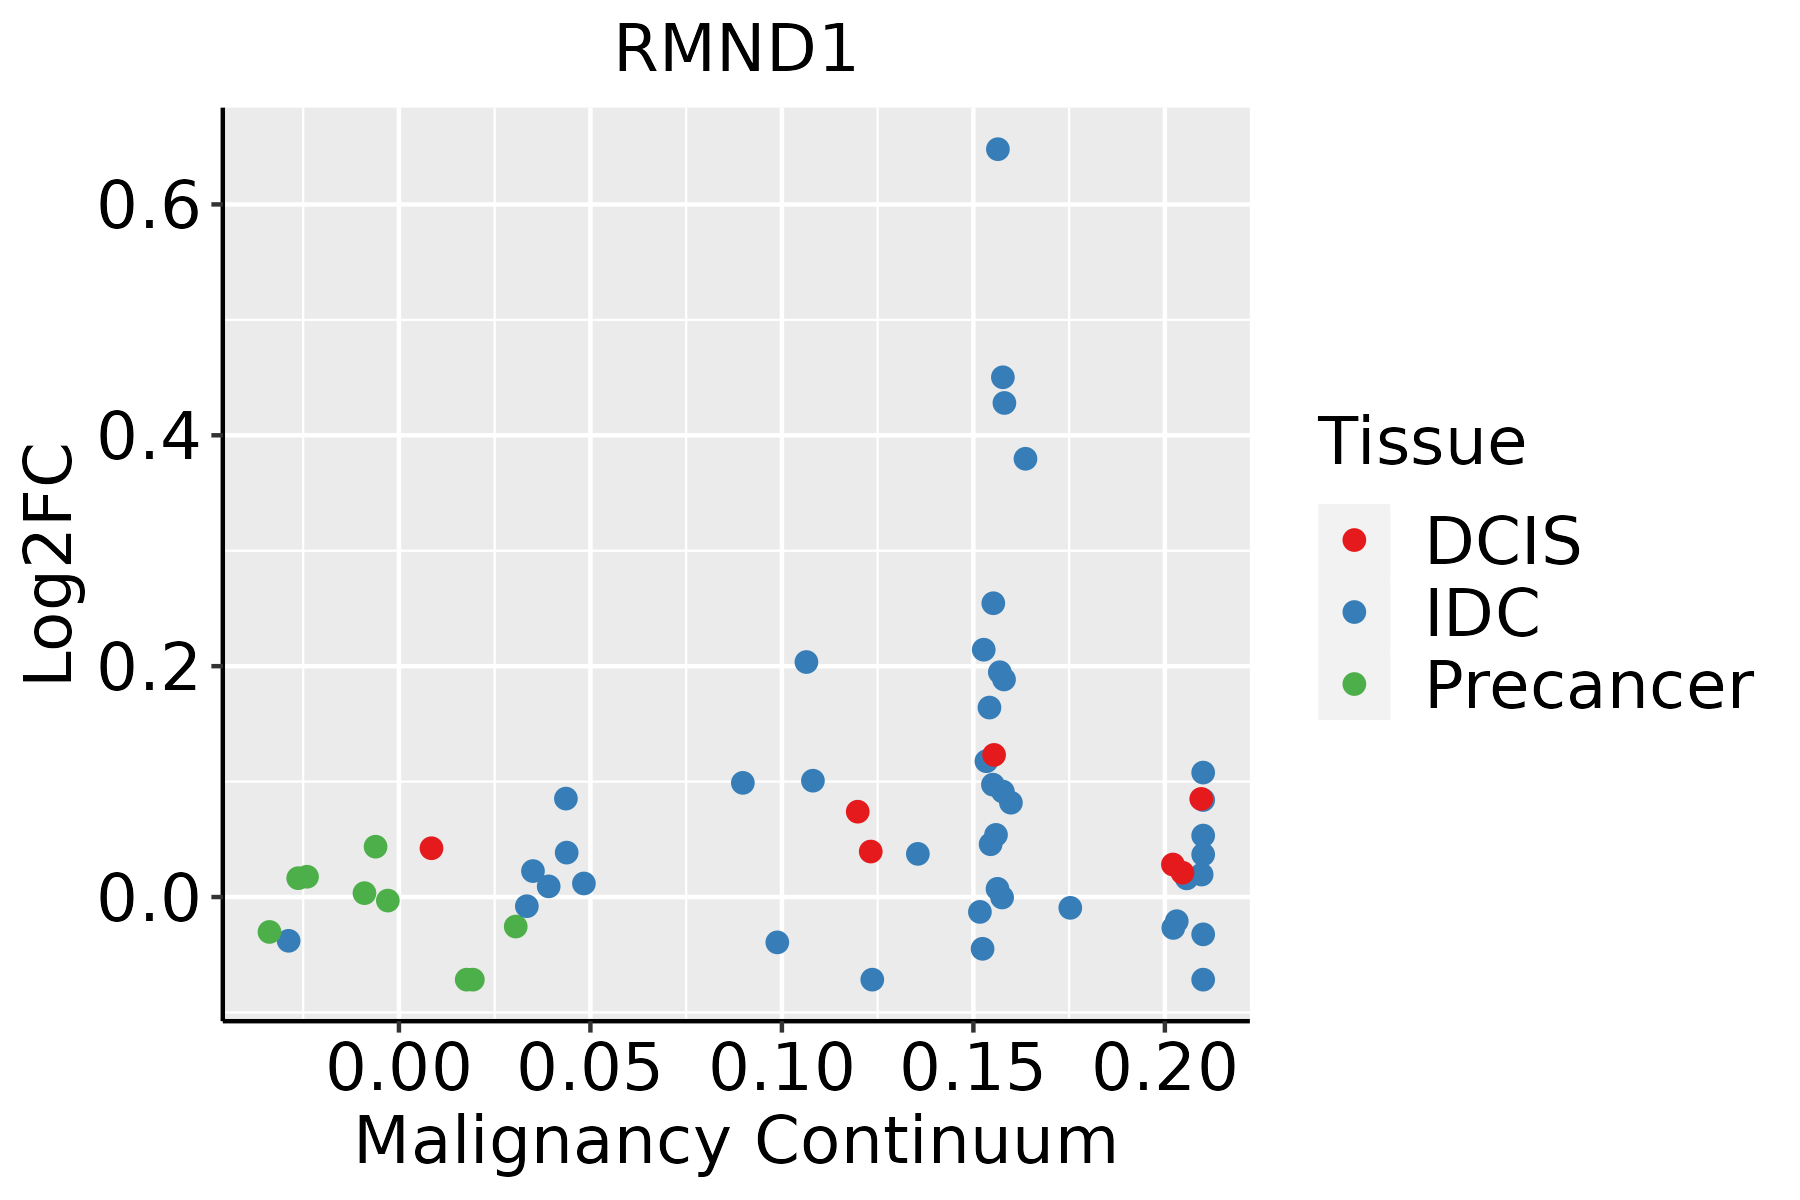 | IDC: Invasive ductal carcinoma |
| DCIS: Ductal carcinoma in situ |
| Precancer(BRCA1-mut): Precancerous lesion from BRCA1 mutation carriers |
| Esophagus | 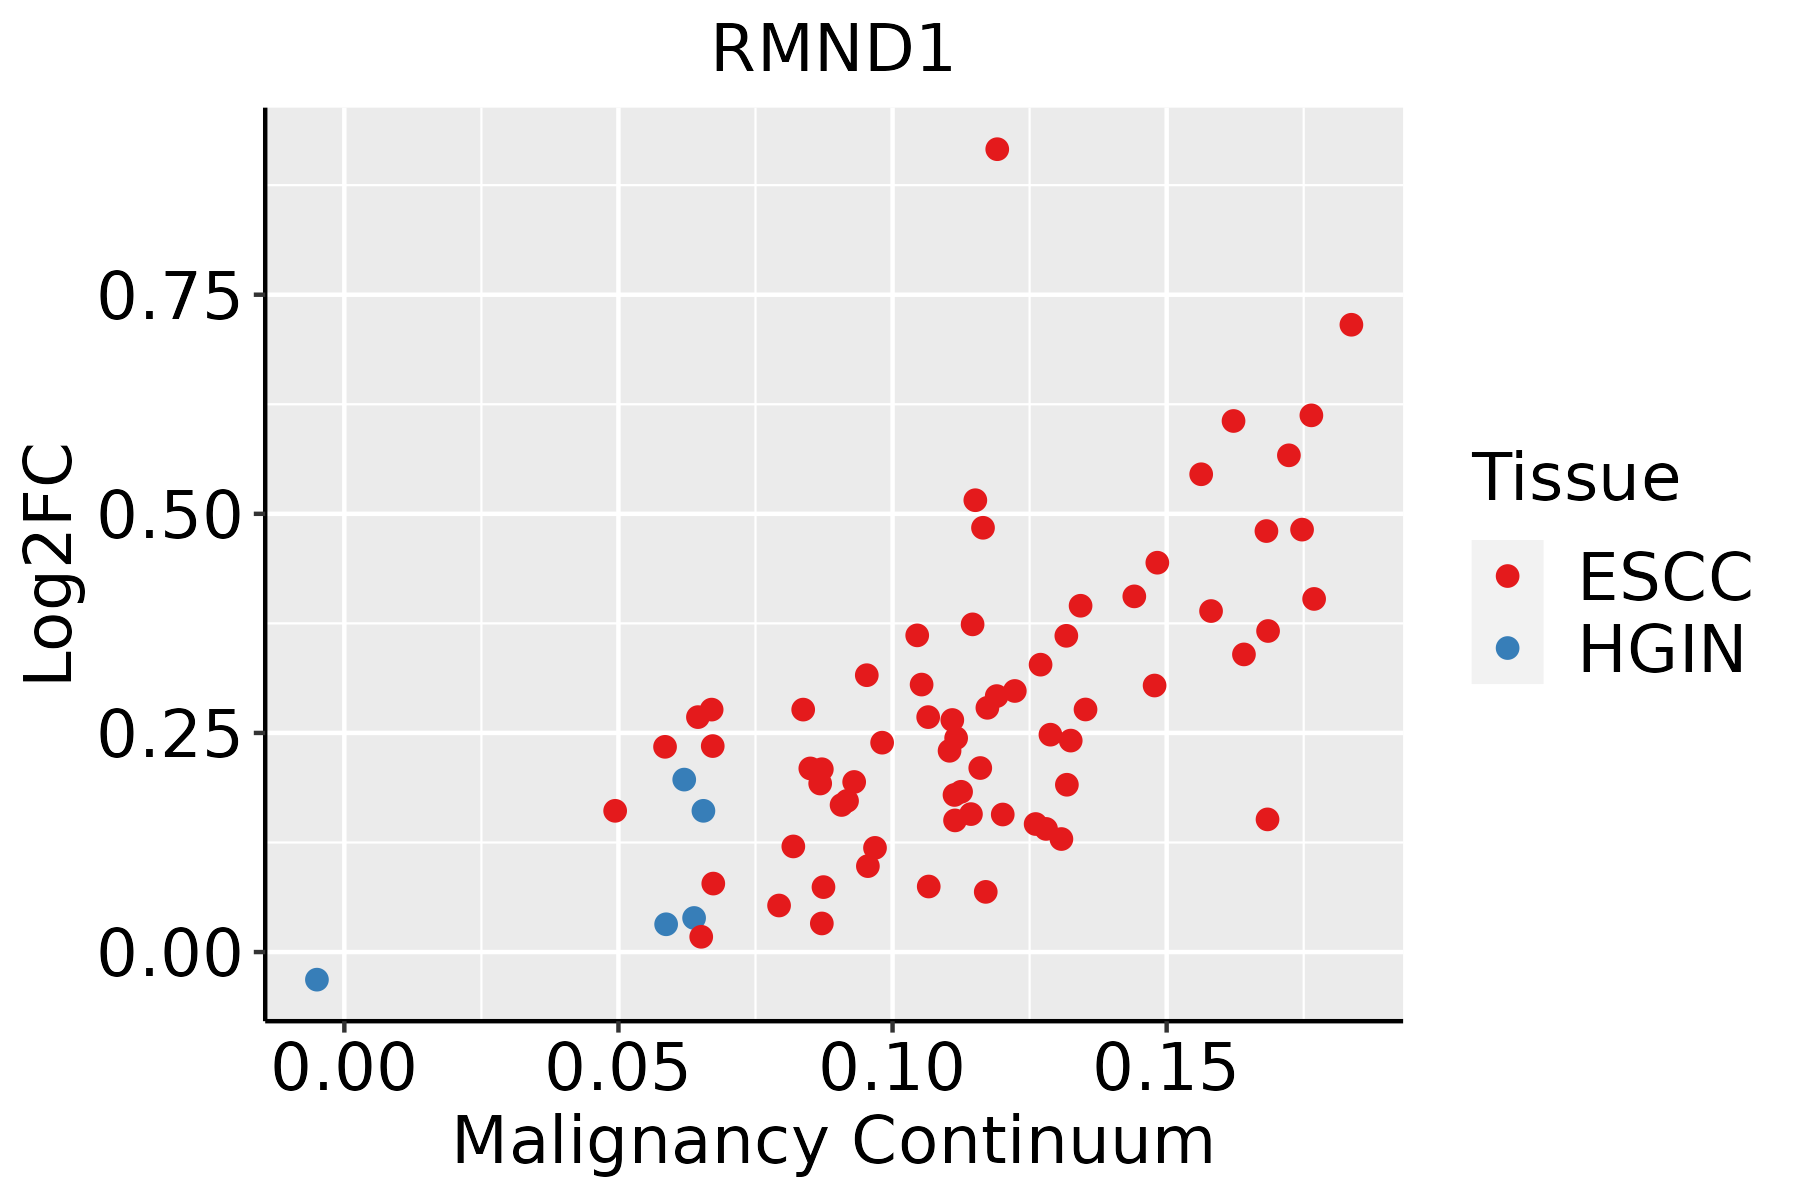 | ESCC: Esophageal squamous cell carcinoma |
| HGIN: High-grade intraepithelial neoplasias |
| LGIN: Low-grade intraepithelial neoplasias |
| Liver |  | HCC: Hepatocellular carcinoma |
| NAFLD: Non-alcoholic fatty liver disease |
| Thyroid |  | ATC: Anaplastic thyroid cancer |
| HT: Hashimoto's thyroiditis |
| PTC: Papillary thyroid cancer |
| GO ID | Tissue | Disease Stage | Description | Gene Ratio | Bg Ratio | pvalue | p.adjust | Count |
| GO:000641714 | Breast | IDC | regulation of translation | 74/1434 | 468/18723 | 1.67e-09 | 1.53e-07 | 74 |
| GO:004572714 | Breast | IDC | positive regulation of translation | 33/1434 | 136/18723 | 1.92e-09 | 1.73e-07 | 33 |
| GO:003425014 | Breast | IDC | positive regulation of cellular amide metabolic process | 35/1434 | 162/18723 | 1.63e-08 | 1.16e-06 | 35 |
| GO:00325432 | Breast | IDC | mitochondrial translation | 13/1434 | 76/18723 | 4.81e-03 | 3.67e-02 | 13 |
| GO:000641724 | Breast | DCIS | regulation of translation | 72/1390 | 468/18723 | 2.46e-09 | 2.17e-07 | 72 |
| GO:004572724 | Breast | DCIS | positive regulation of translation | 32/1390 | 136/18723 | 3.56e-09 | 3.10e-07 | 32 |
| GO:003425023 | Breast | DCIS | positive regulation of cellular amide metabolic process | 34/1390 | 162/18723 | 2.60e-08 | 1.73e-06 | 34 |
| GO:003254311 | Breast | DCIS | mitochondrial translation | 13/1390 | 76/18723 | 3.70e-03 | 2.99e-02 | 13 |
| GO:014005313 | Esophagus | ESCC | mitochondrial gene expression | 93/8552 | 108/18723 | 1.96e-18 | 2.03e-16 | 93 |
| GO:0006417111 | Esophagus | ESCC | regulation of translation | 304/8552 | 468/18723 | 1.53e-17 | 1.33e-15 | 304 |
| GO:003254314 | Esophagus | ESCC | mitochondrial translation | 68/8552 | 76/18723 | 1.02e-15 | 6.86e-14 | 68 |
| GO:0045727111 | Esophagus | ESCC | positive regulation of translation | 107/8552 | 136/18723 | 2.79e-15 | 1.68e-13 | 107 |
| GO:0034250111 | Esophagus | ESCC | positive regulation of cellular amide metabolic process | 123/8552 | 162/18723 | 3.32e-15 | 1.93e-13 | 123 |
| GO:00701292 | Esophagus | ESCC | regulation of mitochondrial translation | 22/8552 | 24/18723 | 2.82e-06 | 3.21e-05 | 22 |
| GO:00621252 | Esophagus | ESCC | regulation of mitochondrial gene expression | 24/8552 | 28/18723 | 1.37e-05 | 1.25e-04 | 24 |
| GO:00701312 | Esophagus | ESCC | positive regulation of mitochondrial translation | 14/8552 | 15/18723 | 1.47e-04 | 9.85e-04 | 14 |
| GO:000641722 | Liver | HCC | regulation of translation | 287/7958 | 468/18723 | 8.79e-17 | 8.08e-15 | 287 |
| GO:01400531 | Liver | HCC | mitochondrial gene expression | 82/7958 | 108/18723 | 1.49e-12 | 7.20e-11 | 82 |
| GO:00325431 | Liver | HCC | mitochondrial translation | 62/7958 | 76/18723 | 2.95e-12 | 1.34e-10 | 62 |
| GO:004572712 | Liver | HCC | positive regulation of translation | 97/7958 | 136/18723 | 8.51e-12 | 3.55e-10 | 97 |
| Hugo Symbol | Variant Class | Variant Classification | dbSNP RS | HGVSc | HGVSp | HGVSp Short | SWISSPROT | BIOTYPE | SIFT | PolyPhen | Tumor Sample Barcode | Tissue | Histology | Sex | Age | Stage | Therapy Types | Drugs | Outcome |
| RMND1 | SNV | Missense_Mutation | | c.20G>A | p.Arg7Lys | p.R7K | Q9NWS8 | protein_coding | tolerated_low_confidence(0.21) | benign(0.027) | TCGA-AC-A23H-01 | Breast | breast invasive carcinoma | Female | >=65 | I/II | Unknown | Unknown | PD |
| RMND1 | SNV | Missense_Mutation | | c.103G>A | p.Glu35Lys | p.E35K | Q9NWS8 | protein_coding | tolerated_low_confidence(0.26) | benign(0) | TCGA-BH-A0DZ-01 | Breast | breast invasive carcinoma | Female | <65 | I/II | Chemotherapy | docetaxel | SD |
| RMND1 | SNV | Missense_Mutation | | c.163N>G | p.Pro55Ala | p.P55A | Q9NWS8 | protein_coding | tolerated_low_confidence(0.22) | benign(0.211) | TCGA-D8-A13Z-01 | Breast | breast invasive carcinoma | Female | <65 | I/II | Chemotherapy | doxorubicine | SD |
| RMND1 | SNV | Missense_Mutation | | c.275N>G | p.Lys92Arg | p.K92R | Q9NWS8 | protein_coding | tolerated(0.29) | benign(0) | TCGA-E2-A15D-01 | Breast | breast invasive carcinoma | Female | <65 | I/II | Hormone Therapy | tamoxiphen | SD |
| RMND1 | SNV | Missense_Mutation | rs138900217 | c.329N>C | p.Lys110Thr | p.K110T | Q9NWS8 | protein_coding | tolerated(0.09) | benign(0.003) | TCGA-EW-A1IZ-01 | Breast | breast invasive carcinoma | Female | <65 | III/IV | Chemotherapy | taxotere | SD |
| RMND1 | SNV | Missense_Mutation | novel | c.565N>G | p.Gln189Glu | p.Q189E | Q9NWS8 | protein_coding | tolerated(0.33) | benign(0.013) | TCGA-GM-A3NW-01 | Breast | breast invasive carcinoma | Female | <65 | I/II | Chemotherapy | fluorouracil | SD |
| RMND1 | insertion | Frame_Shift_Ins | novel | c.881_882insAGAGAATATACAATTTCTACCTAATAAAATTATGAAATTTC | p.Asp294GlufsTer16 | p.D294Efs*16 | Q9NWS8 | protein_coding | | | TCGA-A2-A0EV-01 | Breast | breast invasive carcinoma | Female | >=65 | I/II | Unknown | Unknown | SD |
| RMND1 | insertion | Nonsense_Mutation | novel | c.320_321insCTTTGAAGCCTAATAAATATCCAAAG | p.Thr108PhefsTer4 | p.T108Ffs*4 | Q9NWS8 | protein_coding | | | TCGA-AQ-A04J-01 | Breast | breast invasive carcinoma | Female | <65 | I/II | Chemotherapy | cytoxan | SD |
| RMND1 | SNV | Missense_Mutation | | c.49N>C | p.Ser17Pro | p.S17P | Q9NWS8 | protein_coding | tolerated_low_confidence(0.06) | benign(0) | TCGA-FU-A23L-01 | Cervix | cervical & endocervical cancer | Female | <65 | I/II | Chemotherapy | cisplatin | CR |
| RMND1 | SNV | Missense_Mutation | novel | c.242C>A | p.Ser81Tyr | p.S81Y | Q9NWS8 | protein_coding | tolerated_low_confidence(0.18) | benign(0) | TCGA-IR-A3LK-01 | Cervix | cervical & endocervical cancer | Female | >=65 | I/II | Chemotherapy | cisplatin | PD |


