
|
|||||
|
 | |
| |
| |
| |
| |
| |
|
Gene: RBM38 |
Gene summary for RBM38 |
| Gene information | Species | Human | Gene symbol | RBM38 | Gene ID | 55544 |
| Gene name | RNA binding motif protein 38 | |
| Gene Alias | HSRNASEB | |
| Cytomap | 20q13.31 | |
| Gene Type | protein-coding | GO ID | GO:0006139 | UniProtAcc | Q9H0Z9 |
Top |
Malignant transformation analysis |
| Identification of the aberrant gene expression in precancerous and cancerous lesions by comparing the gene expression of stem-like cells in diseased tissues with normal stem cells |
| Entrez ID | Symbol | Replicates | Species | Organ | Tissue | Adj P-value | Log2FC | Malignancy |
| 55544 | RBM38 | SYSMH2 | Human | Oral cavity | OSCC | 2.86e-16 | 3.46e-01 | 0.2326 |
| 55544 | RBM38 | SYSMH3 | Human | Oral cavity | OSCC | 7.47e-10 | 2.28e-01 | 0.2442 |
| 55544 | RBM38 | SYSMH5 | Human | Oral cavity | OSCC | 5.65e-08 | 1.60e-01 | 0.0647 |
| 55544 | RBM38 | SYSMH6 | Human | Oral cavity | OSCC | 4.56e-05 | 1.22e-01 | 0.1275 |
| Page: 1 2 3 4 5 |
| Tissue | Expression Dynamics | Abbreviation |
| Colorectum (GSE201348) |  | FAP: Familial adenomatous polyposis |
| CRC: Colorectal cancer | ||
| Colorectum (HTA11) |  | AD: Adenomas |
| SER: Sessile serrated lesions | ||
| MSI-H: Microsatellite-high colorectal cancer | ||
| MSS: Microsatellite stable colorectal cancer | ||
| Esophagus | 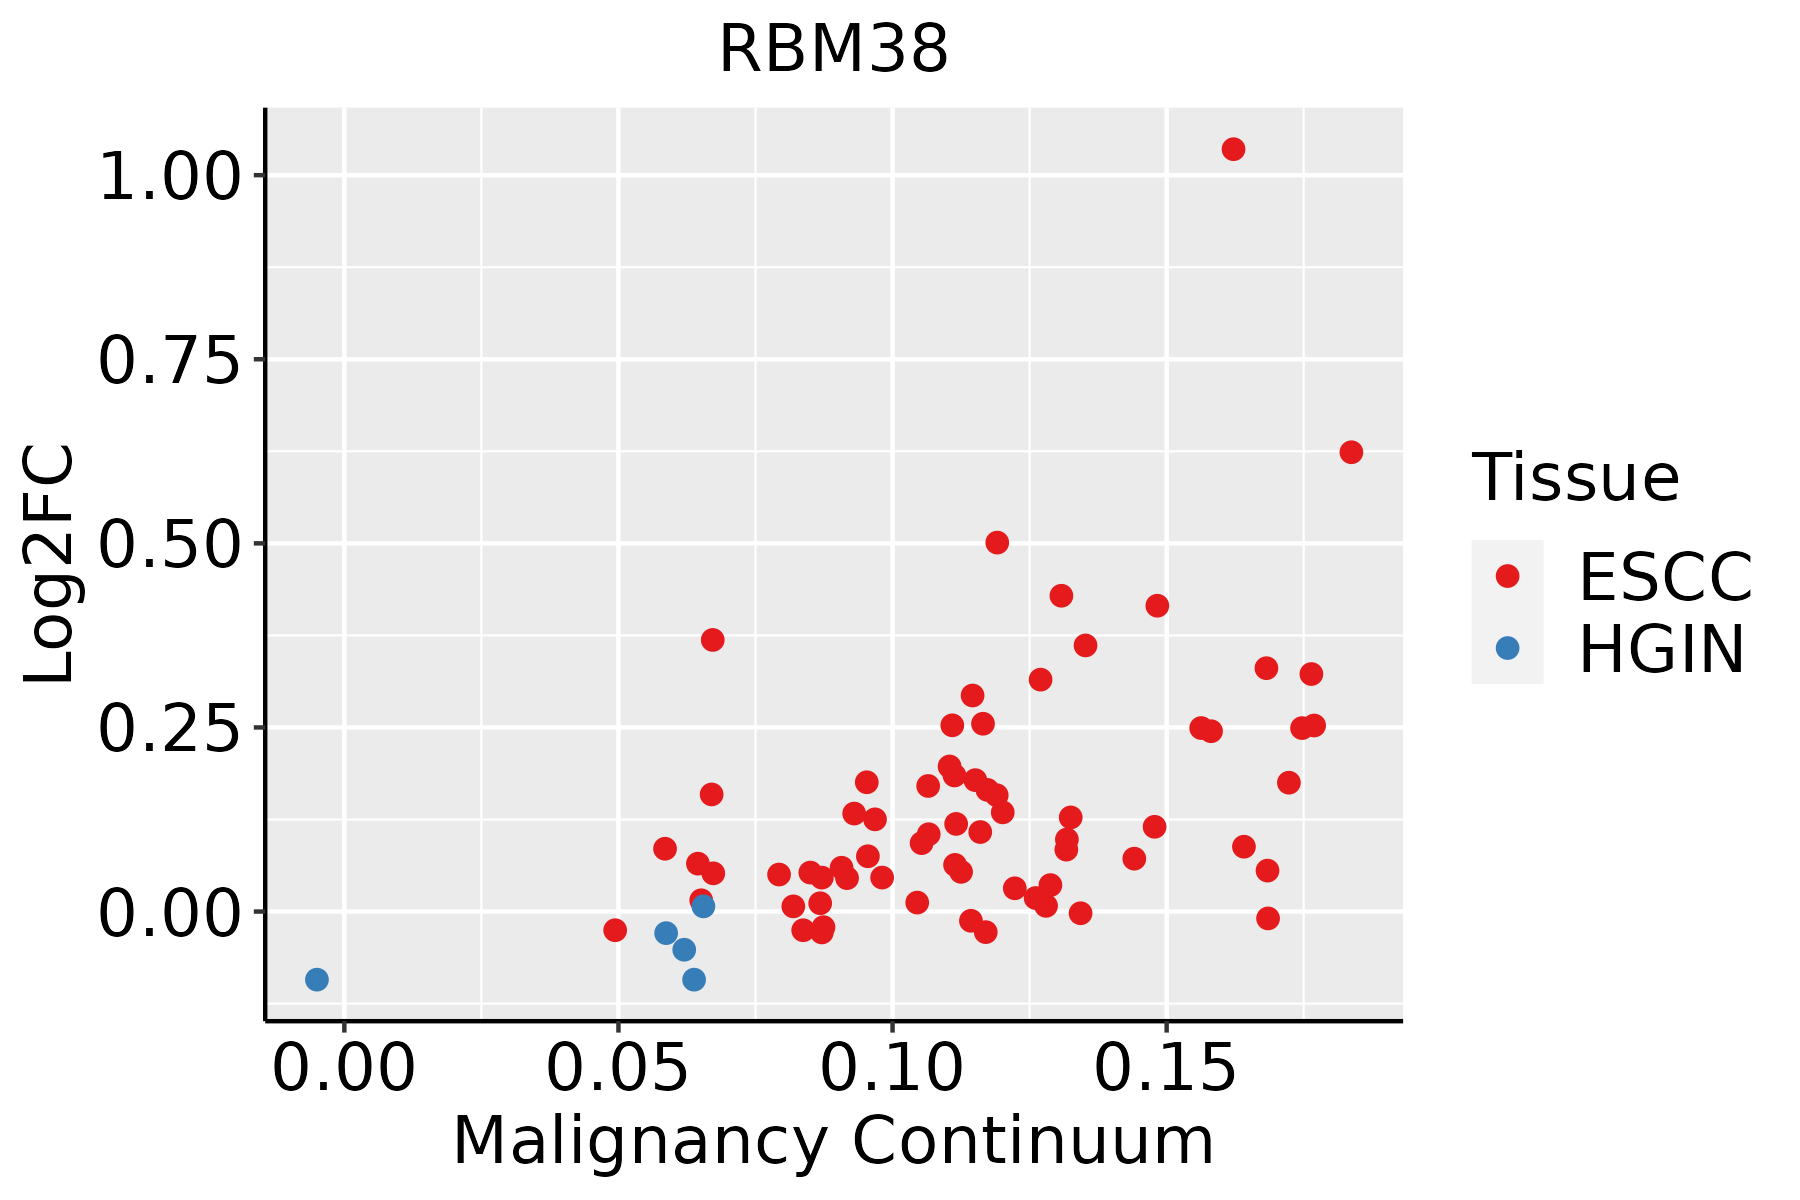 | ESCC: Esophageal squamous cell carcinoma |
| HGIN: High-grade intraepithelial neoplasias | ||
| LGIN: Low-grade intraepithelial neoplasias | ||
| Liver | 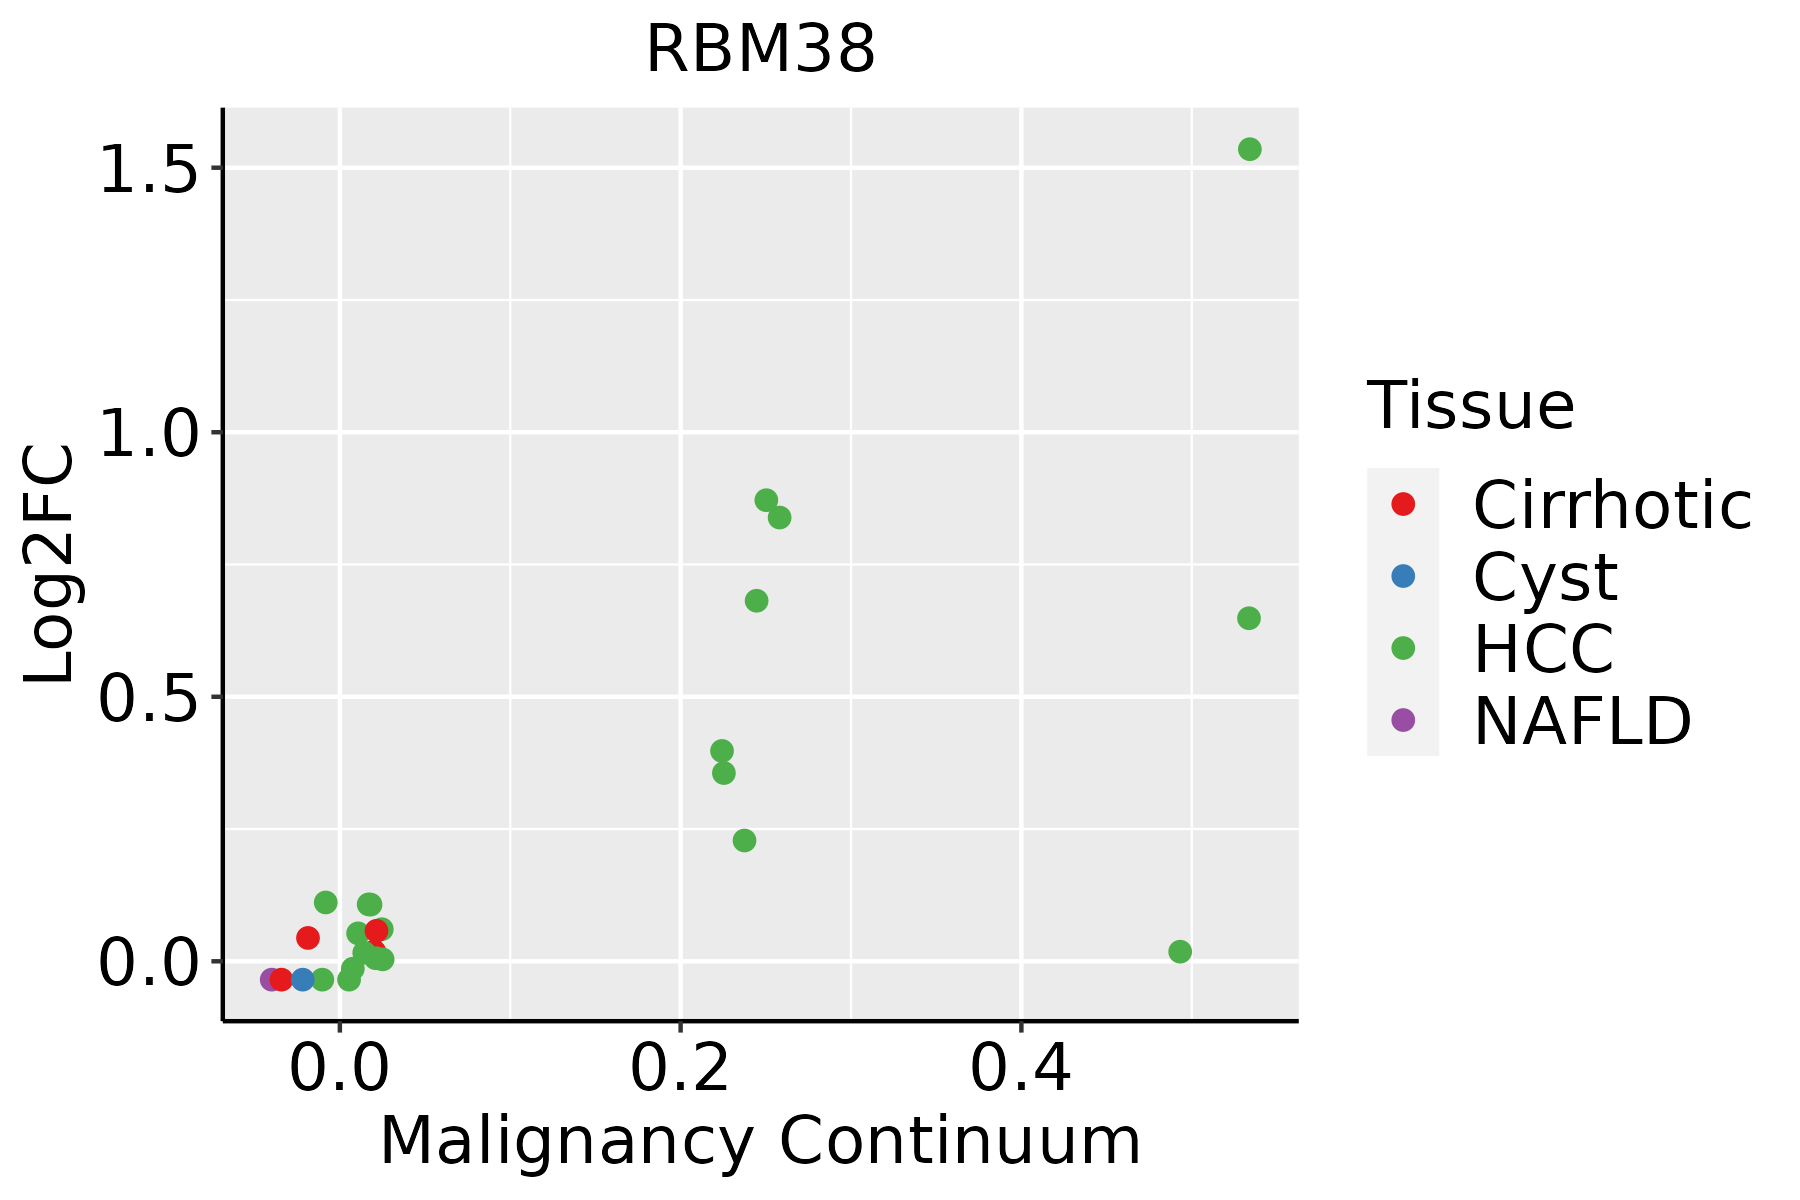 | HCC: Hepatocellular carcinoma |
| NAFLD: Non-alcoholic fatty liver disease | ||
| Oral Cavity | 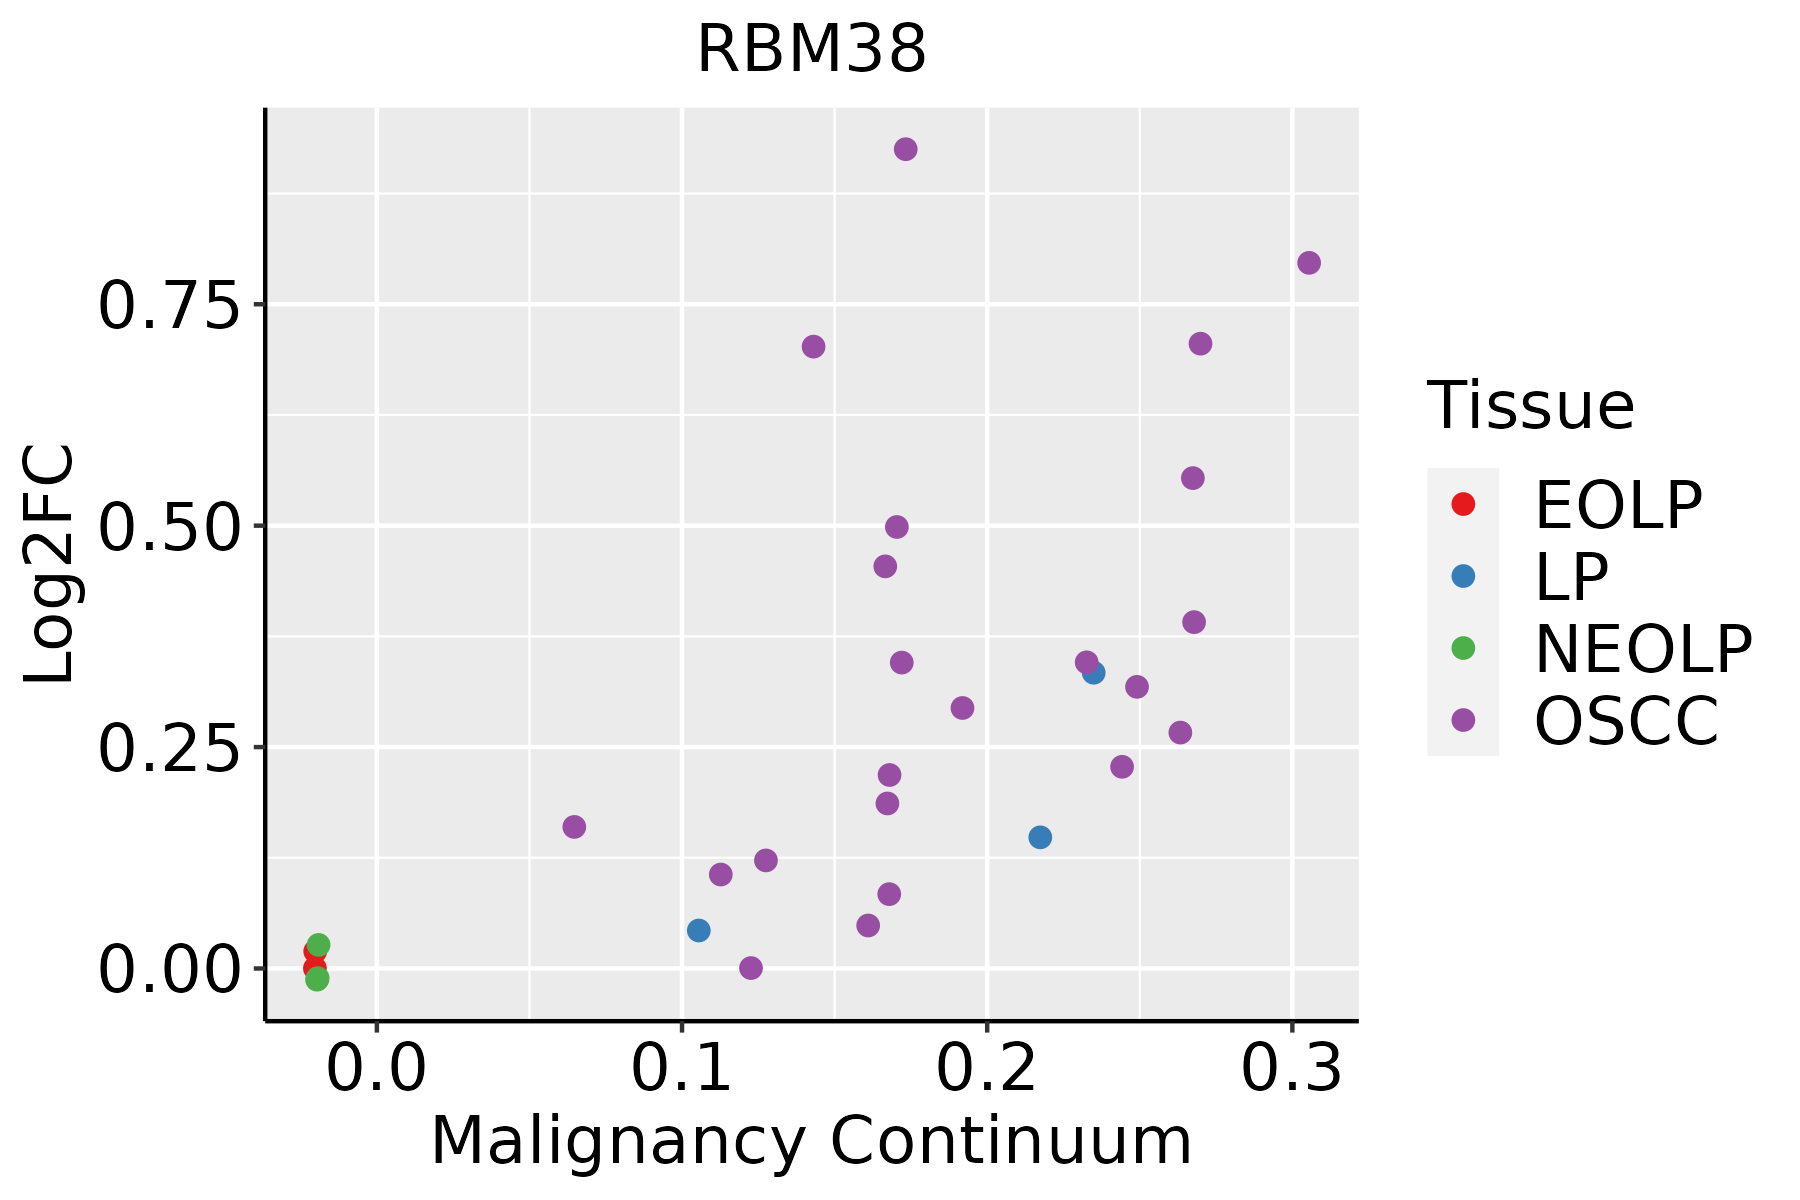 | EOLP: Erosive Oral lichen planus |
| LP: leukoplakia | ||
| NEOLP: Non-erosive oral lichen planus | ||
| OSCC: Oral squamous cell carcinoma |
| ∗log2FC in expression of this searched gene in stem-like cells from each diseased tissue sample relative to stem-like cells in normal samples in each tissue plotted against the malignancy continuum. Samples are colored based on if they are from different disease stage. |
Top |
Malignant transformation related pathway analysis |
| Find out the enriched GO biological processes and KEGG pathways involved in transition from healthy to precancer to cancer |
| Tissue | Disease Stage | Enriched GO biological Processes |
| Colorectum | AD |  |
| Colorectum | SER |  |
| Colorectum | MSS |  |
| Colorectum | MSI-H |  |
| Colorectum | FAP |  |
| ∗Top 15 enriched GO BP terms are showed in the bar plot of each disease state in each tissue. Each row represents a significant GO biological process which is colored according to the -log10(p.adjust). |
| Page: 1 2 3 4 5 6 7 8 9 |
| GO ID | Tissue | Disease Stage | Description | Gene Ratio | Bg Ratio | pvalue | p.adjust | Count |
| GO:0008380 | Colorectum | AD | RNA splicing | 169/3918 | 434/18723 | 3.59e-18 | 2.04e-15 | 169 |
| GO:0043484 | Colorectum | AD | regulation of RNA splicing | 70/3918 | 148/18723 | 6.47e-13 | 1.16e-10 | 70 |
| GO:00083801 | Colorectum | SER | RNA splicing | 123/2897 | 434/18723 | 3.84e-12 | 8.41e-10 | 123 |
| GO:00434841 | Colorectum | SER | regulation of RNA splicing | 49/2897 | 148/18723 | 7.02e-08 | 4.49e-06 | 49 |
| GO:00083802 | Colorectum | MSS | RNA splicing | 159/3467 | 434/18723 | 1.75e-19 | 1.22e-16 | 159 |
| GO:00434842 | Colorectum | MSS | regulation of RNA splicing | 66/3467 | 148/18723 | 2.44e-13 | 5.25e-11 | 66 |
| GO:00083803 | Colorectum | MSI-H | RNA splicing | 82/1319 | 434/18723 | 1.22e-16 | 4.53e-14 | 82 |
| GO:00434843 | Colorectum | MSI-H | regulation of RNA splicing | 34/1319 | 148/18723 | 5.85e-10 | 8.33e-08 | 34 |
| GO:0008380111 | Esophagus | ESCC | RNA splicing | 336/8552 | 434/18723 | 1.74e-42 | 3.67e-39 | 336 |
| GO:0043484111 | Esophagus | ESCC | regulation of RNA splicing | 116/8552 | 148/18723 | 3.18e-16 | 2.38e-14 | 116 |
| GO:000838022 | Liver | HCC | RNA splicing | 313/7958 | 434/18723 | 1.36e-36 | 1.73e-33 | 313 |
| GO:004348422 | Liver | HCC | regulation of RNA splicing | 113/7958 | 148/18723 | 4.32e-17 | 4.15e-15 | 113 |
| GO:000838020 | Oral cavity | OSCC | RNA splicing | 308/7305 | 434/18723 | 2.43e-42 | 7.70e-39 | 308 |
| GO:004348420 | Oral cavity | OSCC | regulation of RNA splicing | 108/7305 | 148/18723 | 4.25e-17 | 3.69e-15 | 108 |
| GO:00426927 | Oral cavity | OSCC | muscle cell differentiation | 175/7305 | 384/18723 | 4.79e-03 | 1.92e-02 | 175 |
| Page: 1 |
| Pathway ID | Tissue | Disease Stage | Description | Gene Ratio | Bg Ratio | pvalue | p.adjust | qvalue | Count |
| Page: 1 |
Top |
Cell-cell communication analysis |
| Identification of potential cell-cell interactions between two cell types and their ligand-receptor pairs for different disease states |
| Ligand | Receptor | LRpair | Pathway | Tissue | Disease Stage |
| Page: 1 |
Top |
Single-cell gene regulatory network inference analysis |
| Find out the significant the regulons (TFs) and the target genes of each regulon across cell types for different disease states |
| TF | Cell Type | Tissue | Disease Stage | Target Gene | RSS | Regulon Activity |
| ∗The dot plots of a searched regulon are shown for all cell subpopulations in each disease state of each tissue based on the regulon specific score inferred using pySCENIC and by calculating the average expression. |
| Page: 1 |
Top |
Somatic mutation of malignant transformation related genes |
| Annotation of somatic variants for genes involved in malignant transformation |
| Hugo Symbol | Variant Class | Variant Classification | dbSNP RS | HGVSc | HGVSp | HGVSp Short | SWISSPROT | BIOTYPE | SIFT | PolyPhen | Tumor Sample Barcode | Tissue | Histology | Sex | Age | Stage | Therapy Types | Drugs | Outcome |
| RBM38 | SNV | Missense_Mutation | c.163N>C | p.Glu55Gln | p.E55Q | Q9H0Z9 | protein_coding | tolerated(0.12) | benign(0.404) | TCGA-5L-AAT1-01 | Breast | breast invasive carcinoma | Female | <65 | III/IV | Hormone Therapy | letrozol | SD | |
| RBM38 | SNV | Missense_Mutation | novel | c.689N>T | p.Ala230Val | p.A230V | Q9H0Z9 | protein_coding | deleterious_low_confidence(0) | benign(0.163) | TCGA-2W-A8YY-01 | Cervix | cervical & endocervical cancer | Female | <65 | I/II | Chemotherapy | cisplatin | CR |
| RBM38 | SNV | Missense_Mutation | rs766651552 | c.478N>A | p.Ala160Thr | p.A160T | Q9H0Z9 | protein_coding | tolerated(0.62) | benign(0) | TCGA-CA-6717-01 | Colorectum | colon adenocarcinoma | Male | <65 | I/II | Chemotherapy | oxaliplatin | CR |
| RBM38 | SNV | Missense_Mutation | rs766487046 | c.521N>T | p.Pro174Leu | p.P174L | Q9H0Z9 | protein_coding | tolerated(0.06) | benign(0.028) | TCGA-CM-4752-01 | Colorectum | colon adenocarcinoma | Male | <65 | I/II | Unknown | Unknown | SD |
| RBM38 | SNV | Missense_Mutation | c.325N>A | p.Ala109Thr | p.A109T | Q9H0Z9 | protein_coding | deleterious(0) | possibly_damaging(0.907) | TCGA-D5-6930-01 | Colorectum | colon adenocarcinoma | Male | >=65 | I/II | Unknown | Unknown | SD | |
| RBM38 | SNV | Missense_Mutation | rs754322312 | c.551N>A | p.Pro184Gln | p.P184Q | Q9H0Z9 | protein_coding | tolerated(0.16) | benign(0.007) | TCGA-F4-6703-01 | Colorectum | colon adenocarcinoma | Male | <65 | I/II | Unknown | Unknown | SD |
| RBM38 | SNV | Missense_Mutation | novel | c.301N>A | p.Gly101Ser | p.G101S | Q9H0Z9 | protein_coding | deleterious(0) | probably_damaging(0.999) | TCGA-DC-4745-01 | Colorectum | rectum adenocarcinoma | Female | <65 | III/IV | Chemotherapy | 5-fluorouracil | SD |
| RBM38 | SNV | Missense_Mutation | novel | c.274T>C | p.Cys92Arg | p.C92R | Q9H0Z9 | protein_coding | deleterious(0) | probably_damaging(0.979) | TCGA-DI-A1BU-01 | Endometrium | uterine corpus endometrioid carcinoma | Female | <65 | I/II | Chemotherapy | paclitaxel | SD |
| RBM38 | SNV | Missense_Mutation | novel | c.707A>T | p.Asp236Val | p.D236V | Q9H0Z9 | protein_coding | deleterious_low_confidence(0) | possibly_damaging(0.865) | TCGA-FI-A2D0-01 | Endometrium | uterine corpus endometrioid carcinoma | Female | <65 | I/II | Unknown | Unknown | SD |
| RBM38 | SNV | Missense_Mutation | novel | c.52C>A | p.Leu18Met | p.L18M | Q9H0Z9 | protein_coding | tolerated_low_confidence(0.25) | benign(0) | TCGA-FI-A2D5-01 | Endometrium | uterine corpus endometrioid carcinoma | Female | <65 | III/IV | Chemotherapy | carboplatinum | PD |
| Page: 1 2 |
Top |
Related drugs of malignant transformation related genes |
| Identification of chemicals and drugs interact with genes involved in malignant transfromation |
| (DGIdb 4.0) |
| Entrez ID | Symbol | Category | Interaction Types | Drug Claim Name | Drug Name | PMIDs |
| Page: 1 |

Copyright 2023-Present -The University of Texas Health Science Center at Houston |