
|
|||||
|
 | |
| |
| |
| |
| |
| |
|
Gene: RBM28 |
Gene summary for RBM28 |
| Gene information | Species | Human | Gene symbol | RBM28 | Gene ID | 55131 |
| Gene name | RNA binding motif protein 28 | |
| Gene Alias | ANES | |
| Cytomap | 7q32.1 | |
| Gene Type | protein-coding | GO ID | GO:0006139 | UniProtAcc | Q9NW13 |
Top |
Malignant transformation analysis |
| Identification of the aberrant gene expression in precancerous and cancerous lesions by comparing the gene expression of stem-like cells in diseased tissues with normal stem cells |
| Entrez ID | Symbol | Replicates | Species | Organ | Tissue | Adj P-value | Log2FC | Malignancy |
| 55131 | RBM28 | SYSMH2 | Human | Oral cavity | OSCC | 1.54e-15 | 4.77e-01 | 0.2326 |
| 55131 | RBM28 | SYSMH3 | Human | Oral cavity | OSCC | 7.63e-31 | 6.95e-01 | 0.2442 |
| 55131 | RBM28 | SYSMH5 | Human | Oral cavity | OSCC | 1.61e-06 | 2.64e-01 | 0.0647 |
| 55131 | RBM28 | P4_S8_cSCC | Human | Skin | cSCC | 4.61e-08 | 2.36e-01 | -0.3095 |
| 55131 | RBM28 | P1_cSCC | Human | Skin | cSCC | 2.93e-04 | 3.60e-01 | 0.0292 |
| 55131 | RBM28 | P2_cSCC | Human | Skin | cSCC | 2.65e-06 | 3.73e-01 | -0.024 |
| 55131 | RBM28 | P4_cSCC | Human | Skin | cSCC | 1.15e-09 | 4.29e-01 | -0.00290000000000005 |
| 55131 | RBM28 | P10_cSCC | Human | Skin | cSCC | 2.15e-16 | 6.21e-01 | 0.1017 |
| 55131 | RBM28 | male-WTA | Human | Thyroid | PTC | 5.66e-16 | 1.29e-01 | 0.1037 |
| 55131 | RBM28 | PTC01 | Human | Thyroid | PTC | 3.82e-14 | 9.79e-02 | 0.1899 |
| 55131 | RBM28 | PTC03 | Human | Thyroid | PTC | 4.76e-07 | 1.67e-01 | 0.1784 |
| 55131 | RBM28 | PTC04 | Human | Thyroid | PTC | 3.51e-14 | 1.78e-01 | 0.1927 |
| 55131 | RBM28 | PTC05 | Human | Thyroid | PTC | 3.90e-11 | 3.05e-01 | 0.2065 |
| 55131 | RBM28 | PTC06 | Human | Thyroid | PTC | 9.21e-26 | 6.42e-01 | 0.2057 |
| 55131 | RBM28 | PTC07 | Human | Thyroid | PTC | 3.42e-24 | 4.18e-01 | 0.2044 |
| 55131 | RBM28 | ATC09 | Human | Thyroid | ATC | 6.70e-07 | 2.58e-01 | 0.2871 |
| 55131 | RBM28 | ATC11 | Human | Thyroid | ATC | 5.62e-04 | 4.23e-01 | 0.3386 |
| 55131 | RBM28 | ATC12 | Human | Thyroid | ATC | 1.04e-24 | 5.45e-01 | 0.34 |
| 55131 | RBM28 | ATC13 | Human | Thyroid | ATC | 3.40e-34 | 6.60e-01 | 0.34 |
| 55131 | RBM28 | ATC1 | Human | Thyroid | ATC | 5.68e-08 | 3.06e-01 | 0.2878 |
| Page: 1 2 3 4 5 6 |
| Tissue | Expression Dynamics | Abbreviation |
| Esophagus | 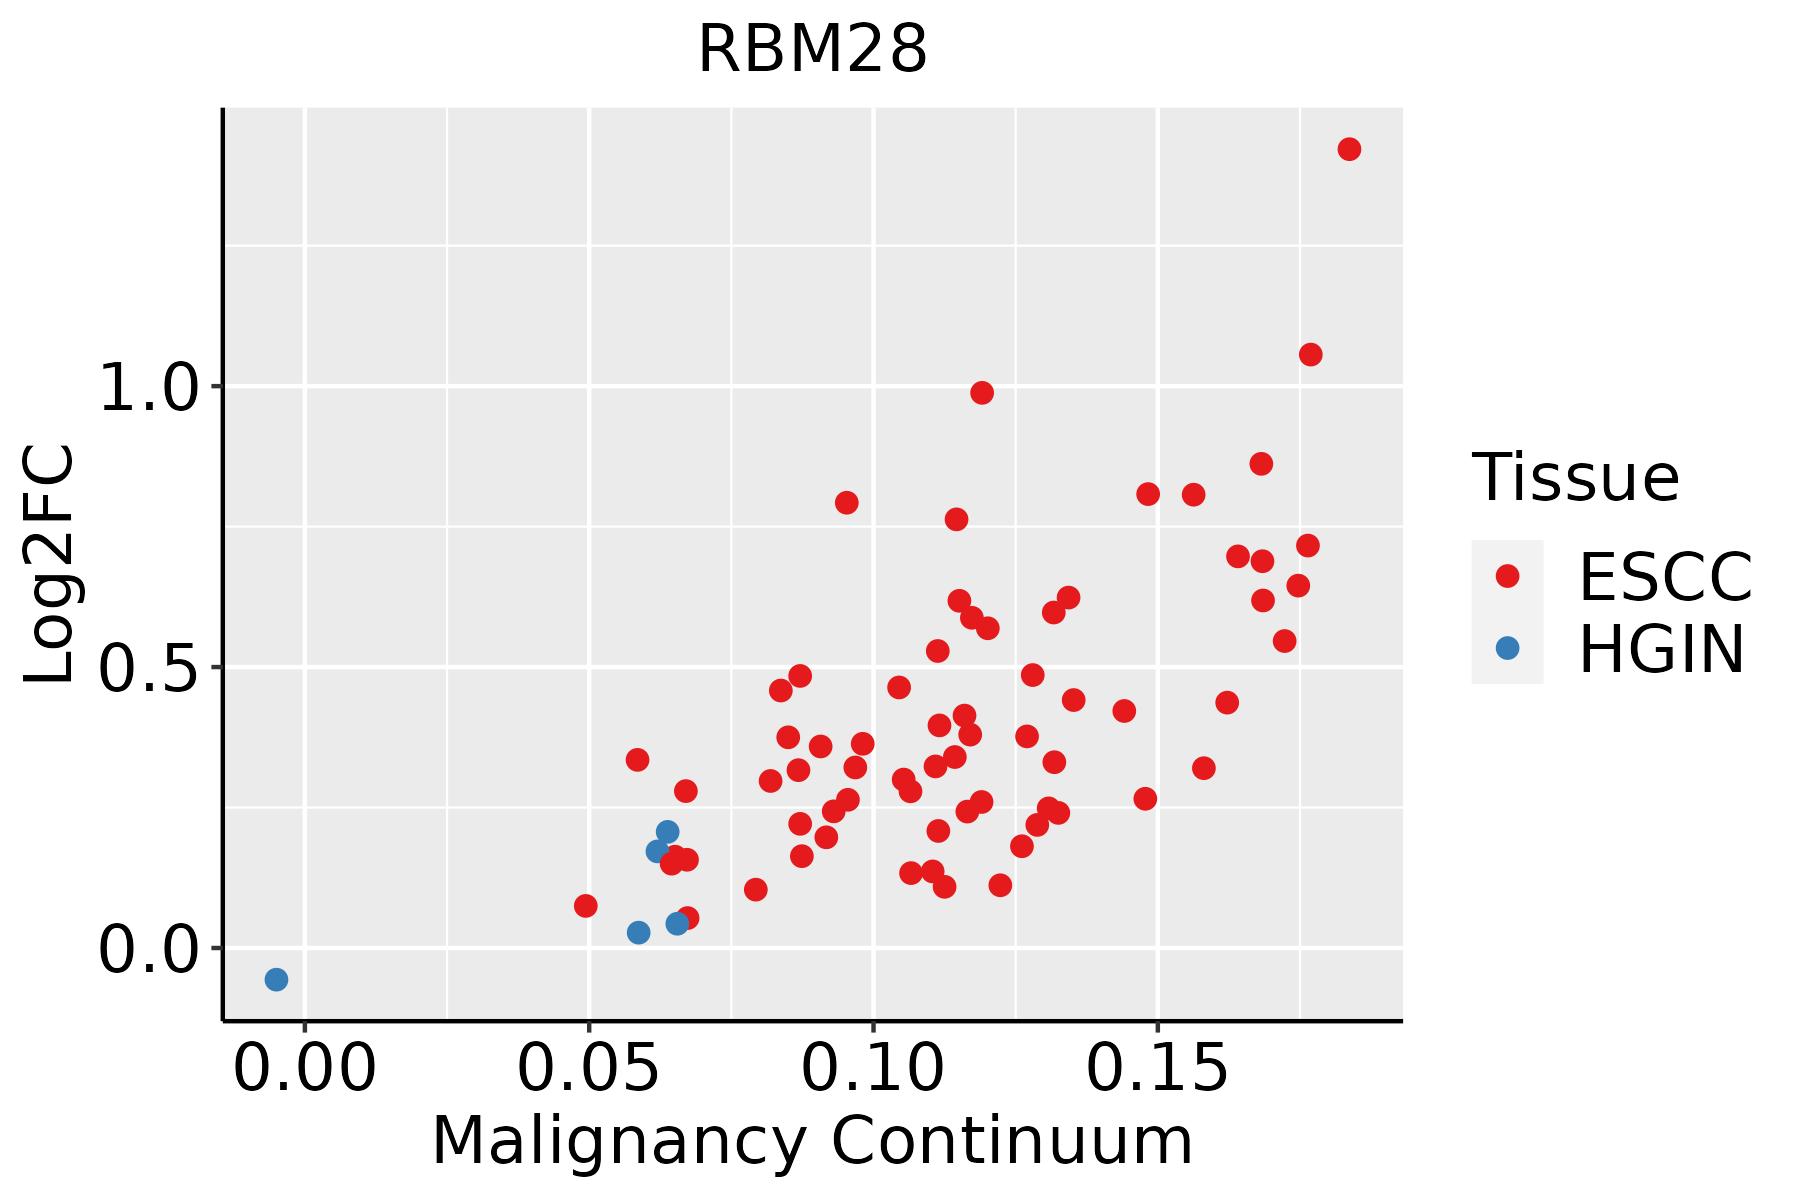 | ESCC: Esophageal squamous cell carcinoma |
| HGIN: High-grade intraepithelial neoplasias | ||
| LGIN: Low-grade intraepithelial neoplasias | ||
| Liver | 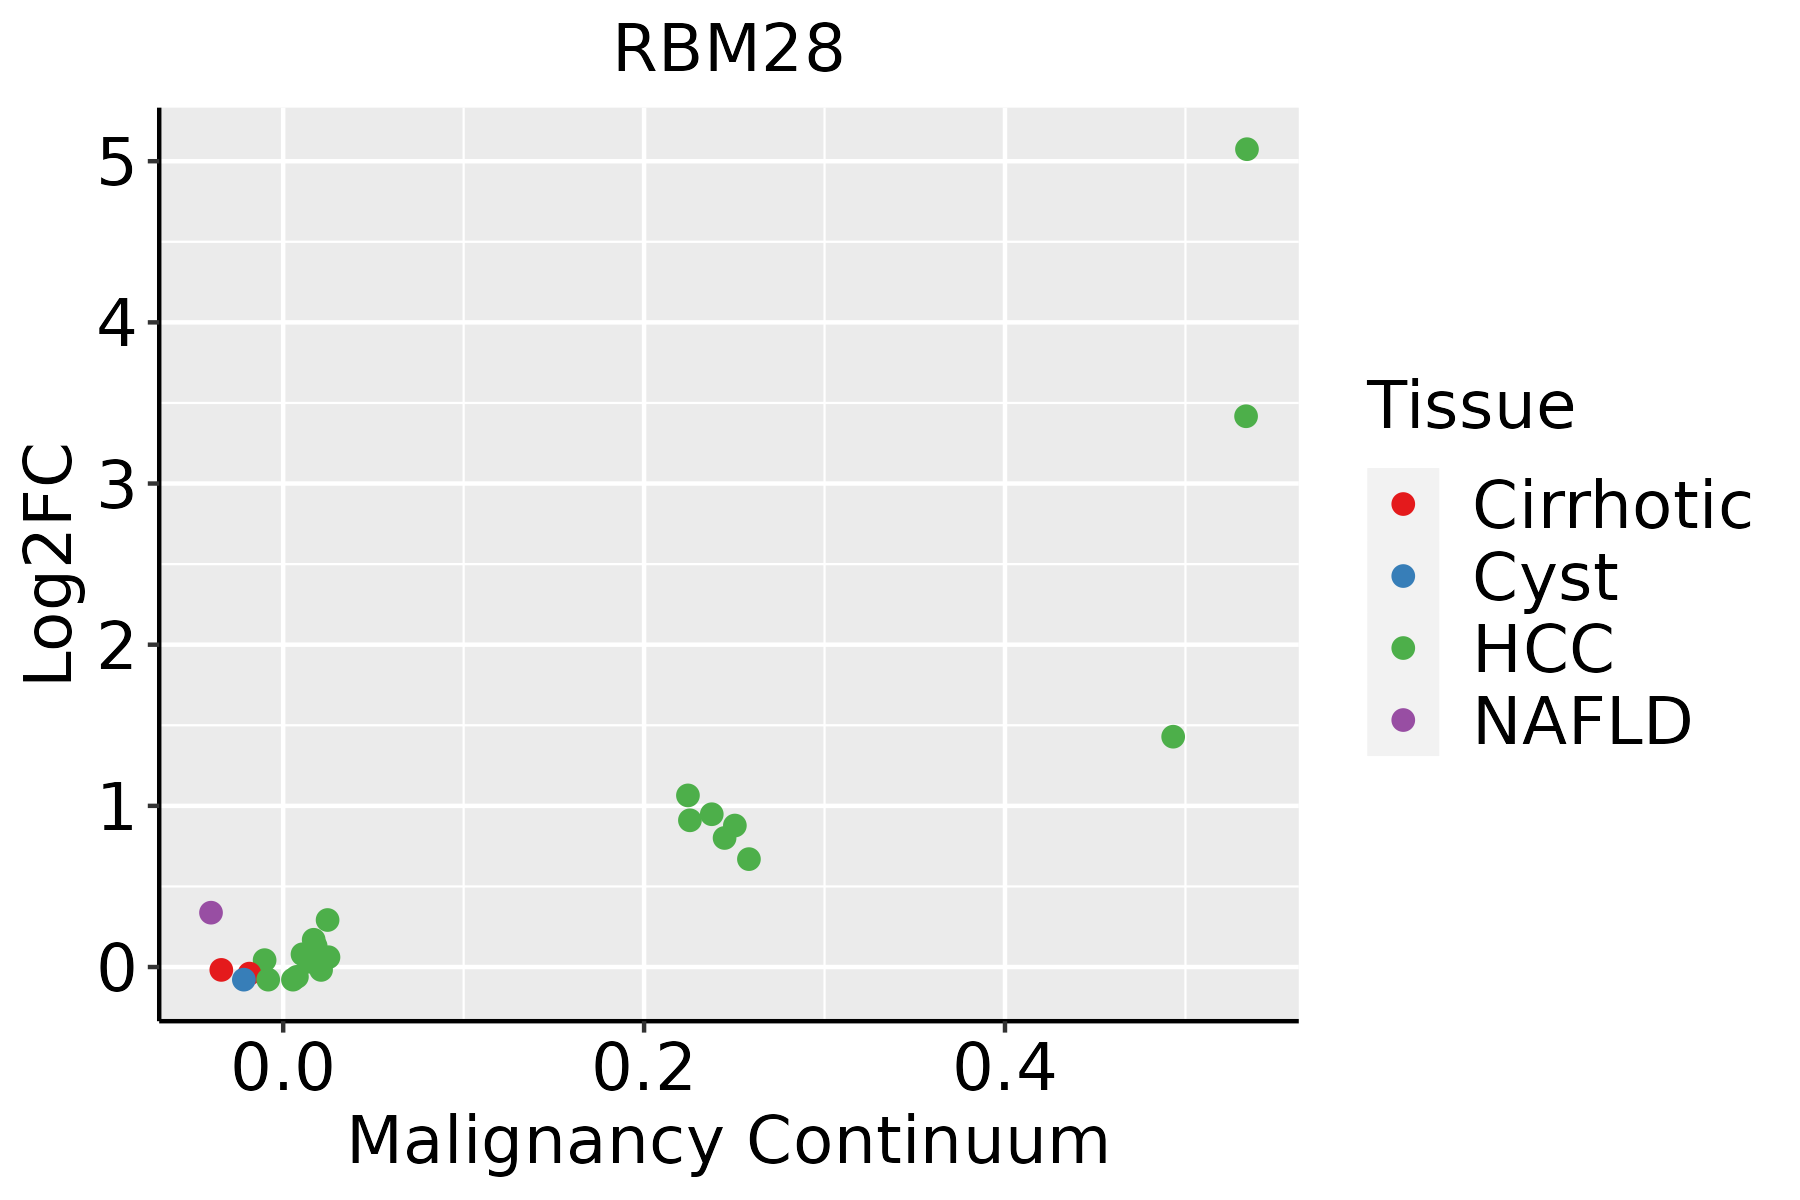 | HCC: Hepatocellular carcinoma |
| NAFLD: Non-alcoholic fatty liver disease | ||
| Oral Cavity | 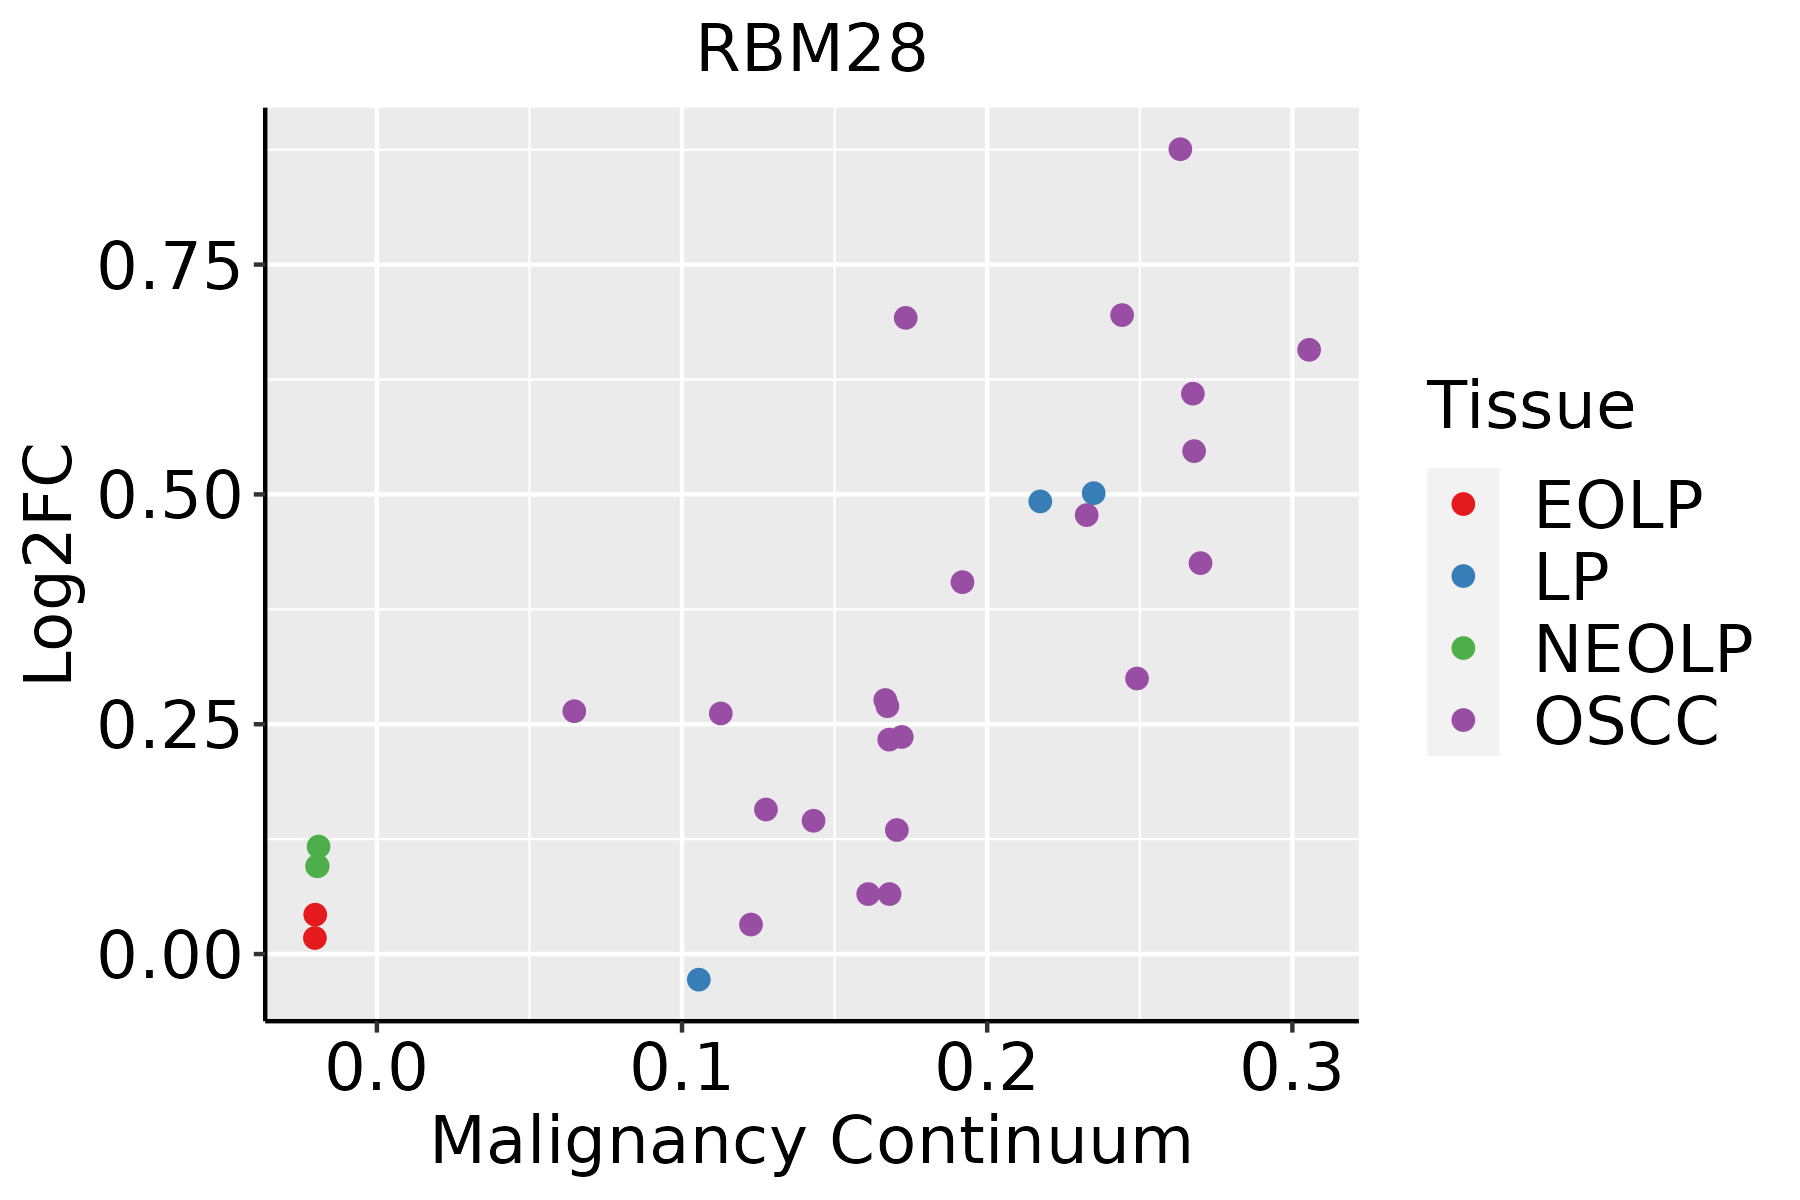 | EOLP: Erosive Oral lichen planus |
| LP: leukoplakia | ||
| NEOLP: Non-erosive oral lichen planus | ||
| OSCC: Oral squamous cell carcinoma | ||
| Skin |  | AK: Actinic keratosis |
| cSCC: Cutaneous squamous cell carcinoma | ||
| SCCIS:squamous cell carcinoma in situ | ||
| Thyroid |  | ATC: Anaplastic thyroid cancer |
| HT: Hashimoto's thyroiditis | ||
| PTC: Papillary thyroid cancer |
| ∗log2FC in expression of this searched gene in stem-like cells from each diseased tissue sample relative to stem-like cells in normal samples in each tissue plotted against the malignancy continuum. Samples are colored based on if they are from different disease stage. |
Top |
Malignant transformation related pathway analysis |
| Find out the enriched GO biological processes and KEGG pathways involved in transition from healthy to precancer to cancer |
| Tissue | Disease Stage | Enriched GO biological Processes |
| Colorectum | AD |  |
| Colorectum | SER |  |
| Colorectum | MSS |  |
| Colorectum | MSI-H |  |
| Colorectum | FAP |  |
| ∗Top 15 enriched GO BP terms are showed in the bar plot of each disease state in each tissue. Each row represents a significant GO biological process which is colored according to the -log10(p.adjust). |
| Page: 1 2 3 4 5 6 7 8 9 |
| GO ID | Tissue | Disease Stage | Description | Gene Ratio | Bg Ratio | pvalue | p.adjust | Count |
| GO:0008380111 | Esophagus | ESCC | RNA splicing | 336/8552 | 434/18723 | 1.74e-42 | 3.67e-39 | 336 |
| GO:000838022 | Liver | HCC | RNA splicing | 313/7958 | 434/18723 | 1.36e-36 | 1.73e-33 | 313 |
| GO:000838020 | Oral cavity | OSCC | RNA splicing | 308/7305 | 434/18723 | 2.43e-42 | 7.70e-39 | 308 |
| GO:0008380112 | Skin | cSCC | RNA splicing | 263/4864 | 434/18723 | 2.45e-53 | 5.13e-50 | 263 |
| GO:0008380113 | Thyroid | PTC | RNA splicing | 273/5968 | 434/18723 | 4.44e-41 | 1.40e-37 | 273 |
| GO:000838034 | Thyroid | ATC | RNA splicing | 270/6293 | 434/18723 | 7.50e-35 | 1.19e-31 | 270 |
| Page: 1 |
| Pathway ID | Tissue | Disease Stage | Description | Gene Ratio | Bg Ratio | pvalue | p.adjust | qvalue | Count |
| Page: 1 |
Top |
Cell-cell communication analysis |
| Identification of potential cell-cell interactions between two cell types and their ligand-receptor pairs for different disease states |
| Ligand | Receptor | LRpair | Pathway | Tissue | Disease Stage |
| Page: 1 |
Top |
Single-cell gene regulatory network inference analysis |
| Find out the significant the regulons (TFs) and the target genes of each regulon across cell types for different disease states |
| TF | Cell Type | Tissue | Disease Stage | Target Gene | RSS | Regulon Activity |
| ∗The dot plots of a searched regulon are shown for all cell subpopulations in each disease state of each tissue based on the regulon specific score inferred using pySCENIC and by calculating the average expression. |
| Page: 1 |
Top |
Somatic mutation of malignant transformation related genes |
| Annotation of somatic variants for genes involved in malignant transformation |
| Hugo Symbol | Variant Class | Variant Classification | dbSNP RS | HGVSc | HGVSp | HGVSp Short | SWISSPROT | BIOTYPE | SIFT | PolyPhen | Tumor Sample Barcode | Tissue | Histology | Sex | Age | Stage | Therapy Types | Drugs | Outcome |
| RBM28 | SNV | Missense_Mutation | c.41N>G | p.Ser14Trp | p.S14W | Q9NW13 | protein_coding | deleterious(0) | probably_damaging(0.997) | TCGA-A8-A094-01 | Breast | breast invasive carcinoma | Female | >=65 | I/II | Unknown | Unknown | SD | |
| RBM28 | SNV | Missense_Mutation | novel | c.2236N>G | p.Lys746Glu | p.K746E | Q9NW13 | protein_coding | tolerated(0.1) | benign(0.138) | TCGA-AC-A3W6-01 | Breast | breast invasive carcinoma | Female | >=65 | III/IV | Unknown | Unknown | SD |
| RBM28 | SNV | Missense_Mutation | c.754G>A | p.Glu252Lys | p.E252K | Q9NW13 | protein_coding | tolerated(0.21) | benign(0.018) | TCGA-D8-A1J8-01 | Breast | breast invasive carcinoma | Female | >=65 | I/II | Hormone Therapy | nolvadex | SD | |
| RBM28 | SNV | Missense_Mutation | c.776N>T | p.Ser259Leu | p.S259L | Q9NW13 | protein_coding | tolerated(0.1) | benign(0.001) | TCGA-D8-A27G-01 | Breast | breast invasive carcinoma | Female | >=65 | I/II | Unknown | Unknown | SD | |
| RBM28 | SNV | Missense_Mutation | rs145208220 | c.1355C>T | p.Thr452Met | p.T452M | Q9NW13 | protein_coding | deleterious(0) | probably_damaging(0.996) | TCGA-E9-A1RI-01 | Breast | breast invasive carcinoma | Female | <65 | III/IV | Hormone Therapy | tamoxiphen | SD |
| RBM28 | SNV | Missense_Mutation | novel | c.2252N>A | p.Ala751Glu | p.A751E | Q9NW13 | protein_coding | tolerated(0.8) | benign(0) | TCGA-UU-A93S-01 | Breast | breast invasive carcinoma | Female | <65 | III/IV | Unknown | Unknown | PD |
| RBM28 | insertion | Frame_Shift_Ins | novel | c.1346_1347insC | p.Ala450CysfsTer13 | p.A450Cfs*13 | Q9NW13 | protein_coding | TCGA-A8-A09X-01 | Breast | breast invasive carcinoma | Female | <65 | III/IV | Unknown | Unknown | SD | ||
| RBM28 | insertion | Nonsense_Mutation | novel | c.1345_1346insTCTTGCCTCAGCCTCCTGAGTAGCTGGGACTACAGGT | p.Arg449LeufsTer8 | p.R449Lfs*8 | Q9NW13 | protein_coding | TCGA-A8-A09X-01 | Breast | breast invasive carcinoma | Female | <65 | III/IV | Unknown | Unknown | SD | ||
| RBM28 | insertion | Frame_Shift_Ins | novel | c.1688_1689insCCTCCACCTTCTGGGTTCAAGTGATTCTCTTGCC | p.Pro564LeufsTer34 | p.P564Lfs*34 | Q9NW13 | protein_coding | TCGA-BH-A0EB-01 | Breast | breast invasive carcinoma | Female | >=65 | I/II | Hormone Therapy | arimidex | SD | ||
| RBM28 | SNV | Missense_Mutation | novel | c.650C>T | p.Ser217Leu | p.S217L | Q9NW13 | protein_coding | tolerated(0.67) | benign(0) | TCGA-Q1-A73O-01 | Cervix | cervical & endocervical cancer | Female | <65 | I/II | Chemotherapy | cisplatin | CR |
| Page: 1 2 3 4 5 6 7 8 |
Top |
Related drugs of malignant transformation related genes |
| Identification of chemicals and drugs interact with genes involved in malignant transfromation |
| (DGIdb 4.0) |
| Entrez ID | Symbol | Category | Interaction Types | Drug Claim Name | Drug Name | PMIDs |
| Page: 1 |

Copyright 2023-Present -The University of Texas Health Science Center at Houston |