
|
|||||
|
 | |
| |
| |
| |
| |
| |
|
Gene: RAB4A |
Gene summary for RAB4A |
| Gene information | Species | Human | Gene symbol | RAB4A | Gene ID | 5867 |
| Gene name | RAB4A, member RAS oncogene family | |
| Gene Alias | HRES-1 | |
| Cytomap | 1q42.13 | |
| Gene Type | protein-coding | GO ID | GO:0002376 | UniProtAcc | A0A087WYT5 |
Top |
Malignant transformation analysis |
| Identification of the aberrant gene expression in precancerous and cancerous lesions by comparing the gene expression of stem-like cells in diseased tissues with normal stem cells |
| Entrez ID | Symbol | Replicates | Species | Organ | Tissue | Adj P-value | Log2FC | Malignancy |
| 5867 | RAB4A | cirrhotic3 | Human | Liver | Cirrhotic | 4.66e-08 | 1.40e-01 | 0.0215 |
| 5867 | RAB4A | HCC1 | Human | Liver | HCC | 1.26e-04 | 4.04e+00 | 0.5336 |
| 5867 | RAB4A | HCC2 | Human | Liver | HCC | 1.25e-06 | 2.65e+00 | 0.5341 |
| 5867 | RAB4A | Pt13.b | Human | Liver | HCC | 5.20e-15 | 1.69e-01 | 0.0251 |
| 5867 | RAB4A | Pt14.b | Human | Liver | HCC | 2.62e-03 | 2.82e-01 | 0.018 |
| 5867 | RAB4A | S014 | Human | Liver | HCC | 4.28e-32 | 1.37e+00 | 0.2254 |
| 5867 | RAB4A | S015 | Human | Liver | HCC | 3.09e-21 | 1.25e+00 | 0.2375 |
| 5867 | RAB4A | S016 | Human | Liver | HCC | 2.52e-27 | 1.29e+00 | 0.2243 |
| 5867 | RAB4A | S027 | Human | Liver | HCC | 2.52e-10 | 1.19e+00 | 0.2446 |
| 5867 | RAB4A | S028 | Human | Liver | HCC | 5.75e-19 | 1.38e+00 | 0.2503 |
| 5867 | RAB4A | S029 | Human | Liver | HCC | 2.30e-18 | 1.53e+00 | 0.2581 |
| 5867 | RAB4A | C04 | Human | Oral cavity | OSCC | 1.62e-33 | 2.24e+00 | 0.2633 |
| 5867 | RAB4A | C21 | Human | Oral cavity | OSCC | 1.81e-54 | 2.09e+00 | 0.2678 |
| 5867 | RAB4A | C30 | Human | Oral cavity | OSCC | 1.18e-40 | 2.37e+00 | 0.3055 |
| 5867 | RAB4A | C38 | Human | Oral cavity | OSCC | 5.61e-08 | 1.43e+00 | 0.172 |
| 5867 | RAB4A | C43 | Human | Oral cavity | OSCC | 3.40e-67 | 1.44e+00 | 0.1704 |
| 5867 | RAB4A | C46 | Human | Oral cavity | OSCC | 2.34e-39 | 1.09e+00 | 0.1673 |
| 5867 | RAB4A | C51 | Human | Oral cavity | OSCC | 1.35e-15 | 1.20e+00 | 0.2674 |
| 5867 | RAB4A | C57 | Human | Oral cavity | OSCC | 6.09e-09 | 7.30e-01 | 0.1679 |
| 5867 | RAB4A | C06 | Human | Oral cavity | OSCC | 2.28e-13 | 2.24e+00 | 0.2699 |
| Page: 1 2 3 4 5 6 7 8 |
| Tissue | Expression Dynamics | Abbreviation |
| Colorectum (GSE201348) |  | FAP: Familial adenomatous polyposis |
| CRC: Colorectal cancer | ||
| Colorectum (HTA11) | 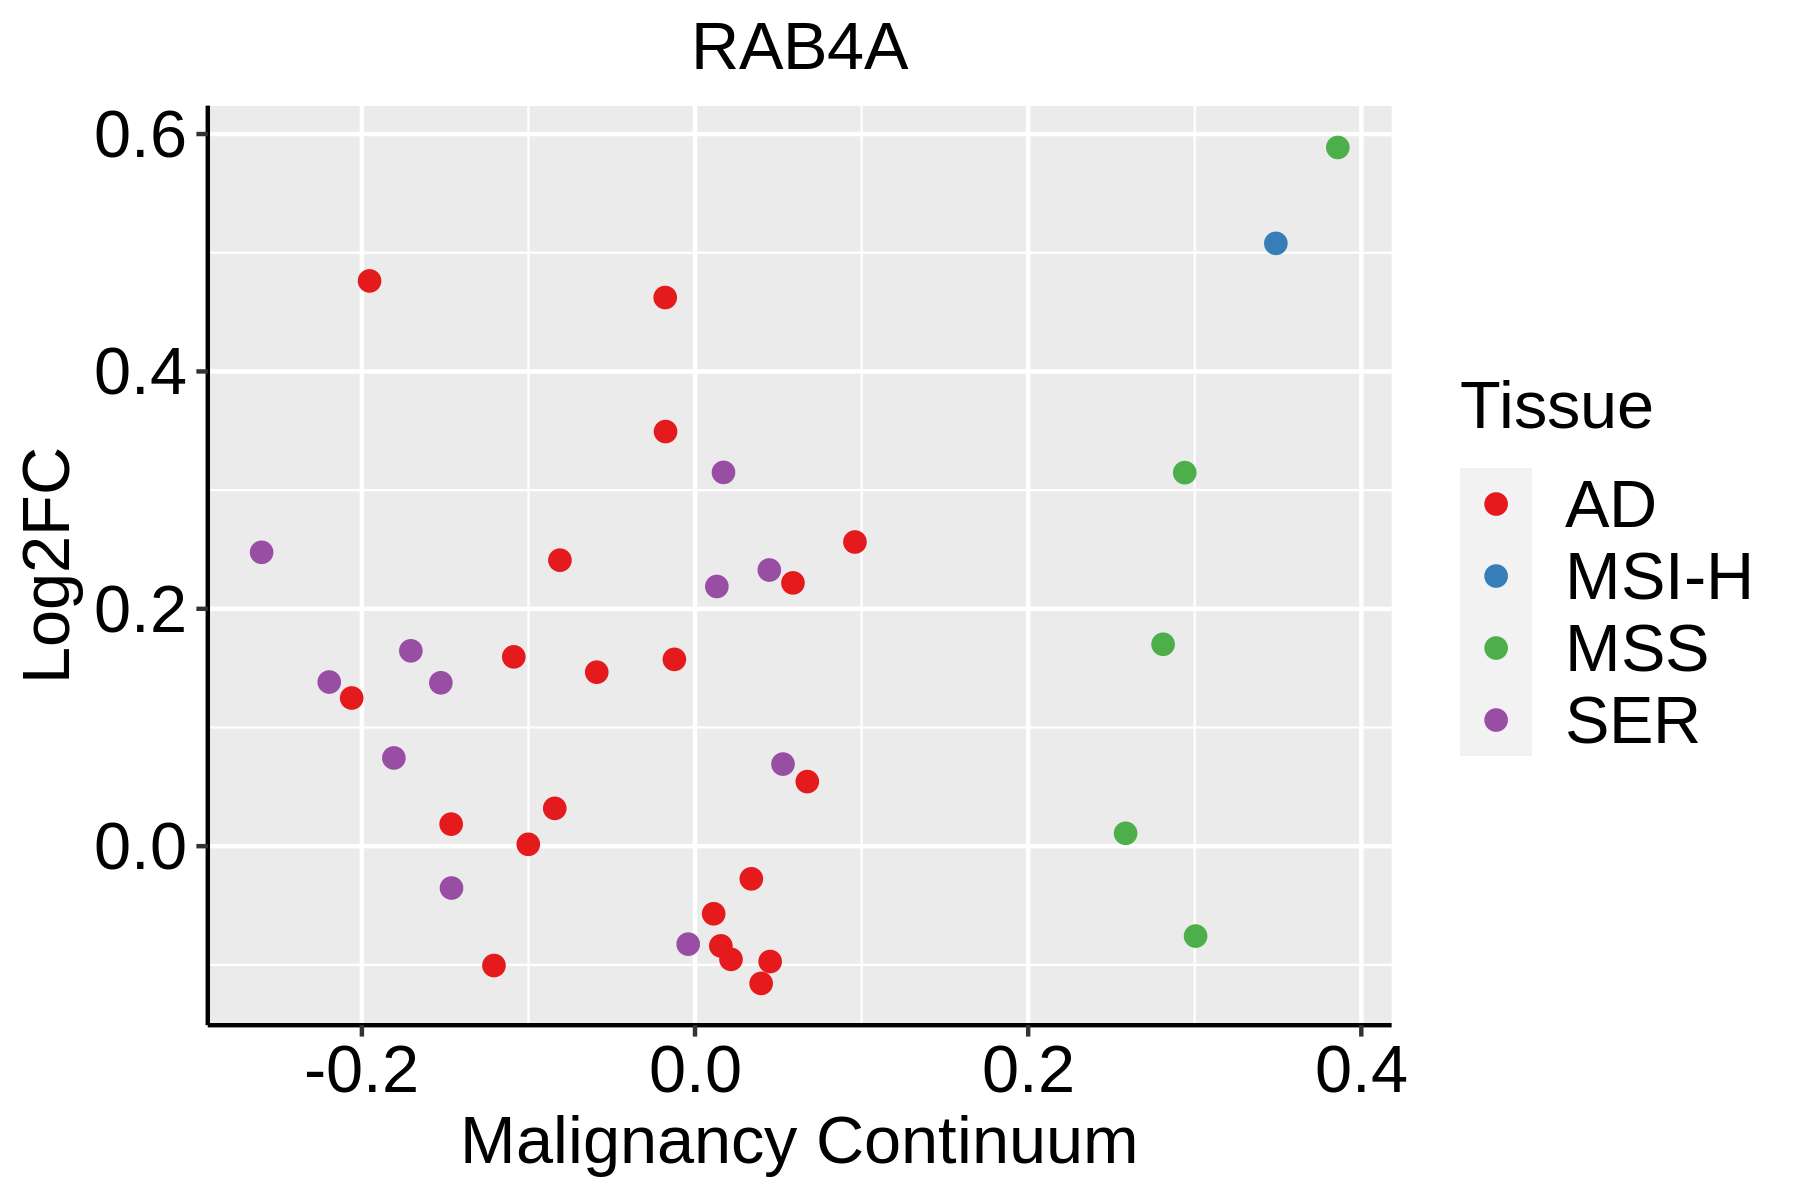 | AD: Adenomas |
| SER: Sessile serrated lesions | ||
| MSI-H: Microsatellite-high colorectal cancer | ||
| MSS: Microsatellite stable colorectal cancer | ||
| Esophagus | 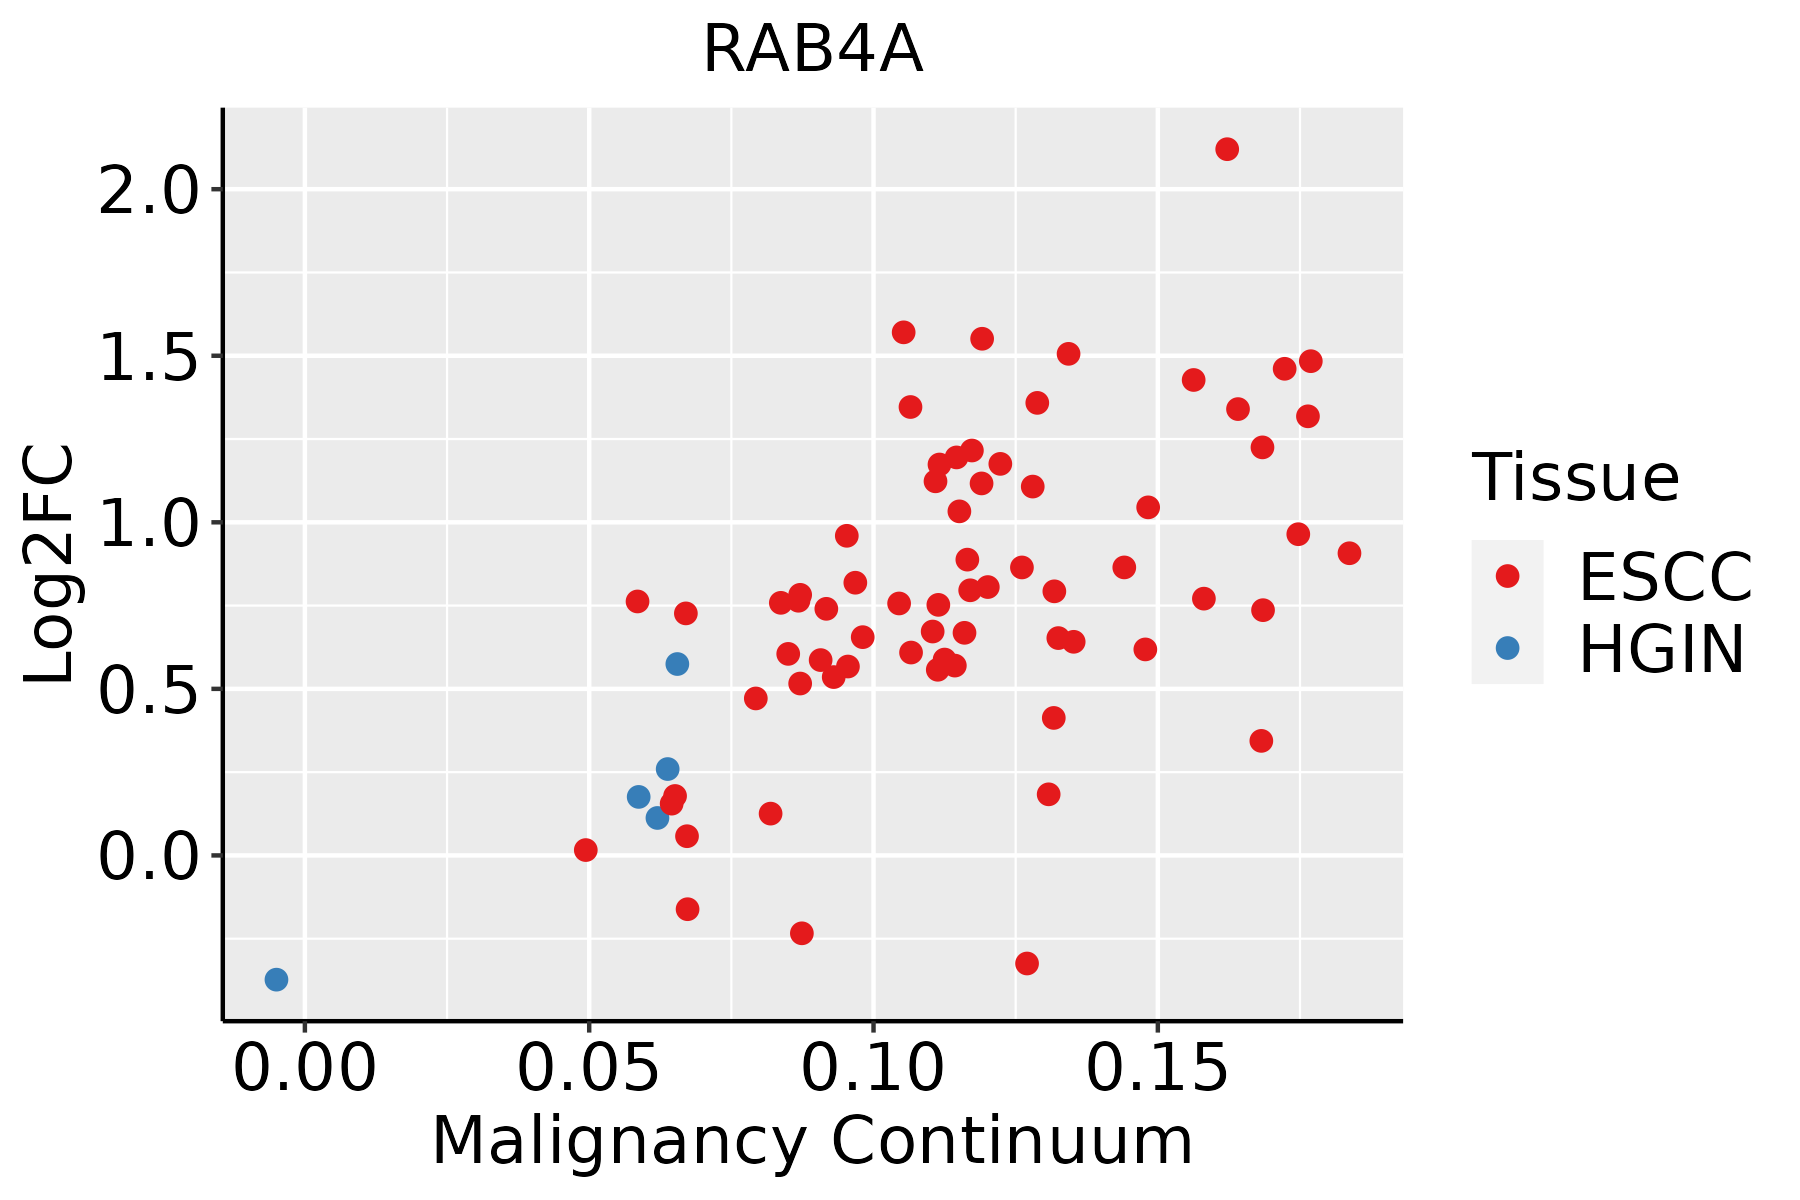 | ESCC: Esophageal squamous cell carcinoma |
| HGIN: High-grade intraepithelial neoplasias | ||
| LGIN: Low-grade intraepithelial neoplasias | ||
| Liver | 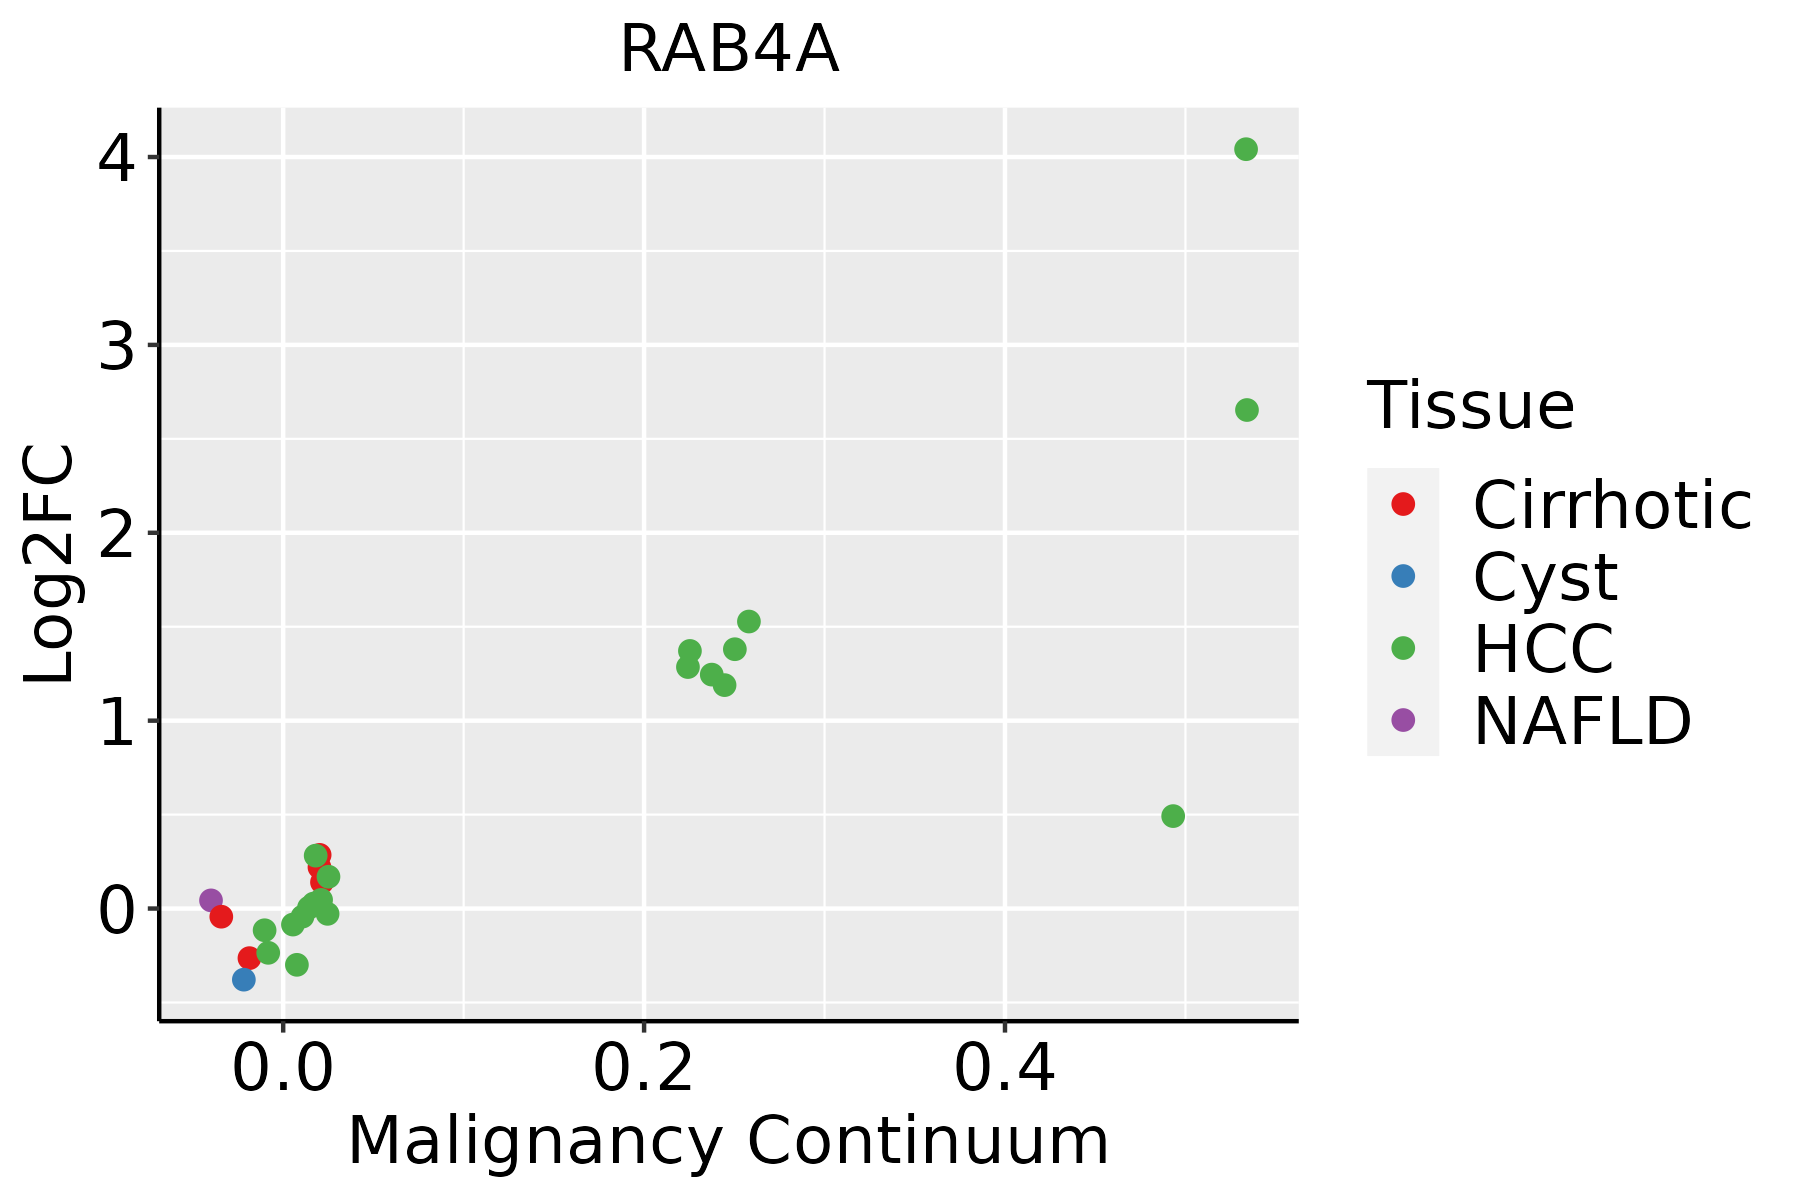 | HCC: Hepatocellular carcinoma |
| NAFLD: Non-alcoholic fatty liver disease | ||
| Oral Cavity | 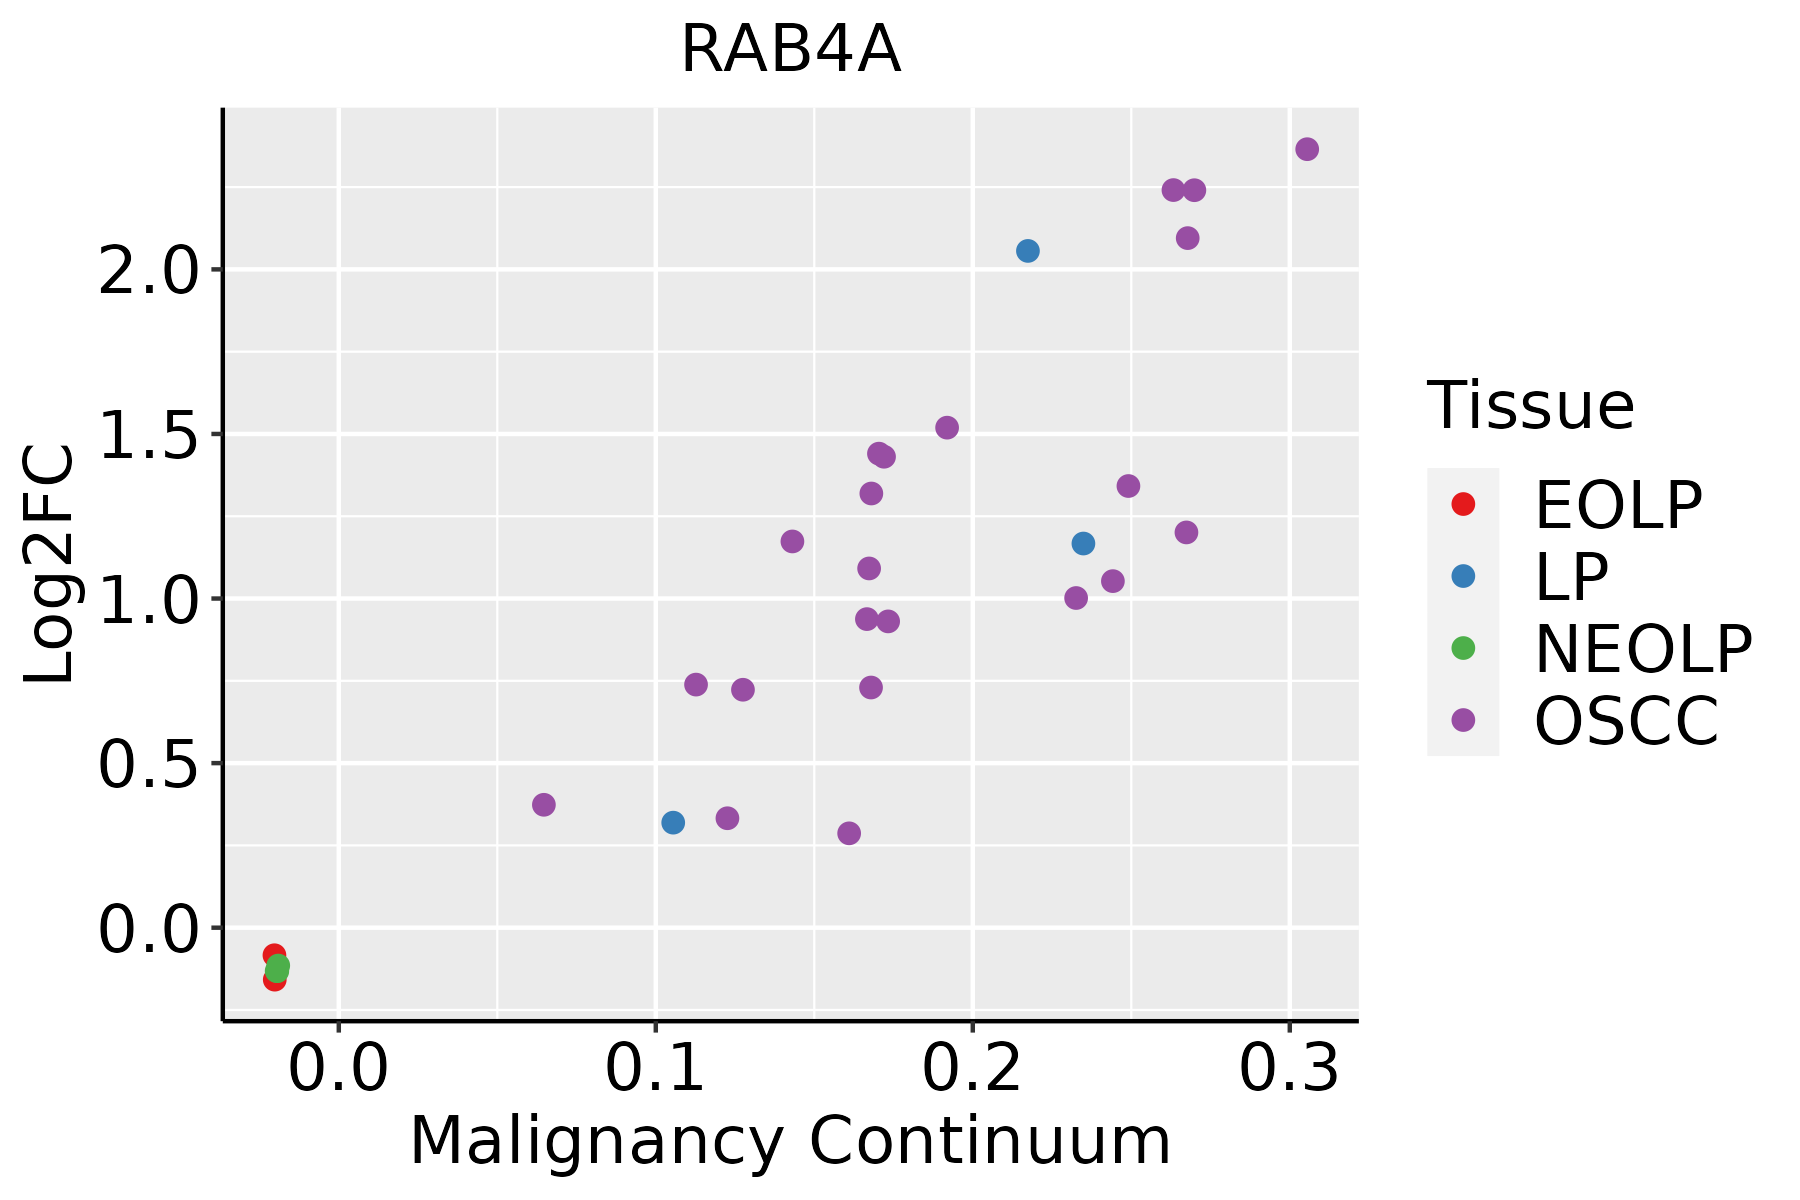 | EOLP: Erosive Oral lichen planus |
| LP: leukoplakia | ||
| NEOLP: Non-erosive oral lichen planus | ||
| OSCC: Oral squamous cell carcinoma | ||
| Prostate | 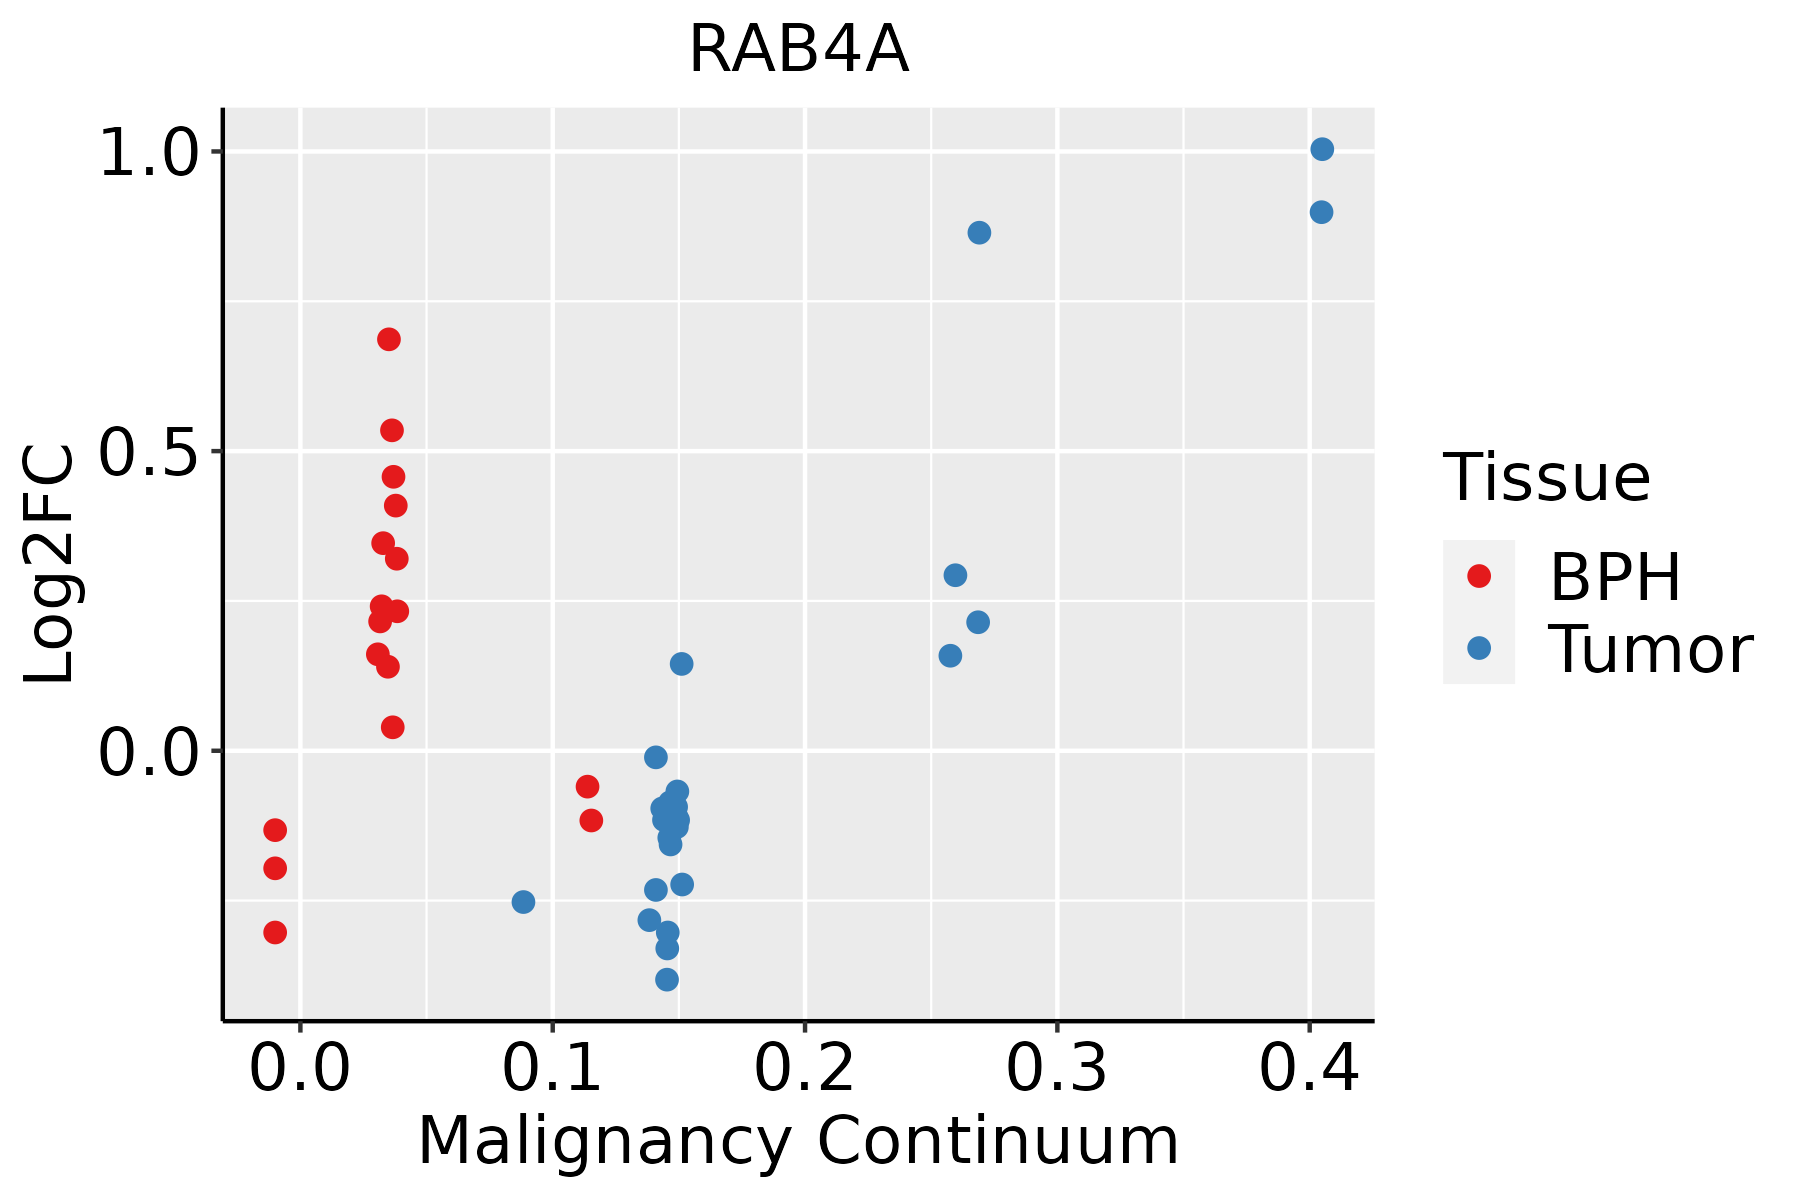 | BPH: Benign Prostatic Hyperplasia |
| Skin | 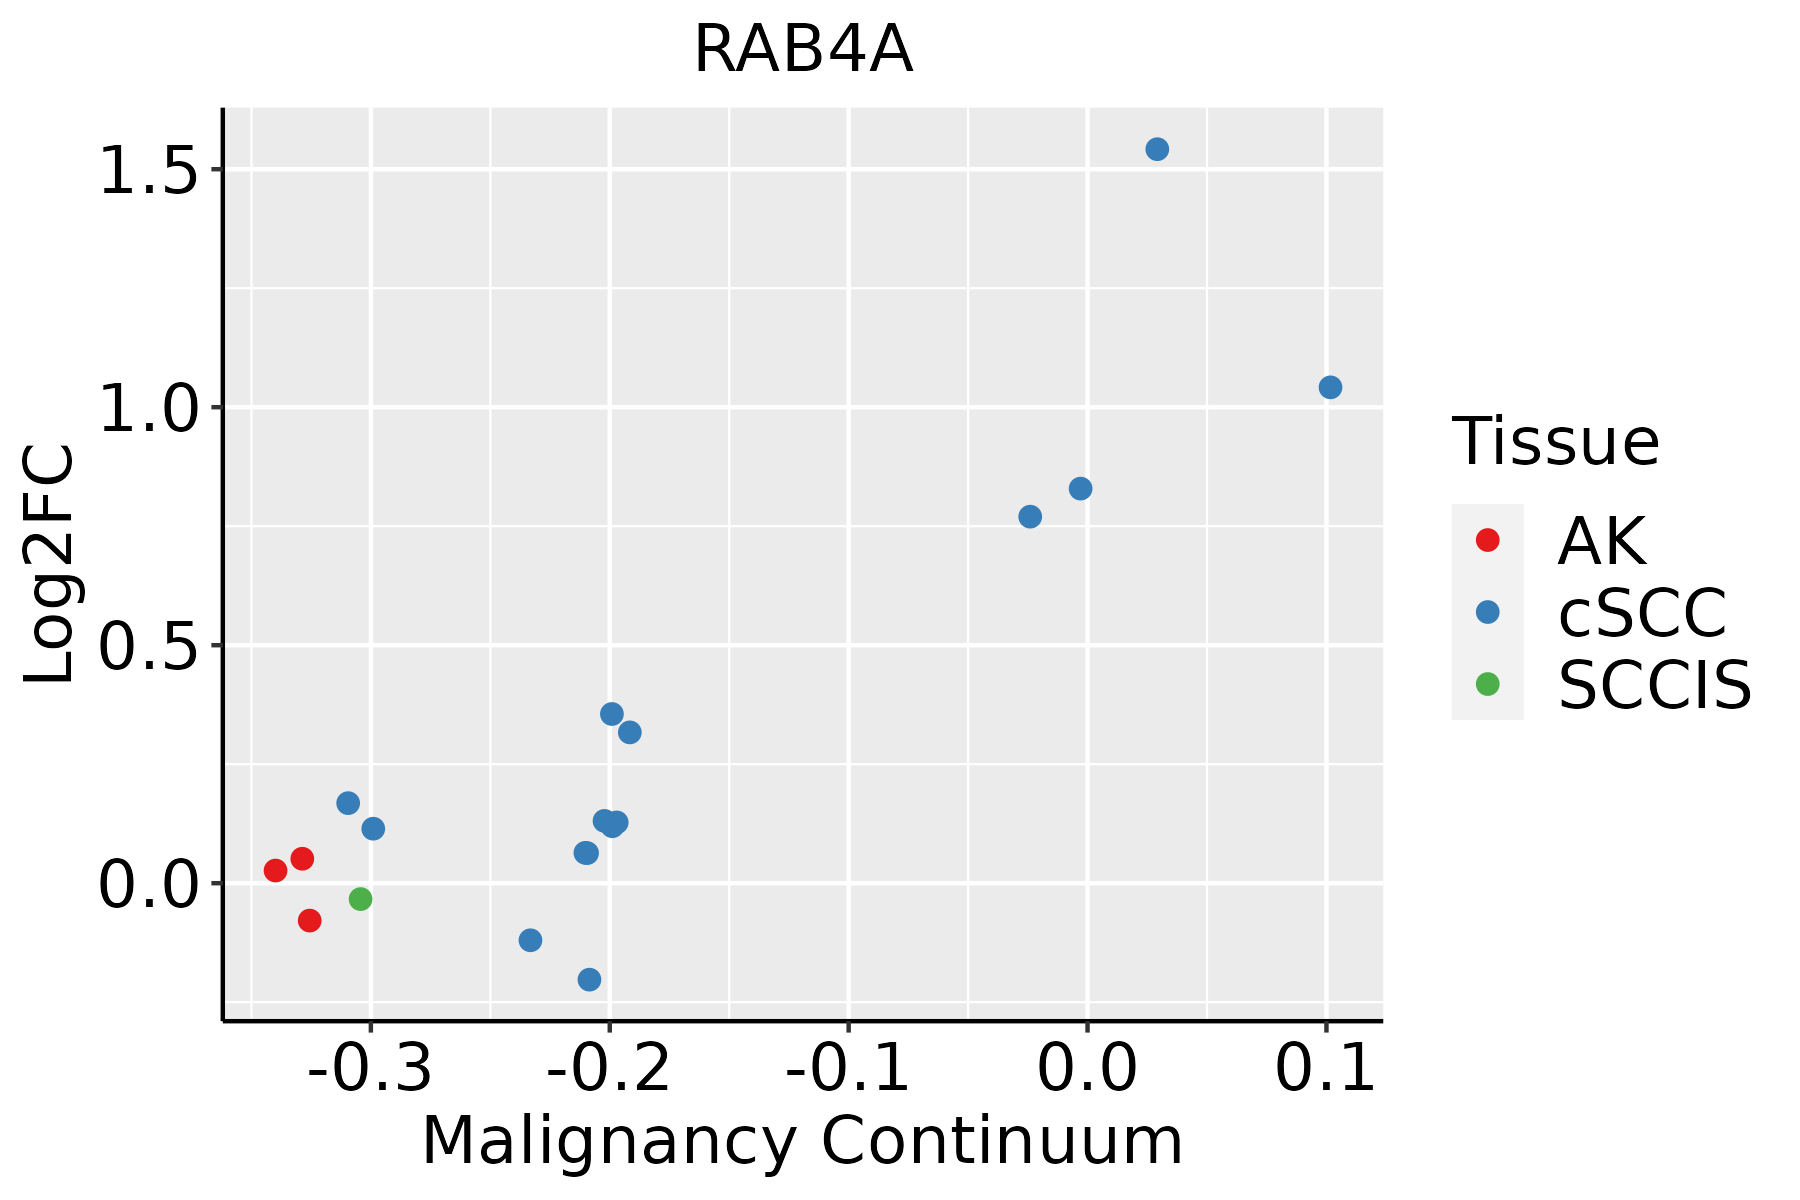 | AK: Actinic keratosis |
| cSCC: Cutaneous squamous cell carcinoma | ||
| SCCIS:squamous cell carcinoma in situ | ||
| Thyroid | 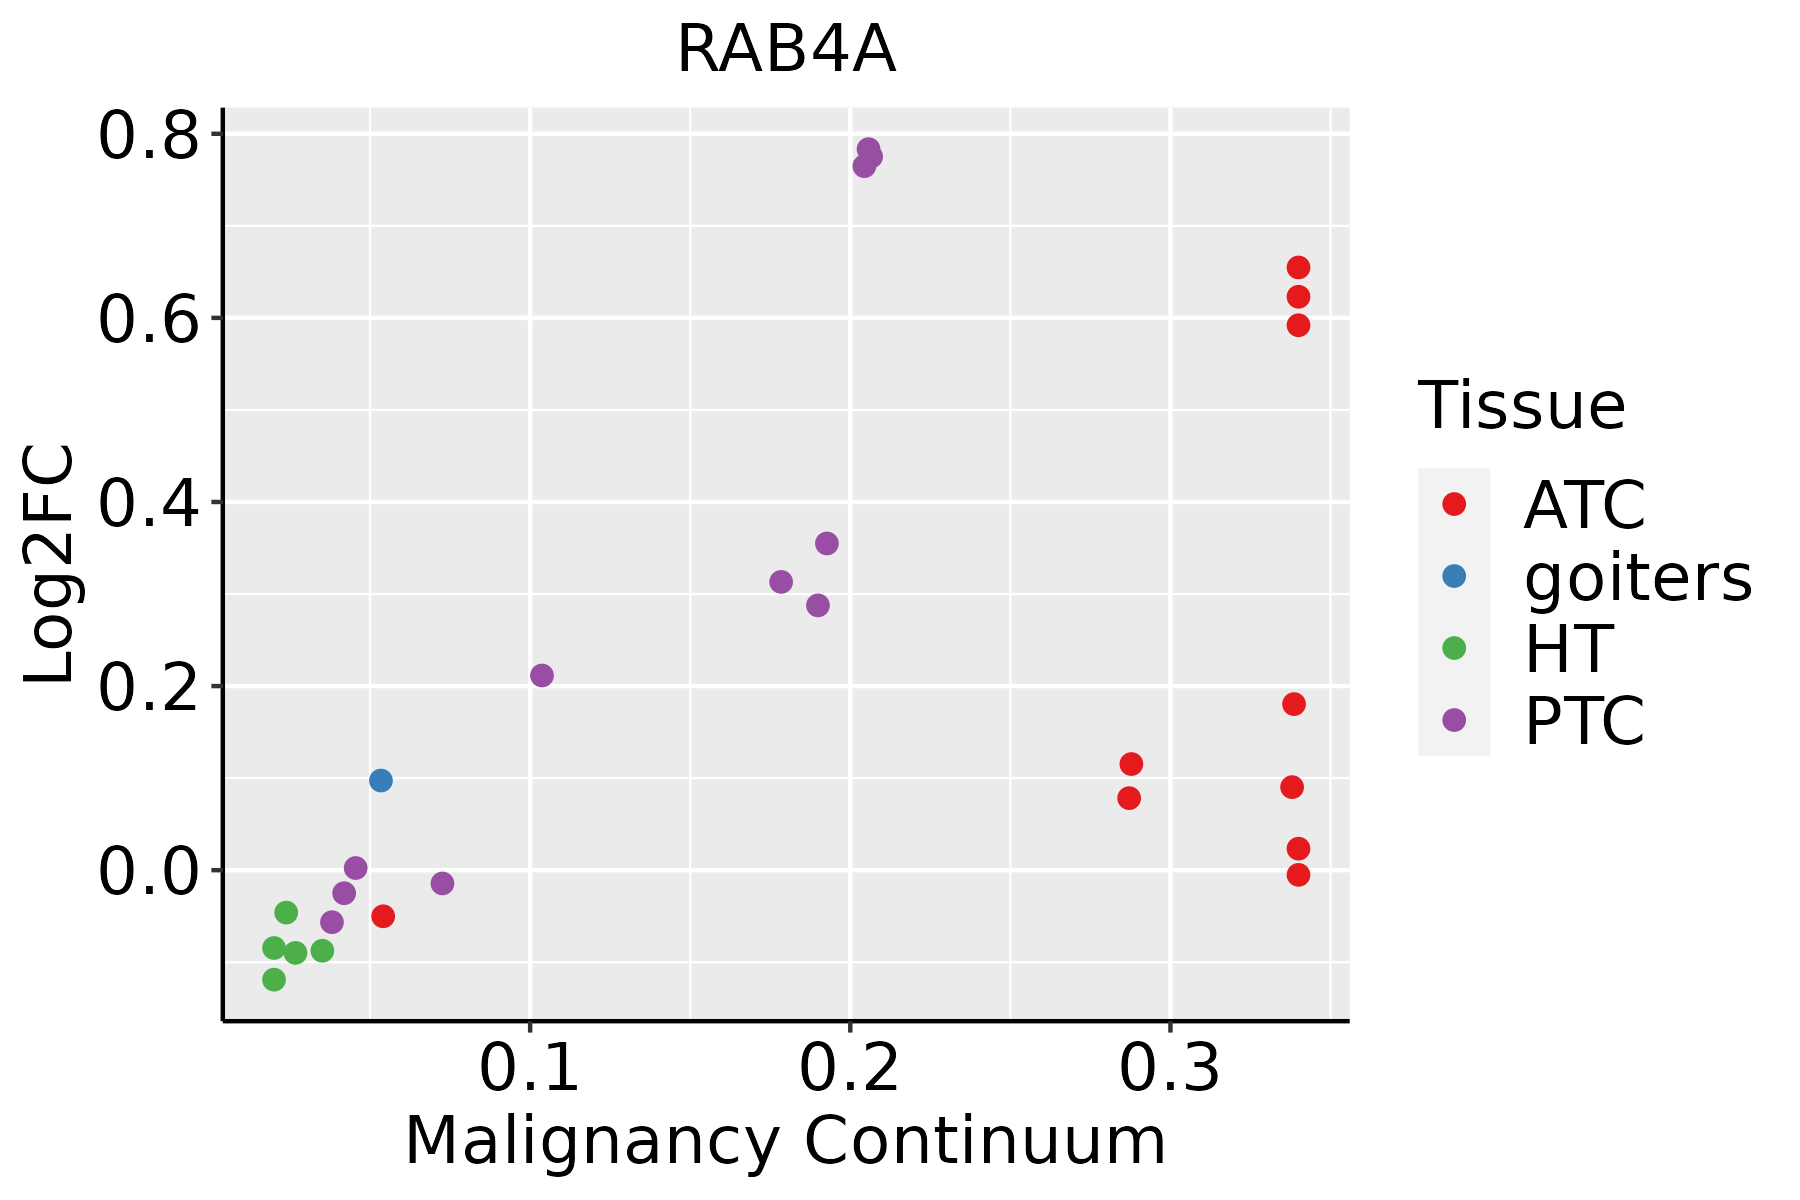 | ATC: Anaplastic thyroid cancer |
| HT: Hashimoto's thyroiditis | ||
| PTC: Papillary thyroid cancer |
| ∗log2FC in expression of this searched gene in stem-like cells from each diseased tissue sample relative to stem-like cells in normal samples in each tissue plotted against the malignancy continuum. Samples are colored based on if they are from different disease stage. |
Top |
Malignant transformation related pathway analysis |
| Find out the enriched GO biological processes and KEGG pathways involved in transition from healthy to precancer to cancer |
| Tissue | Disease Stage | Enriched GO biological Processes |
| Colorectum | AD |  |
| Colorectum | SER |  |
| Colorectum | MSS |  |
| Colorectum | MSI-H |  |
| Colorectum | FAP |  |
| ∗Top 15 enriched GO BP terms are showed in the bar plot of each disease state in each tissue. Each row represents a significant GO biological process which is colored according to the -log10(p.adjust). |
| Page: 1 2 3 4 5 6 7 8 9 |
| GO ID | Tissue | Disease Stage | Description | Gene Ratio | Bg Ratio | pvalue | p.adjust | Count |
| GO:0007265 | Colorectum | AD | Ras protein signal transduction | 104/3918 | 337/18723 | 1.01e-05 | 2.35e-04 | 104 |
| GO:0030100 | Colorectum | AD | regulation of endocytosis | 67/3918 | 211/18723 | 1.42e-04 | 2.01e-03 | 67 |
| GO:00301002 | Colorectum | MSS | regulation of endocytosis | 63/3467 | 211/18723 | 4.05e-05 | 7.66e-04 | 63 |
| GO:00072651 | Colorectum | MSS | Ras protein signal transduction | 91/3467 | 337/18723 | 7.20e-05 | 1.21e-03 | 91 |
| GO:00072652 | Colorectum | FAP | Ras protein signal transduction | 80/2622 | 337/18723 | 9.61e-07 | 4.33e-05 | 80 |
| GO:00301003 | Colorectum | FAP | regulation of endocytosis | 52/2622 | 211/18723 | 2.47e-05 | 5.77e-04 | 52 |
| GO:00072653 | Colorectum | CRC | Ras protein signal transduction | 70/2078 | 337/18723 | 1.49e-07 | 1.66e-05 | 70 |
| GO:00301004 | Colorectum | CRC | regulation of endocytosis | 39/2078 | 211/18723 | 9.51e-04 | 1.15e-02 | 39 |
| GO:003010018 | Esophagus | ESCC | regulation of endocytosis | 135/8552 | 211/18723 | 5.75e-08 | 1.02e-06 | 135 |
| GO:000726510 | Esophagus | ESCC | Ras protein signal transduction | 201/8552 | 337/18723 | 1.44e-07 | 2.30e-06 | 201 |
| GO:001988225 | Esophagus | ESCC | antigen processing and presentation | 67/8552 | 106/18723 | 2.03e-04 | 1.28e-03 | 67 |
| GO:000726511 | Liver | Cirrhotic | Ras protein signal transduction | 119/4634 | 337/18723 | 8.16e-06 | 1.22e-04 | 119 |
| GO:00198827 | Liver | Cirrhotic | antigen processing and presentation | 44/4634 | 106/18723 | 1.07e-04 | 1.10e-03 | 44 |
| GO:003010011 | Liver | Cirrhotic | regulation of endocytosis | 74/4634 | 211/18723 | 4.86e-04 | 3.90e-03 | 74 |
| GO:000726521 | Liver | HCC | Ras protein signal transduction | 187/7958 | 337/18723 | 8.89e-07 | 1.35e-05 | 187 |
| GO:001988212 | Liver | HCC | antigen processing and presentation | 65/7958 | 106/18723 | 7.06e-05 | 6.37e-04 | 65 |
| GO:003010021 | Liver | HCC | regulation of endocytosis | 117/7958 | 211/18723 | 9.56e-05 | 8.32e-04 | 117 |
| GO:00072659 | Oral cavity | OSCC | Ras protein signal transduction | 185/7305 | 337/18723 | 1.95e-09 | 4.60e-08 | 185 |
| GO:003010016 | Oral cavity | OSCC | regulation of endocytosis | 121/7305 | 211/18723 | 4.74e-08 | 8.80e-07 | 121 |
| GO:001988220 | Oral cavity | OSCC | antigen processing and presentation | 65/7305 | 106/18723 | 2.69e-06 | 3.32e-05 | 65 |
| Page: 1 2 |
| Pathway ID | Tissue | Disease Stage | Description | Gene Ratio | Bg Ratio | pvalue | p.adjust | qvalue | Count |
| hsa04144 | Colorectum | AD | Endocytosis | 111/2092 | 251/8465 | 5.95e-12 | 1.42e-10 | 9.08e-11 | 111 |
| hsa041441 | Colorectum | AD | Endocytosis | 111/2092 | 251/8465 | 5.95e-12 | 1.42e-10 | 9.08e-11 | 111 |
| hsa041444 | Colorectum | MSS | Endocytosis | 102/1875 | 251/8465 | 1.85e-11 | 4.43e-10 | 2.71e-10 | 102 |
| hsa041445 | Colorectum | MSS | Endocytosis | 102/1875 | 251/8465 | 1.85e-11 | 4.43e-10 | 2.71e-10 | 102 |
| hsa041446 | Colorectum | FAP | Endocytosis | 78/1404 | 251/8465 | 6.20e-09 | 2.96e-07 | 1.80e-07 | 78 |
| hsa041447 | Colorectum | FAP | Endocytosis | 78/1404 | 251/8465 | 6.20e-09 | 2.96e-07 | 1.80e-07 | 78 |
| hsa041448 | Colorectum | CRC | Endocytosis | 65/1091 | 251/8465 | 1.27e-08 | 1.06e-06 | 7.19e-07 | 65 |
| hsa041449 | Colorectum | CRC | Endocytosis | 65/1091 | 251/8465 | 1.27e-08 | 1.06e-06 | 7.19e-07 | 65 |
| hsa04144210 | Esophagus | ESCC | Endocytosis | 186/4205 | 251/8465 | 9.74e-16 | 4.66e-14 | 2.39e-14 | 186 |
| hsa0414437 | Esophagus | ESCC | Endocytosis | 186/4205 | 251/8465 | 9.74e-16 | 4.66e-14 | 2.39e-14 | 186 |
| hsa0414412 | Liver | Cirrhotic | Endocytosis | 119/2530 | 251/8465 | 2.33e-09 | 4.56e-08 | 2.81e-08 | 119 |
| hsa0414413 | Liver | Cirrhotic | Endocytosis | 119/2530 | 251/8465 | 2.33e-09 | 4.56e-08 | 2.81e-08 | 119 |
| hsa0414422 | Liver | HCC | Endocytosis | 178/4020 | 251/8465 | 2.03e-14 | 5.22e-13 | 2.91e-13 | 178 |
| hsa0414432 | Liver | HCC | Endocytosis | 178/4020 | 251/8465 | 2.03e-14 | 5.22e-13 | 2.91e-13 | 178 |
| hsa0414427 | Oral cavity | OSCC | Endocytosis | 174/3704 | 251/8465 | 9.42e-17 | 4.51e-15 | 2.29e-15 | 174 |
| hsa04144112 | Oral cavity | OSCC | Endocytosis | 174/3704 | 251/8465 | 9.42e-17 | 4.51e-15 | 2.29e-15 | 174 |
| hsa0414428 | Oral cavity | LP | Endocytosis | 121/2418 | 251/8465 | 1.89e-11 | 3.70e-10 | 2.38e-10 | 121 |
| hsa0414436 | Oral cavity | LP | Endocytosis | 121/2418 | 251/8465 | 1.89e-11 | 3.70e-10 | 2.38e-10 | 121 |
| hsa0414425 | Prostate | BPH | Endocytosis | 89/1718 | 251/8465 | 1.06e-08 | 1.29e-07 | 7.99e-08 | 89 |
| hsa04144111 | Prostate | BPH | Endocytosis | 89/1718 | 251/8465 | 1.06e-08 | 1.29e-07 | 7.99e-08 | 89 |
| Page: 1 2 |
Top |
Cell-cell communication analysis |
| Identification of potential cell-cell interactions between two cell types and their ligand-receptor pairs for different disease states |
| Ligand | Receptor | LRpair | Pathway | Tissue | Disease Stage |
| Page: 1 |
Top |
Single-cell gene regulatory network inference analysis |
| Find out the significant the regulons (TFs) and the target genes of each regulon across cell types for different disease states |
| TF | Cell Type | Tissue | Disease Stage | Target Gene | RSS | Regulon Activity |
| ∗The dot plots of a searched regulon are shown for all cell subpopulations in each disease state of each tissue based on the regulon specific score inferred using pySCENIC and by calculating the average expression. |
| Page: 1 |
Top |
Somatic mutation of malignant transformation related genes |
| Annotation of somatic variants for genes involved in malignant transformation |
| Hugo Symbol | Variant Class | Variant Classification | dbSNP RS | HGVSc | HGVSp | HGVSp Short | SWISSPROT | BIOTYPE | SIFT | PolyPhen | Tumor Sample Barcode | Tissue | Histology | Sex | Age | Stage | Therapy Types | Drugs | Outcome |
| RAB4A | SNV | Missense_Mutation | rs370982346 | c.401G>A | p.Arg134His | p.R134H | P20338 | protein_coding | deleterious(0) | possibly_damaging(0.821) | TCGA-BH-A18G-01 | Breast | breast invasive carcinoma | Female | >=65 | I/II | Unknown | Unknown | SD |
| RAB4A | deletion | Frame_Shift_Del | rs781323910 | c.111delA | p.Lys37AsnfsTer10 | p.K37Nfs*10 | P20338 | protein_coding | TCGA-EA-A3HU-01 | Cervix | cervical & endocervical cancer | Female | <65 | I/II | Unknown | Unknown | SD | ||
| RAB4A | SNV | Missense_Mutation | c.511N>A | p.Ala171Thr | p.A171T | P20338 | protein_coding | tolerated(0.07) | probably_damaging(0.989) | TCGA-AA-A01P-01 | Colorectum | colon adenocarcinoma | Female | >=65 | III/IV | Unknown | Unknown | PD | |
| RAB4A | SNV | Missense_Mutation | novel | c.189N>T | p.Lys63Asn | p.K63N | P20338 | protein_coding | deleterious(0) | possibly_damaging(0.75) | TCGA-CA-6717-01 | Colorectum | colon adenocarcinoma | Male | <65 | I/II | Chemotherapy | oxaliplatin | CR |
| RAB4A | SNV | Missense_Mutation | rs368207169 | c.620N>A | p.Arg207His | p.R207H | P20338 | protein_coding | tolerated(0.13) | benign(0) | TCGA-CK-6747-01 | Colorectum | colon adenocarcinoma | Female | >=65 | I/II | Unknown | Unknown | SD |
| RAB4A | deletion | Frame_Shift_Del | rs781323910 | c.104delN | p.Lys37AsnfsTer10 | p.K37Nfs*10 | P20338 | protein_coding | TCGA-F4-6570-01 | Colorectum | colon adenocarcinoma | Female | >=65 | I/II | Unknown | Unknown | SD | ||
| RAB4A | insertion | Frame_Shift_Ins | novel | c.103_104insA | p.Phe38IlefsTer4 | p.F38Ifs*4 | P20338 | protein_coding | TCGA-G4-6628-01 | Colorectum | colon adenocarcinoma | Male | >=65 | I/II | Unknown | Unknown | SD | ||
| RAB4A | deletion | Frame_Shift_Del | rs781323910 | c.111delA | p.Lys37AsnfsTer10 | p.K37Nfs*10 | P20338 | protein_coding | TCGA-WS-AB45-01 | Colorectum | colon adenocarcinoma | Female | <65 | I/II | Unknown | Unknown | SD | ||
| RAB4A | SNV | Missense_Mutation | rs368207169 | c.620N>A | p.Arg207His | p.R207H | P20338 | protein_coding | tolerated(0.13) | benign(0) | TCGA-A5-A0VP-01 | Endometrium | uterine corpus endometrioid carcinoma | Female | >=65 | I/II | Unknown | Unknown | SD |
| RAB4A | SNV | Missense_Mutation | rs779345299 | c.619N>T | p.Arg207Cys | p.R207C | P20338 | protein_coding | tolerated(0.07) | benign(0) | TCGA-AJ-A3BG-01 | Endometrium | uterine corpus endometrioid carcinoma | Female | >=65 | I/II | Chemotherapy | carboplatin | PD |
| Page: 1 2 3 4 |
Top |
Related drugs of malignant transformation related genes |
| Identification of chemicals and drugs interact with genes involved in malignant transfromation |
| (DGIdb 4.0) |
| Entrez ID | Symbol | Category | Interaction Types | Drug Claim Name | Drug Name | PMIDs |
| Page: 1 |

Copyright 2023-Present -The University of Texas Health Science Center at Houston |