
|
|||||
|
 | |
| |
| |
| |
| |
| |
|
Gene: RAB35 |
Gene summary for RAB35 |
| Gene information | Species | Human | Gene symbol | RAB35 | Gene ID | 11021 |
| Gene name | RAB35, member RAS oncogene family | |
| Gene Alias | H-ray | |
| Cytomap | 12q24.23 | |
| Gene Type | protein-coding | GO ID | GO:0000278 | UniProtAcc | Q15286 |
Top |
Malignant transformation analysis |
| Identification of the aberrant gene expression in precancerous and cancerous lesions by comparing the gene expression of stem-like cells in diseased tissues with normal stem cells |
| Entrez ID | Symbol | Replicates | Species | Organ | Tissue | Adj P-value | Log2FC | Malignancy |
| 11021 | RAB35 | LN38 | Human | Oral cavity | OSCC | 3.09e-03 | 8.45e-01 | 0.168 |
| 11021 | RAB35 | LN46 | Human | Oral cavity | OSCC | 6.43e-12 | 4.80e-01 | 0.1666 |
| 11021 | RAB35 | LP15 | Human | Oral cavity | LP | 5.75e-08 | 9.44e-01 | 0.2174 |
| 11021 | RAB35 | SYSMH1 | Human | Oral cavity | OSCC | 2.27e-10 | 1.28e-01 | 0.1127 |
| 11021 | RAB35 | SYSMH2 | Human | Oral cavity | OSCC | 1.39e-07 | 2.69e-01 | 0.2326 |
| 11021 | RAB35 | SYSMH3 | Human | Oral cavity | OSCC | 3.64e-17 | 3.67e-01 | 0.2442 |
| 11021 | RAB35 | P5_S10_cSCC | Human | Skin | cSCC | 2.57e-05 | 1.58e-01 | -0.299 |
| 11021 | RAB35 | P1_cSCC | Human | Skin | cSCC | 1.55e-08 | 4.94e-01 | 0.0292 |
| 11021 | RAB35 | P2_cSCC | Human | Skin | cSCC | 7.96e-03 | 2.22e-01 | -0.024 |
| 11021 | RAB35 | P4_cSCC | Human | Skin | cSCC | 4.66e-19 | 3.87e-01 | -0.00290000000000005 |
| 11021 | RAB35 | P10_cSCC | Human | Skin | cSCC | 2.30e-08 | 3.36e-01 | 0.1017 |
| Page: 1 2 3 4 5 |
| Tissue | Expression Dynamics | Abbreviation |
| Esophagus |  | ESCC: Esophageal squamous cell carcinoma |
| HGIN: High-grade intraepithelial neoplasias | ||
| LGIN: Low-grade intraepithelial neoplasias | ||
| Liver | 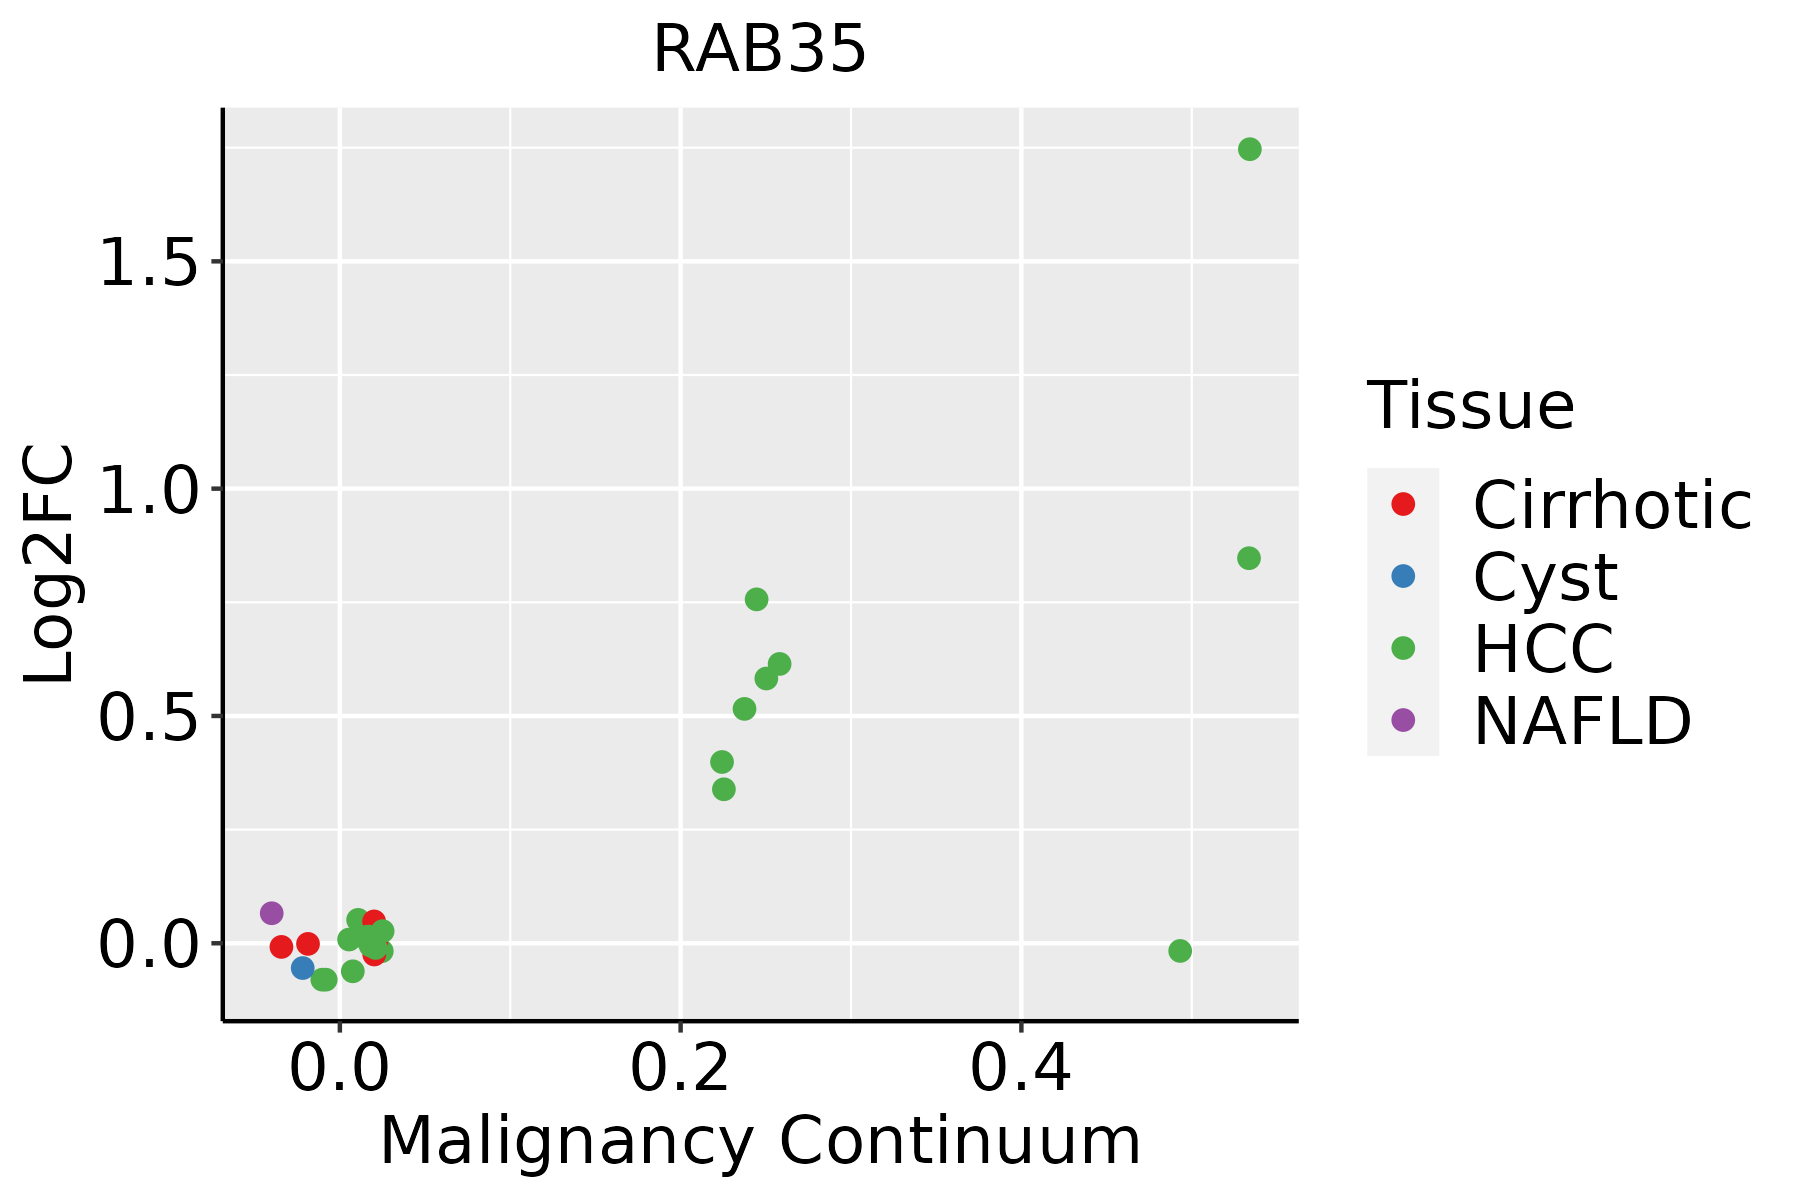 | HCC: Hepatocellular carcinoma |
| NAFLD: Non-alcoholic fatty liver disease | ||
| Oral Cavity | 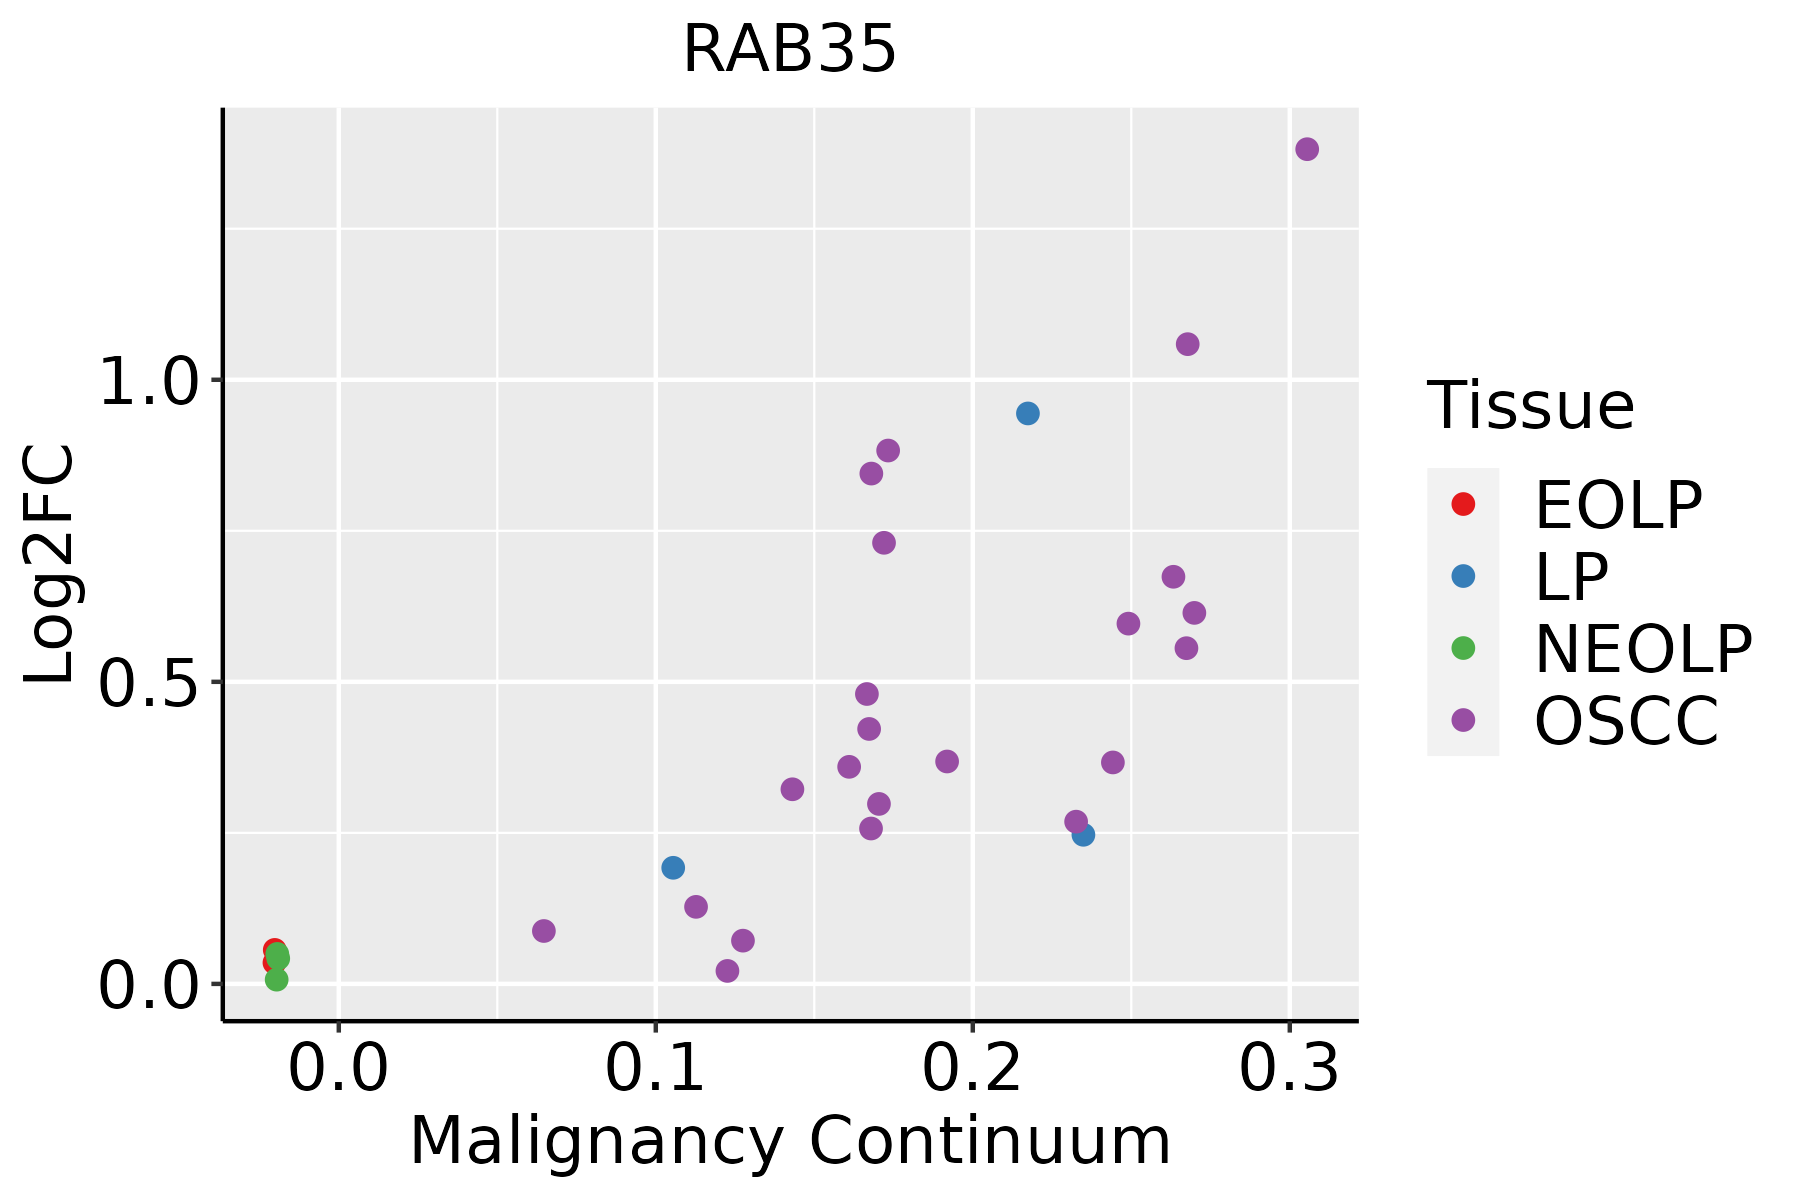 | EOLP: Erosive Oral lichen planus |
| LP: leukoplakia | ||
| NEOLP: Non-erosive oral lichen planus | ||
| OSCC: Oral squamous cell carcinoma | ||
| Skin | 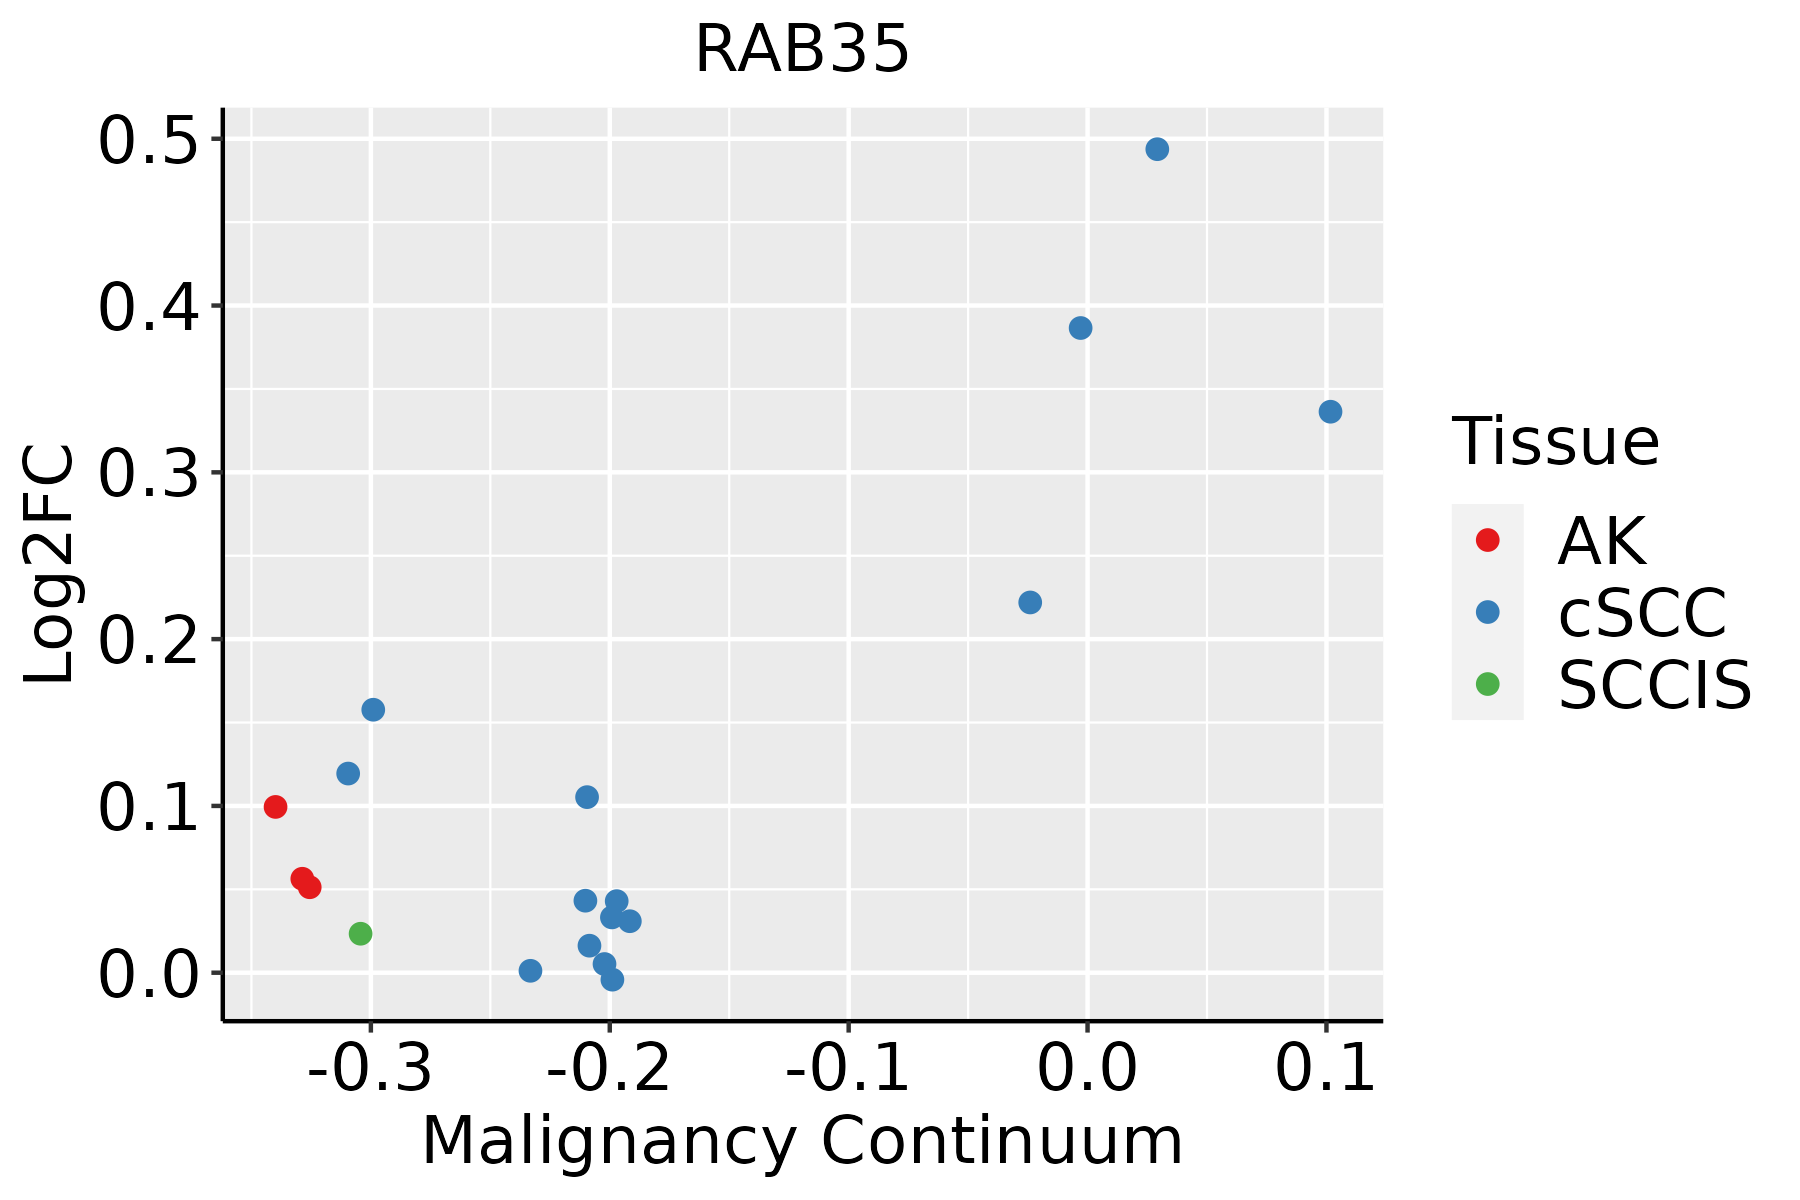 | AK: Actinic keratosis |
| cSCC: Cutaneous squamous cell carcinoma | ||
| SCCIS:squamous cell carcinoma in situ |
| ∗log2FC in expression of this searched gene in stem-like cells from each diseased tissue sample relative to stem-like cells in normal samples in each tissue plotted against the malignancy continuum. Samples are colored based on if they are from different disease stage. |
Top |
Malignant transformation related pathway analysis |
| Find out the enriched GO biological processes and KEGG pathways involved in transition from healthy to precancer to cancer |
| Tissue | Disease Stage | Enriched GO biological Processes |
| Colorectum | AD |  |
| Colorectum | SER |  |
| Colorectum | MSS |  |
| Colorectum | MSI-H |  |
| Colorectum | FAP |  |
| ∗Top 15 enriched GO BP terms are showed in the bar plot of each disease state in each tissue. Each row represents a significant GO biological process which is colored according to the -log10(p.adjust). |
| Page: 1 2 3 4 5 6 7 8 9 |
| GO ID | Tissue | Disease Stage | Description | Gene Ratio | Bg Ratio | pvalue | p.adjust | Count |
| GO:001619715 | Esophagus | ESCC | endosomal transport | 168/8552 | 230/18723 | 2.28e-17 | 1.93e-15 | 168 |
| GO:009887615 | Esophagus | ESCC | vesicle-mediated transport to the plasma membrane | 99/8552 | 136/18723 | 1.13e-10 | 3.39e-09 | 99 |
| GO:000028115 | Esophagus | ESCC | mitotic cytokinesis | 58/8552 | 71/18723 | 4.34e-10 | 1.15e-08 | 58 |
| GO:000091016 | Esophagus | ESCC | cytokinesis | 115/8552 | 173/18723 | 2.48e-08 | 4.68e-07 | 115 |
| GO:006164015 | Esophagus | ESCC | cytoskeleton-dependent cytokinesis | 72/8552 | 100/18723 | 8.10e-08 | 1.39e-06 | 72 |
| GO:000726510 | Esophagus | ESCC | Ras protein signal transduction | 201/8552 | 337/18723 | 1.44e-07 | 2.30e-06 | 201 |
| GO:00324565 | Esophagus | ESCC | endocytic recycling | 51/8552 | 73/18723 | 2.47e-05 | 2.10e-04 | 51 |
| GO:199009017 | Esophagus | ESCC | cellular response to nerve growth factor stimulus | 38/8552 | 53/18723 | 1.10e-04 | 7.69e-04 | 38 |
| GO:001988225 | Esophagus | ESCC | antigen processing and presentation | 67/8552 | 106/18723 | 2.03e-04 | 1.28e-03 | 67 |
| GO:199008916 | Esophagus | ESCC | response to nerve growth factor | 39/8552 | 56/18723 | 2.44e-04 | 1.51e-03 | 39 |
| GO:00360106 | Esophagus | ESCC | protein localization to endosome | 18/8552 | 24/18723 | 3.43e-03 | 1.41e-02 | 18 |
| GO:001619711 | Liver | Cirrhotic | endosomal transport | 93/4634 | 230/18723 | 1.01e-07 | 2.93e-06 | 93 |
| GO:009887611 | Liver | Cirrhotic | vesicle-mediated transport to the plasma membrane | 59/4634 | 136/18723 | 1.46e-06 | 2.88e-05 | 59 |
| GO:000726511 | Liver | Cirrhotic | Ras protein signal transduction | 119/4634 | 337/18723 | 8.16e-06 | 1.22e-04 | 119 |
| GO:00198827 | Liver | Cirrhotic | antigen processing and presentation | 44/4634 | 106/18723 | 1.07e-04 | 1.10e-03 | 44 |
| GO:00002812 | Liver | Cirrhotic | mitotic cytokinesis | 32/4634 | 71/18723 | 1.48e-04 | 1.42e-03 | 32 |
| GO:00009105 | Liver | Cirrhotic | cytokinesis | 62/4634 | 173/18723 | 7.13e-04 | 5.33e-03 | 62 |
| GO:199009011 | Liver | Cirrhotic | cellular response to nerve growth factor stimulus | 24/4634 | 53/18723 | 8.86e-04 | 6.37e-03 | 24 |
| GO:199008911 | Liver | Cirrhotic | response to nerve growth factor | 25/4634 | 56/18723 | 9.03e-04 | 6.46e-03 | 25 |
| GO:00616402 | Liver | Cirrhotic | cytoskeleton-dependent cytokinesis | 38/4634 | 100/18723 | 2.22e-03 | 1.35e-02 | 38 |
| Page: 1 2 3 |
| Pathway ID | Tissue | Disease Stage | Description | Gene Ratio | Bg Ratio | pvalue | p.adjust | qvalue | Count |
| hsa04144210 | Esophagus | ESCC | Endocytosis | 186/4205 | 251/8465 | 9.74e-16 | 4.66e-14 | 2.39e-14 | 186 |
| hsa0414437 | Esophagus | ESCC | Endocytosis | 186/4205 | 251/8465 | 9.74e-16 | 4.66e-14 | 2.39e-14 | 186 |
| hsa0414412 | Liver | Cirrhotic | Endocytosis | 119/2530 | 251/8465 | 2.33e-09 | 4.56e-08 | 2.81e-08 | 119 |
| hsa0414413 | Liver | Cirrhotic | Endocytosis | 119/2530 | 251/8465 | 2.33e-09 | 4.56e-08 | 2.81e-08 | 119 |
| hsa0414422 | Liver | HCC | Endocytosis | 178/4020 | 251/8465 | 2.03e-14 | 5.22e-13 | 2.91e-13 | 178 |
| hsa0414432 | Liver | HCC | Endocytosis | 178/4020 | 251/8465 | 2.03e-14 | 5.22e-13 | 2.91e-13 | 178 |
| hsa0414427 | Oral cavity | OSCC | Endocytosis | 174/3704 | 251/8465 | 9.42e-17 | 4.51e-15 | 2.29e-15 | 174 |
| hsa04144112 | Oral cavity | OSCC | Endocytosis | 174/3704 | 251/8465 | 9.42e-17 | 4.51e-15 | 2.29e-15 | 174 |
| hsa0414428 | Oral cavity | LP | Endocytosis | 121/2418 | 251/8465 | 1.89e-11 | 3.70e-10 | 2.38e-10 | 121 |
| hsa0414436 | Oral cavity | LP | Endocytosis | 121/2418 | 251/8465 | 1.89e-11 | 3.70e-10 | 2.38e-10 | 121 |
| Page: 1 |
Top |
Cell-cell communication analysis |
| Identification of potential cell-cell interactions between two cell types and their ligand-receptor pairs for different disease states |
| Ligand | Receptor | LRpair | Pathway | Tissue | Disease Stage |
| Page: 1 |
Top |
Single-cell gene regulatory network inference analysis |
| Find out the significant the regulons (TFs) and the target genes of each regulon across cell types for different disease states |
| TF | Cell Type | Tissue | Disease Stage | Target Gene | RSS | Regulon Activity |
| ∗The dot plots of a searched regulon are shown for all cell subpopulations in each disease state of each tissue based on the regulon specific score inferred using pySCENIC and by calculating the average expression. |
| Page: 1 |
Top |
Somatic mutation of malignant transformation related genes |
| Annotation of somatic variants for genes involved in malignant transformation |
| Hugo Symbol | Variant Class | Variant Classification | dbSNP RS | HGVSc | HGVSp | HGVSp Short | SWISSPROT | BIOTYPE | SIFT | PolyPhen | Tumor Sample Barcode | Tissue | Histology | Sex | Age | Stage | Therapy Types | Drugs | Outcome |
| RAB35 | SNV | Missense_Mutation | c.416C>A | p.Ala139Asp | p.A139D | Q15286 | protein_coding | deleterious(0) | probably_damaging(0.989) | TCGA-A8-A09X-01 | Breast | breast invasive carcinoma | Female | <65 | III/IV | Unknown | Unknown | SD | |
| RAB35 | SNV | Missense_Mutation | c.135N>G | p.Phe45Leu | p.F45L | Q15286 | protein_coding | deleterious(0) | benign(0.423) | TCGA-D8-A1JN-01 | Breast | breast invasive carcinoma | Female | >=65 | III/IV | Hormone Therapy | anastrozolum | SD | |
| RAB35 | SNV | Missense_Mutation | novel | c.393N>T | p.Glu131Asp | p.E131D | Q15286 | protein_coding | tolerated(0.98) | benign(0) | TCGA-2W-A8YY-01 | Cervix | cervical & endocervical cancer | Female | <65 | I/II | Chemotherapy | cisplatin | CR |
| RAB35 | SNV | Missense_Mutation | novel | c.587N>A | p.Arg196Gln | p.R196Q | Q15286 | protein_coding | tolerated(0.48) | benign(0.042) | TCGA-AA-3984-01 | Colorectum | colon adenocarcinoma | Female | <65 | I/II | Unknown | Unknown | SD |
| RAB35 | SNV | Missense_Mutation | c.206G>C | p.Arg69Pro | p.R69P | Q15286 | protein_coding | deleterious(0) | probably_damaging(1) | TCGA-CK-4951-01 | Colorectum | colon adenocarcinoma | Female | >=65 | I/II | Unknown | Unknown | PD | |
| RAB35 | SNV | Missense_Mutation | c.280N>A | p.Glu94Lys | p.E94K | Q15286 | protein_coding | tolerated(0.13) | benign(0.163) | TCGA-CM-5349-01 | Colorectum | colon adenocarcinoma | Female | >=65 | I/II | Unknown | Unknown | SD | |
| RAB35 | SNV | Missense_Mutation | c.416N>T | p.Ala139Val | p.A139V | Q15286 | protein_coding | deleterious(0) | possibly_damaging(0.866) | TCGA-D5-6540-01 | Colorectum | colon adenocarcinoma | Male | >=65 | I/II | Unknown | Unknown | SD | |
| RAB35 | SNV | Missense_Mutation | novel | c.517N>G | p.Lys173Glu | p.K173E | Q15286 | protein_coding | tolerated(0.2) | benign(0.017) | TCGA-AJ-A3EK-01 | Endometrium | uterine corpus endometrioid carcinoma | Female | <65 | I/II | Chemotherapy | carboplatin | CR |
| RAB35 | SNV | Missense_Mutation | novel | c.469G>A | p.Val157Met | p.V157M | Q15286 | protein_coding | deleterious(0) | probably_damaging(0.982) | TCGA-AX-A2HD-01 | Endometrium | uterine corpus endometrioid carcinoma | Female | >=65 | III/IV | Unknown | Unknown | SD |
| RAB35 | SNV | Missense_Mutation | c.65G>A | p.Ser22Asn | p.S22N | Q15286 | protein_coding | deleterious(0) | probably_damaging(0.97) | TCGA-B5-A0JY-01 | Endometrium | uterine corpus endometrioid carcinoma | Female | <65 | III/IV | Chemotherapy | doxorubicin | SD |
| Page: 1 2 |
Top |
Related drugs of malignant transformation related genes |
| Identification of chemicals and drugs interact with genes involved in malignant transfromation |
| (DGIdb 4.0) |
| Entrez ID | Symbol | Category | Interaction Types | Drug Claim Name | Drug Name | PMIDs |
| Page: 1 |

Copyright 2023-Present -The University of Texas Health Science Center at Houston |