
|
|||||
|
 | |
| |
| |
| |
| |
| |
|
Gene: PSMB8 |
Gene summary for PSMB8 |
| Gene information | Species | Human | Gene symbol | PSMB8 | Gene ID | 5696 |
| Gene name | proteasome 20S subunit beta 8 | |
| Gene Alias | ALDD | |
| Cytomap | 6p21.32 | |
| Gene Type | protein-coding | GO ID | GO:0002376 | UniProtAcc | P28062 |
Top |
Malignant transformation analysis |
| Identification of the aberrant gene expression in precancerous and cancerous lesions by comparing the gene expression of stem-like cells in diseased tissues with normal stem cells |
| Entrez ID | Symbol | Replicates | Species | Organ | Tissue | Adj P-value | Log2FC | Malignancy |
| 5696 | PSMB8 | P23T-E | Human | Esophagus | ESCC | 3.11e-57 | 1.60e+00 | 0.108 |
| 5696 | PSMB8 | P24T-E | Human | Esophagus | ESCC | 1.09e-91 | 2.23e+00 | 0.1287 |
| 5696 | PSMB8 | P26T-E | Human | Esophagus | ESCC | 1.18e-53 | 1.02e+00 | 0.1276 |
| 5696 | PSMB8 | P27T-E | Human | Esophagus | ESCC | 2.65e-45 | 1.26e+00 | 0.1055 |
| 5696 | PSMB8 | P28T-E | Human | Esophagus | ESCC | 2.92e-59 | 1.21e+00 | 0.1149 |
| 5696 | PSMB8 | P30T-E | Human | Esophagus | ESCC | 5.25e-31 | 1.36e+00 | 0.137 |
| 5696 | PSMB8 | P31T-E | Human | Esophagus | ESCC | 5.87e-93 | 1.70e+00 | 0.1251 |
| 5696 | PSMB8 | P32T-E | Human | Esophagus | ESCC | 5.70e-34 | 7.95e-01 | 0.1666 |
| 5696 | PSMB8 | P36T-E | Human | Esophagus | ESCC | 1.86e-34 | 1.51e+00 | 0.1187 |
| 5696 | PSMB8 | P37T-E | Human | Esophagus | ESCC | 3.39e-58 | 1.48e+00 | 0.1371 |
| 5696 | PSMB8 | P38T-E | Human | Esophagus | ESCC | 8.23e-15 | 8.45e-01 | 0.127 |
| 5696 | PSMB8 | P39T-E | Human | Esophagus | ESCC | 4.06e-22 | 6.93e-01 | 0.0894 |
| 5696 | PSMB8 | P40T-E | Human | Esophagus | ESCC | 3.09e-48 | 1.51e+00 | 0.109 |
| 5696 | PSMB8 | P42T-E | Human | Esophagus | ESCC | 5.55e-34 | 9.92e-01 | 0.1175 |
| 5696 | PSMB8 | P44T-E | Human | Esophagus | ESCC | 6.64e-21 | 8.14e-01 | 0.1096 |
| 5696 | PSMB8 | P47T-E | Human | Esophagus | ESCC | 4.93e-52 | 1.13e+00 | 0.1067 |
| 5696 | PSMB8 | P48T-E | Human | Esophagus | ESCC | 1.77e-37 | 8.71e-01 | 0.0959 |
| 5696 | PSMB8 | P49T-E | Human | Esophagus | ESCC | 3.11e-18 | 2.43e+00 | 0.1768 |
| 5696 | PSMB8 | P52T-E | Human | Esophagus | ESCC | 2.65e-81 | 2.30e+00 | 0.1555 |
| 5696 | PSMB8 | P54T-E | Human | Esophagus | ESCC | 9.14e-44 | 1.34e+00 | 0.0975 |
| Page: 1 2 3 4 5 6 7 8 9 10 |
| Tissue | Expression Dynamics | Abbreviation |
| Breast | 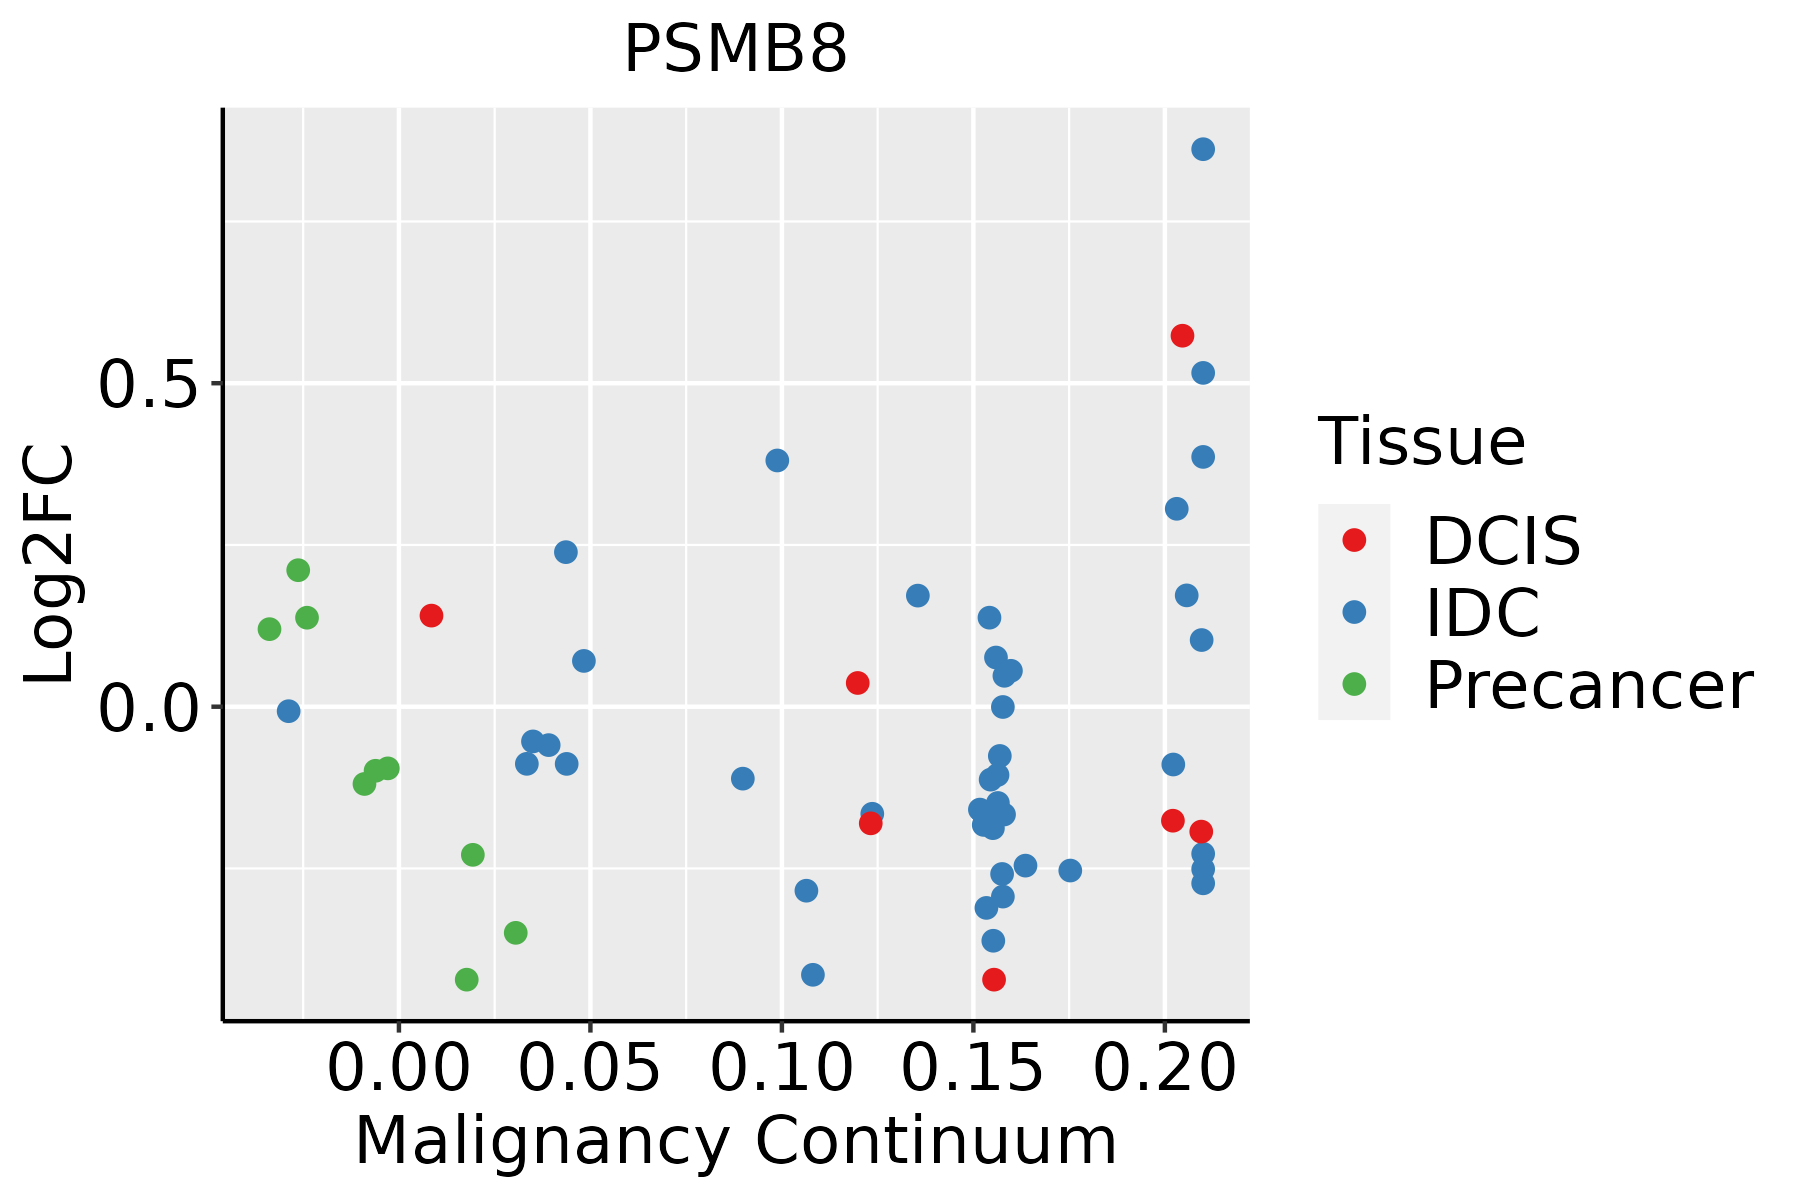 | IDC: Invasive ductal carcinoma |
| DCIS: Ductal carcinoma in situ | ||
| Precancer(BRCA1-mut): Precancerous lesion from BRCA1 mutation carriers | ||
| Colorectum (GSE201348) |  | FAP: Familial adenomatous polyposis |
| CRC: Colorectal cancer | ||
| Colorectum (HTA11) |  | AD: Adenomas |
| SER: Sessile serrated lesions | ||
| MSI-H: Microsatellite-high colorectal cancer | ||
| MSS: Microsatellite stable colorectal cancer | ||
| Esophagus |  | ESCC: Esophageal squamous cell carcinoma |
| HGIN: High-grade intraepithelial neoplasias | ||
| LGIN: Low-grade intraepithelial neoplasias | ||
| Liver |  | HCC: Hepatocellular carcinoma |
| NAFLD: Non-alcoholic fatty liver disease | ||
| Oral Cavity |  | EOLP: Erosive Oral lichen planus |
| LP: leukoplakia | ||
| NEOLP: Non-erosive oral lichen planus | ||
| OSCC: Oral squamous cell carcinoma | ||
| Skin | 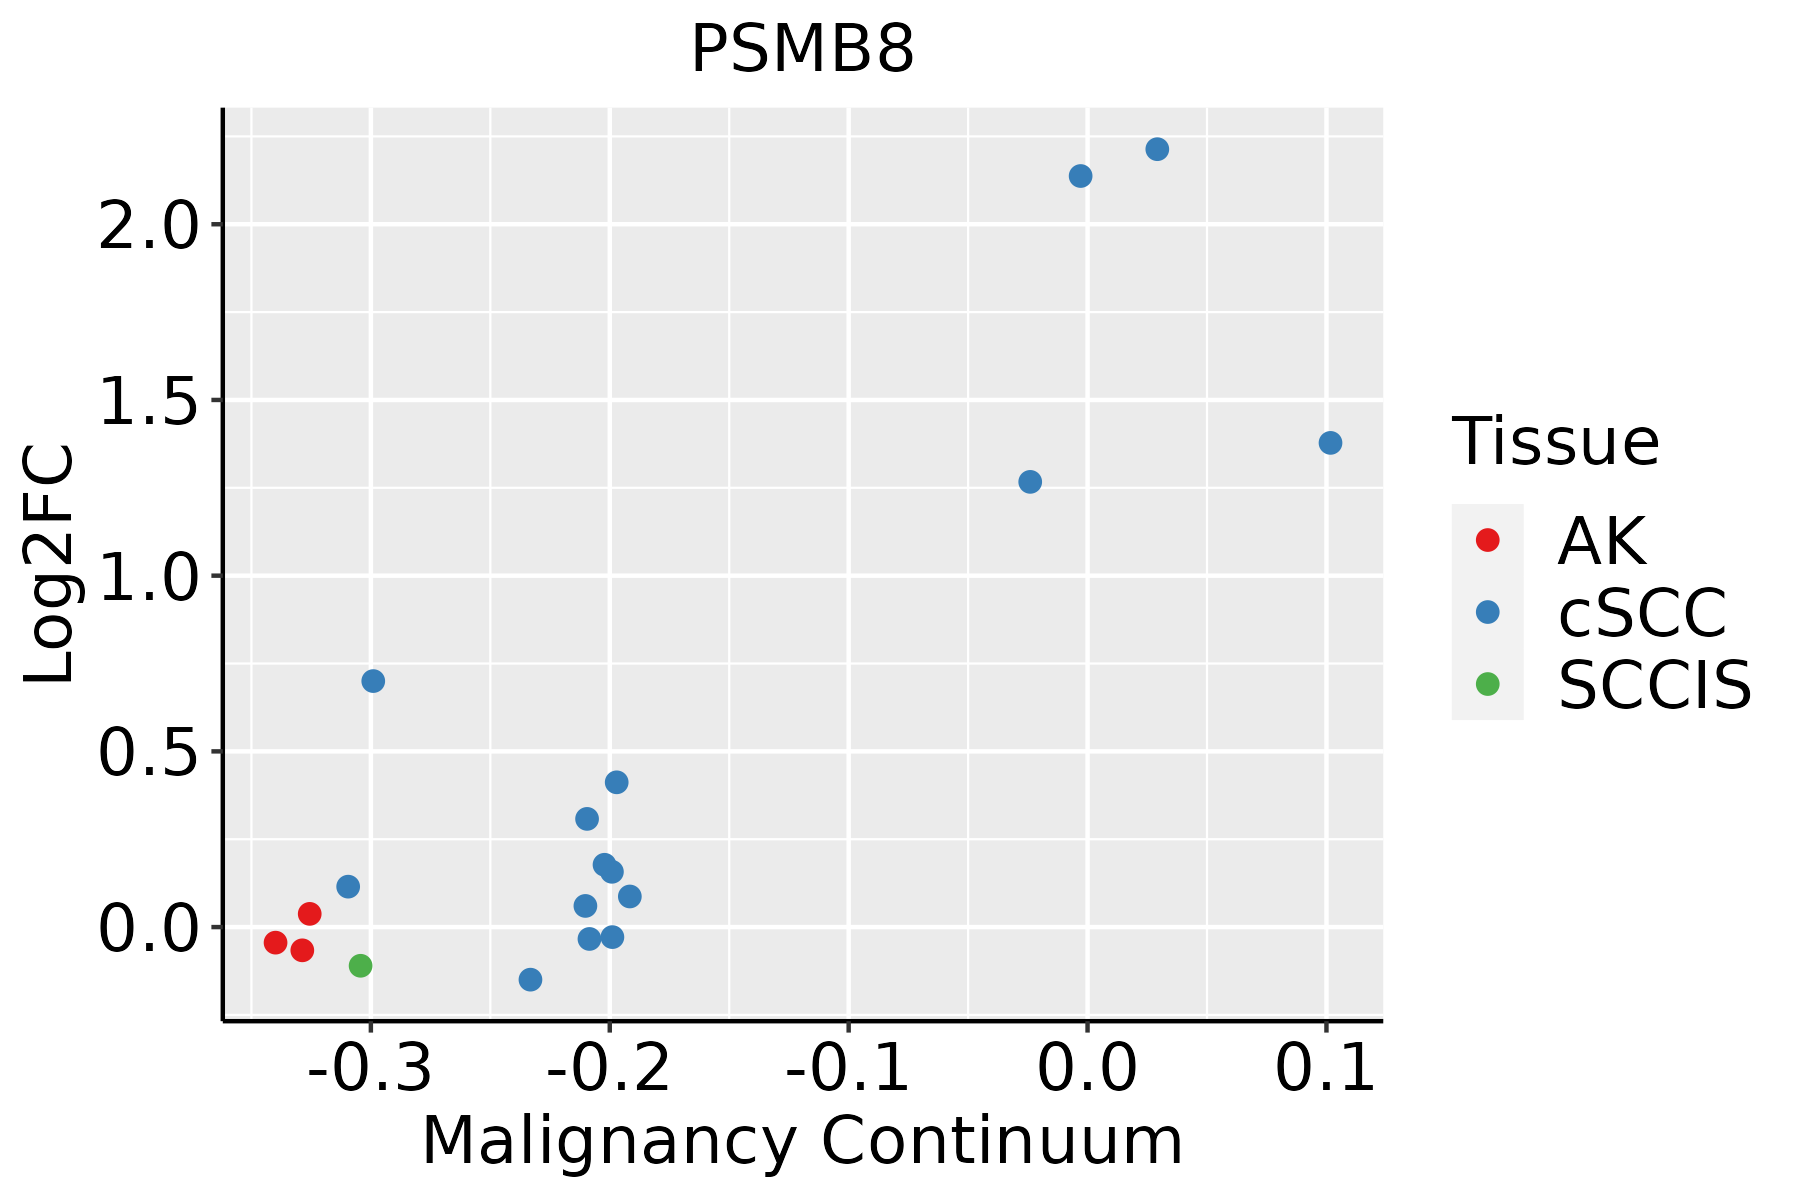 | AK: Actinic keratosis |
| cSCC: Cutaneous squamous cell carcinoma | ||
| SCCIS:squamous cell carcinoma in situ | ||
| Thyroid |  | ATC: Anaplastic thyroid cancer |
| HT: Hashimoto's thyroiditis | ||
| PTC: Papillary thyroid cancer |
| ∗log2FC in expression of this searched gene in stem-like cells from each diseased tissue sample relative to stem-like cells in normal samples in each tissue plotted against the malignancy continuum. Samples are colored based on if they are from different disease stage. |
Top |
Malignant transformation related pathway analysis |
| Find out the enriched GO biological processes and KEGG pathways involved in transition from healthy to precancer to cancer |
| Tissue | Disease Stage | Enriched GO biological Processes |
| Colorectum | AD |  |
| Colorectum | SER |  |
| Colorectum | MSS |  |
| Colorectum | MSI-H |  |
| Colorectum | FAP |  |
| ∗Top 15 enriched GO BP terms are showed in the bar plot of each disease state in each tissue. Each row represents a significant GO biological process which is colored according to the -log10(p.adjust). |
| Page: 1 2 3 4 5 6 7 8 9 |
| GO ID | Tissue | Disease Stage | Description | Gene Ratio | Bg Ratio | pvalue | p.adjust | Count |
| GO:00525479 | Breast | Precancer | regulation of peptidase activity | 71/1080 | 461/18723 | 2.72e-14 | 6.94e-12 | 71 |
| GO:00525489 | Breast | Precancer | regulation of endopeptidase activity | 67/1080 | 432/18723 | 1.06e-13 | 2.36e-11 | 67 |
| GO:00104989 | Breast | Precancer | proteasomal protein catabolic process | 58/1080 | 490/18723 | 1.54e-07 | 8.05e-06 | 58 |
| GO:00454444 | Breast | Precancer | fat cell differentiation | 26/1080 | 229/18723 | 7.60e-04 | 9.04e-03 | 26 |
| GO:005254714 | Breast | IDC | regulation of peptidase activity | 96/1434 | 461/18723 | 7.58e-20 | 6.15e-17 | 96 |
| GO:005254814 | Breast | IDC | regulation of endopeptidase activity | 88/1434 | 432/18723 | 1.20e-17 | 4.85e-15 | 88 |
| GO:001049814 | Breast | IDC | proteasomal protein catabolic process | 75/1434 | 490/18723 | 5.59e-09 | 4.41e-07 | 75 |
| GO:00198829 | Breast | IDC | antigen processing and presentation | 20/1434 | 106/18723 | 1.41e-04 | 2.49e-03 | 20 |
| GO:004544412 | Breast | IDC | fat cell differentiation | 30/1434 | 229/18723 | 2.72e-03 | 2.41e-02 | 30 |
| GO:005254723 | Breast | DCIS | regulation of peptidase activity | 88/1390 | 461/18723 | 1.18e-16 | 4.78e-14 | 88 |
| GO:005254823 | Breast | DCIS | regulation of endopeptidase activity | 83/1390 | 432/18723 | 6.07e-16 | 2.15e-13 | 83 |
| GO:001049824 | Breast | DCIS | proteasomal protein catabolic process | 75/1390 | 490/18723 | 1.44e-09 | 1.40e-07 | 75 |
| GO:001988214 | Breast | DCIS | antigen processing and presentation | 22/1390 | 106/18723 | 8.76e-06 | 2.38e-04 | 22 |
| GO:004544421 | Breast | DCIS | fat cell differentiation | 30/1390 | 229/18723 | 1.70e-03 | 1.68e-02 | 30 |
| GO:0010498 | Colorectum | AD | proteasomal protein catabolic process | 174/3918 | 490/18723 | 3.18e-14 | 7.66e-12 | 174 |
| GO:0052547 | Colorectum | AD | regulation of peptidase activity | 137/3918 | 461/18723 | 4.12e-06 | 1.12e-04 | 137 |
| GO:0052548 | Colorectum | AD | regulation of endopeptidase activity | 124/3918 | 432/18723 | 6.58e-05 | 1.07e-03 | 124 |
| GO:00104981 | Colorectum | SER | proteasomal protein catabolic process | 132/2897 | 490/18723 | 3.08e-11 | 5.55e-09 | 132 |
| GO:00525471 | Colorectum | SER | regulation of peptidase activity | 114/2897 | 461/18723 | 1.18e-07 | 7.17e-06 | 114 |
| GO:00525481 | Colorectum | SER | regulation of endopeptidase activity | 103/2897 | 432/18723 | 2.86e-06 | 1.16e-04 | 103 |
| Page: 1 2 3 4 |
| Pathway ID | Tissue | Disease Stage | Description | Gene Ratio | Bg Ratio | pvalue | p.adjust | qvalue | Count |
| hsa0305023 | Breast | IDC | Proteasome | 26/867 | 46/8465 | 9.89e-15 | 2.47e-13 | 1.85e-13 | 26 |
| hsa0305033 | Breast | IDC | Proteasome | 26/867 | 46/8465 | 9.89e-15 | 2.47e-13 | 1.85e-13 | 26 |
| hsa0305042 | Breast | DCIS | Proteasome | 26/846 | 46/8465 | 5.46e-15 | 1.36e-13 | 9.99e-14 | 26 |
| hsa0305052 | Breast | DCIS | Proteasome | 26/846 | 46/8465 | 5.46e-15 | 1.36e-13 | 9.99e-14 | 26 |
| hsa03050 | Colorectum | AD | Proteasome | 29/2092 | 46/8465 | 3.87e-08 | 6.18e-07 | 3.94e-07 | 29 |
| hsa030501 | Colorectum | AD | Proteasome | 29/2092 | 46/8465 | 3.87e-08 | 6.18e-07 | 3.94e-07 | 29 |
| hsa030502 | Colorectum | SER | Proteasome | 24/1580 | 46/8465 | 3.05e-07 | 5.96e-06 | 4.33e-06 | 24 |
| hsa030503 | Colorectum | SER | Proteasome | 24/1580 | 46/8465 | 3.05e-07 | 5.96e-06 | 4.33e-06 | 24 |
| hsa030504 | Colorectum | MSS | Proteasome | 29/1875 | 46/8465 | 2.72e-09 | 5.69e-08 | 3.48e-08 | 29 |
| hsa030505 | Colorectum | MSS | Proteasome | 29/1875 | 46/8465 | 2.72e-09 | 5.69e-08 | 3.48e-08 | 29 |
| hsa030506 | Colorectum | MSI-H | Proteasome | 23/797 | 46/8465 | 1.86e-12 | 4.64e-11 | 3.89e-11 | 23 |
| hsa030507 | Colorectum | MSI-H | Proteasome | 23/797 | 46/8465 | 1.86e-12 | 4.64e-11 | 3.89e-11 | 23 |
| hsa0305027 | Esophagus | HGIN | Proteasome | 34/1383 | 46/8465 | 6.45e-18 | 1.91e-16 | 1.52e-16 | 34 |
| hsa03050111 | Esophagus | HGIN | Proteasome | 34/1383 | 46/8465 | 6.45e-18 | 1.91e-16 | 1.52e-16 | 34 |
| hsa0305028 | Esophagus | ESCC | Proteasome | 44/4205 | 46/8465 | 1.05e-11 | 1.60e-10 | 8.21e-11 | 44 |
| hsa0305037 | Esophagus | ESCC | Proteasome | 44/4205 | 46/8465 | 1.05e-11 | 1.60e-10 | 8.21e-11 | 44 |
| hsa030509 | Liver | Cirrhotic | Proteasome | 41/2530 | 46/8465 | 6.22e-17 | 2.30e-15 | 1.42e-15 | 41 |
| hsa0305012 | Liver | Cirrhotic | Proteasome | 41/2530 | 46/8465 | 6.22e-17 | 2.30e-15 | 1.42e-15 | 41 |
| hsa0305022 | Liver | HCC | Proteasome | 43/4020 | 46/8465 | 2.62e-11 | 4.61e-10 | 2.56e-10 | 43 |
| hsa0305032 | Liver | HCC | Proteasome | 43/4020 | 46/8465 | 2.62e-11 | 4.61e-10 | 2.56e-10 | 43 |
| Page: 1 2 |
Top |
Cell-cell communication analysis |
| Identification of potential cell-cell interactions between two cell types and their ligand-receptor pairs for different disease states |
| Ligand | Receptor | LRpair | Pathway | Tissue | Disease Stage |
| Page: 1 |
Top |
Single-cell gene regulatory network inference analysis |
| Find out the significant the regulons (TFs) and the target genes of each regulon across cell types for different disease states |
| TF | Cell Type | Tissue | Disease Stage | Target Gene | RSS | Regulon Activity |
| ∗The dot plots of a searched regulon are shown for all cell subpopulations in each disease state of each tissue based on the regulon specific score inferred using pySCENIC and by calculating the average expression. |
| Page: 1 |
Top |
Somatic mutation of malignant transformation related genes |
| Annotation of somatic variants for genes involved in malignant transformation |
| Hugo Symbol | Variant Class | Variant Classification | dbSNP RS | HGVSc | HGVSp | HGVSp Short | SWISSPROT | BIOTYPE | SIFT | PolyPhen | Tumor Sample Barcode | Tissue | Histology | Sex | Age | Stage | Therapy Types | Drugs | Outcome |
| PSMB8 | SNV | Missense_Mutation | rs146956608 | c.646N>T | p.Arg216Trp | p.R216W | P28062 | protein_coding | deleterious(0.03) | possibly_damaging(0.737) | TCGA-A8-A093-01 | Breast | breast invasive carcinoma | Female | <65 | I/II | Hormone Therapy | tamoxiphen | SD |
| PSMB8 | SNV | Missense_Mutation | c.446C>T | p.Ser149Leu | p.S149L | P28062 | protein_coding | deleterious(0) | possibly_damaging(0.59) | TCGA-XX-A89A-01 | Breast | breast invasive carcinoma | Female | >=65 | I/II | Unknown | Unknown | SD | |
| PSMB8 | insertion | Frame_Shift_Ins | novel | c.544_545insA | p.Gly182GlufsTer7 | p.G182Efs*7 | P28062 | protein_coding | TCGA-A7-A0CJ-01 | Breast | breast invasive carcinoma | Female | <65 | I/II | Chemotherapy | cytoxan | SD | ||
| PSMB8 | insertion | In_Frame_Ins | novel | c.543_544insTCTCAAAAGAAAAAAAAGAAAATGATT | p.Pro181_Gly182insSerGlnLysLysLysLysLysMetIle | p.P181_G182insSQKKKKKMI | P28062 | protein_coding | TCGA-A7-A0CJ-01 | Breast | breast invasive carcinoma | Female | <65 | I/II | Chemotherapy | cytoxan | SD | ||
| PSMB8 | SNV | Missense_Mutation | c.172N>A | p.Gly58Ser | p.G58S | P28062 | protein_coding | tolerated(0.43) | benign(0) | TCGA-C5-A1M8-01 | Cervix | cervical & endocervical cancer | Female | <65 | I/II | Unknown | Unknown | SD | |
| PSMB8 | SNV | Missense_Mutation | rs779815259 | c.154G>A | p.Glu52Lys | p.E52K | P28062 | protein_coding | tolerated(0.58) | benign(0.003) | TCGA-DS-A0VK-01 | Cervix | cervical & endocervical cancer | Female | <65 | I/II | Chemotherapy | carboplatin | PD |
| PSMB8 | SNV | Missense_Mutation | novel | c.512N>T | p.Ser171Ile | p.S171I | P28062 | protein_coding | deleterious(0) | benign(0.177) | TCGA-EA-A3HU-01 | Cervix | cervical & endocervical cancer | Female | <65 | I/II | Unknown | Unknown | SD |
| PSMB8 | SNV | Missense_Mutation | c.304C>T | p.Arg102Trp | p.R102W | P28062 | protein_coding | deleterious(0) | possibly_damaging(0.447) | TCGA-JX-A3Q0-01 | Cervix | cervical & endocervical cancer | Female | <65 | III/IV | Unknown | Unknown | SD | |
| PSMB8 | SNV | Missense_Mutation | novel | c.422N>A | p.Arg141Gln | p.R141Q | P28062 | protein_coding | deleterious(0) | possibly_damaging(0.877) | TCGA-AZ-4315-01 | Colorectum | colon adenocarcinoma | Male | <65 | I/II | Unknown | Unknown | SD |
| PSMB8 | SNV | Missense_Mutation | novel | c.73G>T | p.Gly25Trp | p.G25W | P28062 | protein_coding | deleterious(0.04) | benign(0.01) | TCGA-AG-3598-01 | Colorectum | rectum adenocarcinoma | Male | >=65 | I/II | Unknown | Unknown | SD |
| Page: 1 2 3 |
Top |
Related drugs of malignant transformation related genes |
| Identification of chemicals and drugs interact with genes involved in malignant transfromation |
| (DGIdb 4.0) |
| Entrez ID | Symbol | Category | Interaction Types | Drug Claim Name | Drug Name | PMIDs |
| 5696 | PSMB8 | ENZYME, PROTEASE, DRUGGABLE GENOME | inhibitor | CARFILZOMIB | CARFILZOMIB | |
| 5696 | PSMB8 | ENZYME, PROTEASE, DRUGGABLE GENOME | inhibitor | CHEMBL2103884 | OPROZOMIB | |
| 5696 | PSMB8 | ENZYME, PROTEASE, DRUGGABLE GENOME | inhibitor | BORTEZOMIB | BORTEZOMIB | |
| 5696 | PSMB8 | ENZYME, PROTEASE, DRUGGABLE GENOME | inhibitor | 385612170 | KZR-616 | |
| 5696 | PSMB8 | ENZYME, PROTEASE, DRUGGABLE GENOME | BELACTOSIN A | BELACTOSIN A | 23547757 | |
| 5696 | PSMB8 | ENZYME, PROTEASE, DRUGGABLE GENOME | inhibitor | CHEMBL371405 | MARIZOMIB | |
| 5696 | PSMB8 | ENZYME, PROTEASE, DRUGGABLE GENOME | inhibitor | CHEMBL325041 | BORTEZOMIB | |
| 5696 | PSMB8 | ENZYME, PROTEASE, DRUGGABLE GENOME | inhibitor | 252166849 | ||
| 5696 | PSMB8 | ENZYME, PROTEASE, DRUGGABLE GENOME | inhibitor | CHEMBL3545432 | IXAZOMIB CITRATE | |
| 5696 | PSMB8 | ENZYME, PROTEASE, DRUGGABLE GENOME | BORTEZOMIB | BORTEZOMIB | 24524217 |
| Page: 1 2 |

Copyright 2023-Present -The University of Texas Health Science Center at Houston |