
|
|||||
|
 | |
| |
| |
| |
| |
| |
|
Gene: POLR1C |
Gene summary for POLR1C |
| Gene information | Species | Human | Gene symbol | POLR1C | Gene ID | 9533 |
| Gene name | RNA polymerase I and III subunit C | |
| Gene Alias | AC40 | |
| Cytomap | 6p21.1 | |
| Gene Type | protein-coding | GO ID | GO:0006139 | UniProtAcc | O15160 |
Top |
Malignant transformation analysis |
| Identification of the aberrant gene expression in precancerous and cancerous lesions by comparing the gene expression of stem-like cells in diseased tissues with normal stem cells |
| Entrez ID | Symbol | Replicates | Species | Organ | Tissue | Adj P-value | Log2FC | Malignancy |
| 9533 | POLR1C | C43 | Human | Oral cavity | OSCC | 3.57e-03 | 1.23e-01 | 0.1704 |
| 9533 | POLR1C | C46 | Human | Oral cavity | OSCC | 4.56e-22 | 4.76e-01 | 0.1673 |
| 9533 | POLR1C | C51 | Human | Oral cavity | OSCC | 7.84e-08 | 5.16e-01 | 0.2674 |
| 9533 | POLR1C | C57 | Human | Oral cavity | OSCC | 4.85e-03 | 2.40e-01 | 0.1679 |
| 9533 | POLR1C | C08 | Human | Oral cavity | OSCC | 5.68e-07 | 2.95e-01 | 0.1919 |
| 9533 | POLR1C | C09 | Human | Oral cavity | OSCC | 4.76e-03 | 1.79e-01 | 0.1431 |
| 9533 | POLR1C | LN38 | Human | Oral cavity | OSCC | 3.07e-06 | 9.39e-01 | 0.168 |
| 9533 | POLR1C | LN46 | Human | Oral cavity | OSCC | 1.38e-12 | 5.83e-01 | 0.1666 |
| 9533 | POLR1C | LP15 | Human | Oral cavity | LP | 1.18e-02 | 8.91e-01 | 0.2174 |
| 9533 | POLR1C | LP17 | Human | Oral cavity | LP | 6.99e-03 | 5.39e-01 | 0.2349 |
| 9533 | POLR1C | SYSMH3 | Human | Oral cavity | OSCC | 1.06e-06 | 3.57e-01 | 0.2442 |
| 9533 | POLR1C | P4_S8_cSCC | Human | Skin | cSCC | 8.43e-04 | 1.16e-01 | -0.3095 |
| 9533 | POLR1C | P1_cSCC | Human | Skin | cSCC | 8.70e-14 | 5.52e-01 | 0.0292 |
| 9533 | POLR1C | P2_cSCC | Human | Skin | cSCC | 1.49e-07 | 3.37e-01 | -0.024 |
| 9533 | POLR1C | P4_cSCC | Human | Skin | cSCC | 8.39e-07 | 4.06e-01 | -0.00290000000000005 |
| 9533 | POLR1C | P10_cSCC | Human | Skin | cSCC | 5.73e-10 | 4.21e-01 | 0.1017 |
| 9533 | POLR1C | male-WTA | Human | Thyroid | PTC | 1.27e-08 | -1.34e-02 | 0.1037 |
| 9533 | POLR1C | PTC01 | Human | Thyroid | PTC | 1.85e-09 | 4.27e-02 | 0.1899 |
| 9533 | POLR1C | PTC04 | Human | Thyroid | PTC | 2.26e-02 | -3.16e-02 | 0.1927 |
| 9533 | POLR1C | PTC05 | Human | Thyroid | PTC | 2.48e-05 | 1.60e-01 | 0.2065 |
| Page: 1 2 3 4 5 6 |
| Tissue | Expression Dynamics | Abbreviation |
| Esophagus | 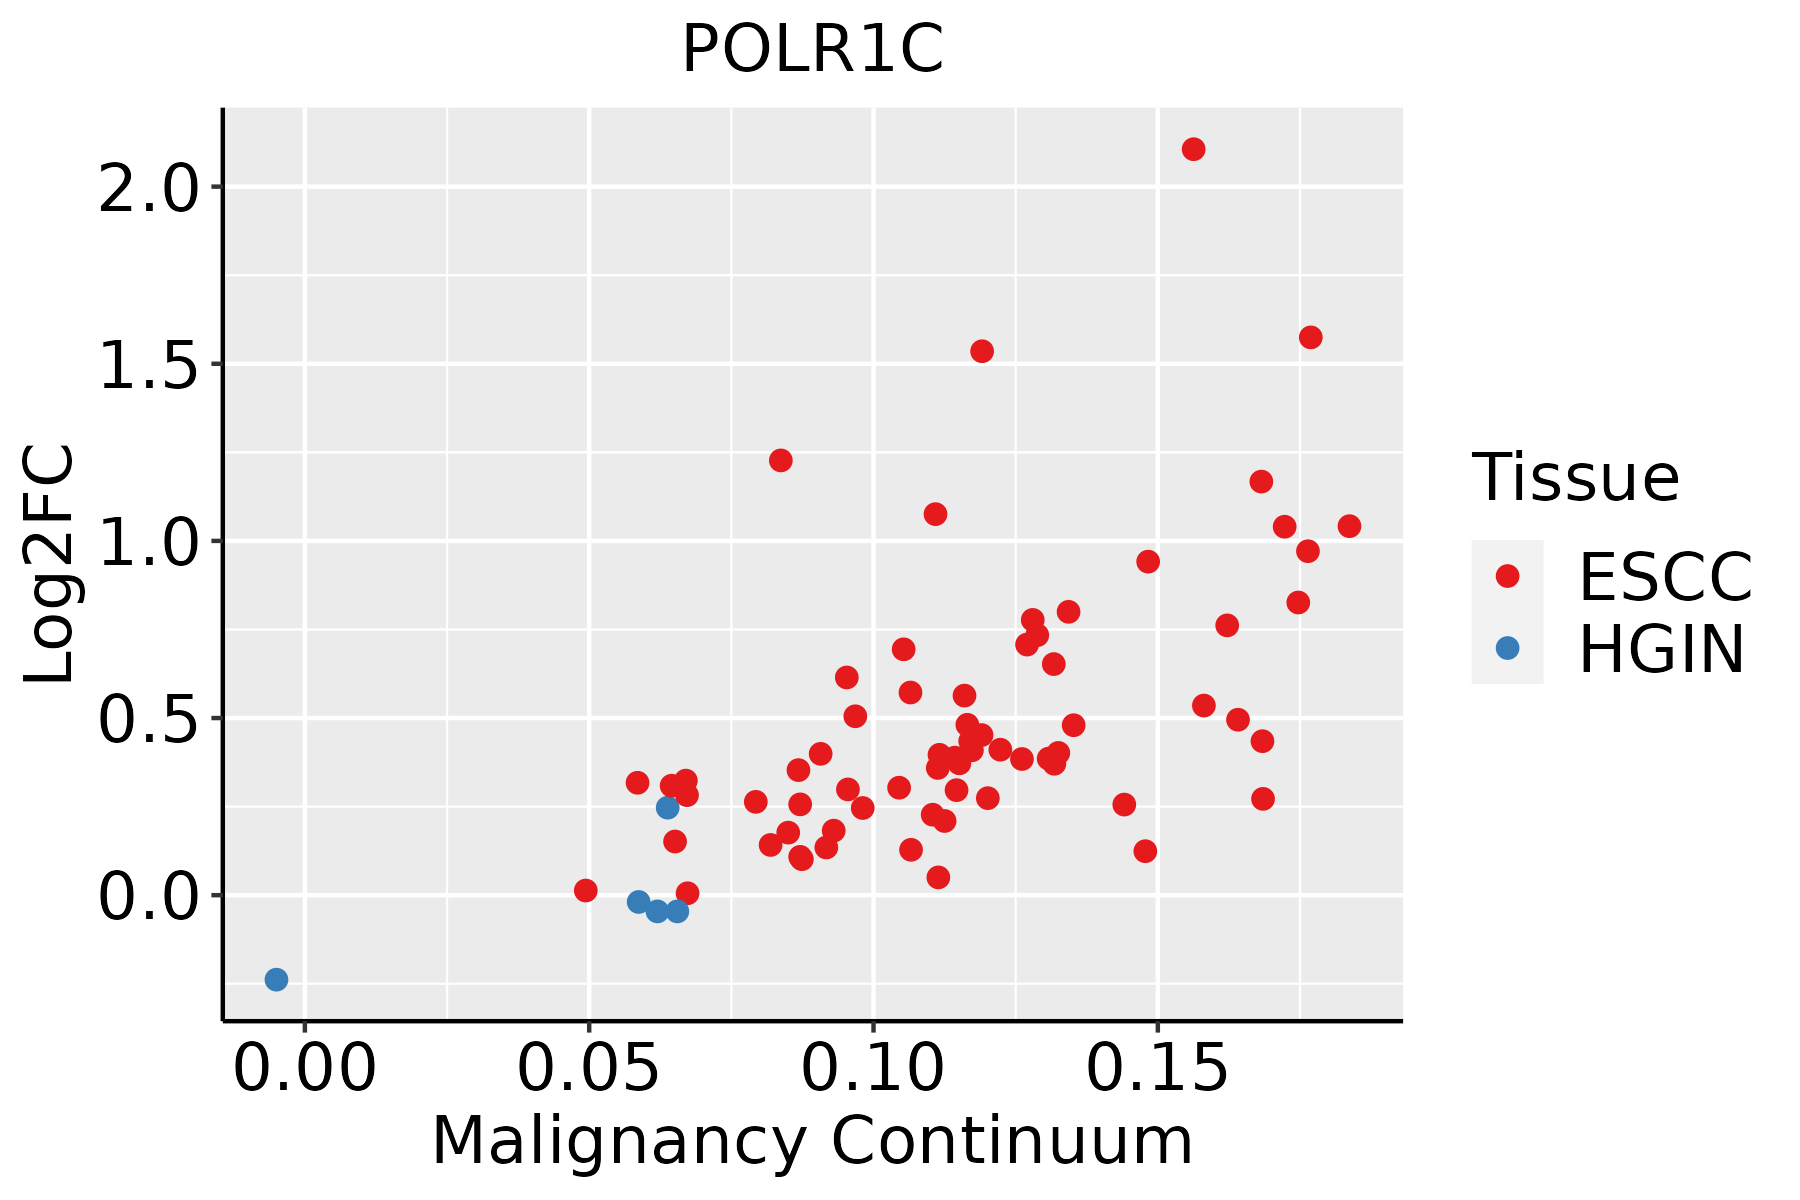 | ESCC: Esophageal squamous cell carcinoma |
| HGIN: High-grade intraepithelial neoplasias | ||
| LGIN: Low-grade intraepithelial neoplasias | ||
| Liver | 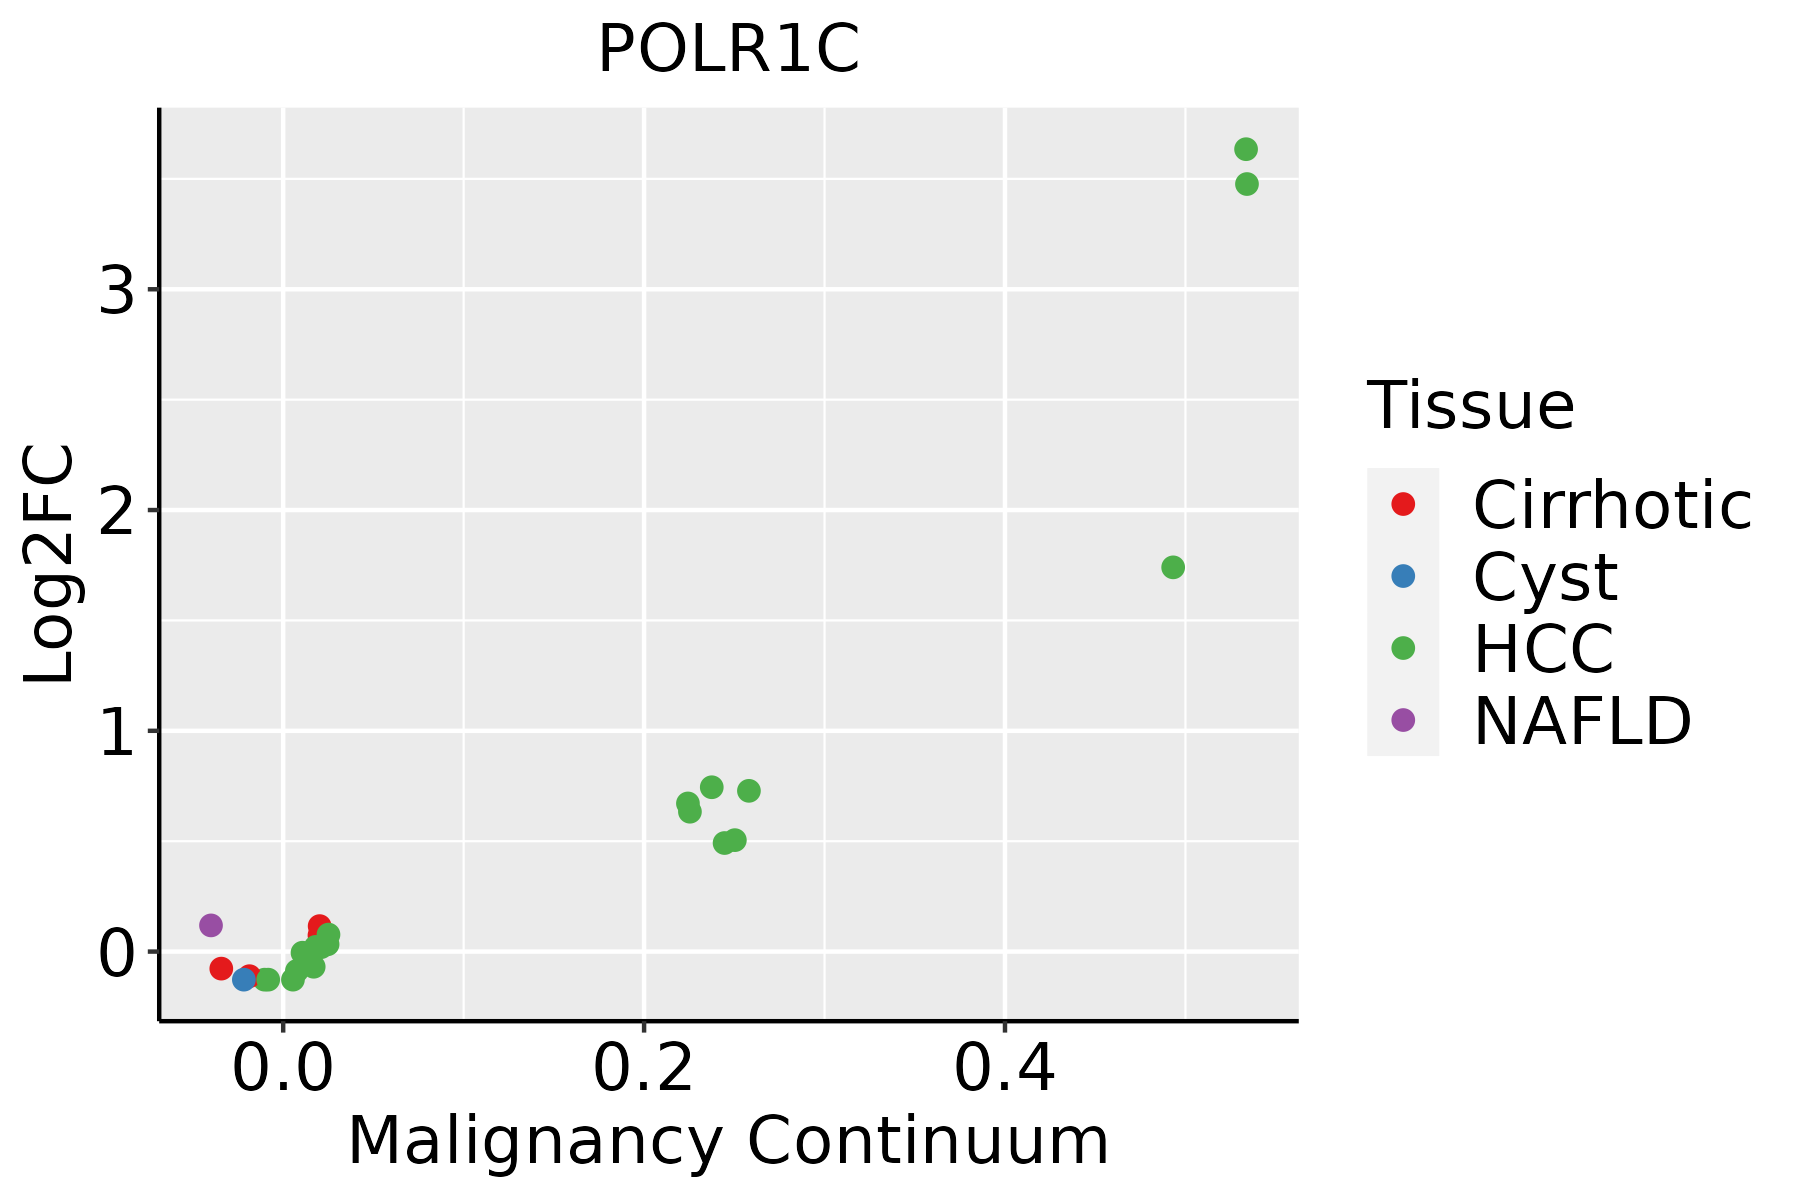 | HCC: Hepatocellular carcinoma |
| NAFLD: Non-alcoholic fatty liver disease | ||
| Oral Cavity | 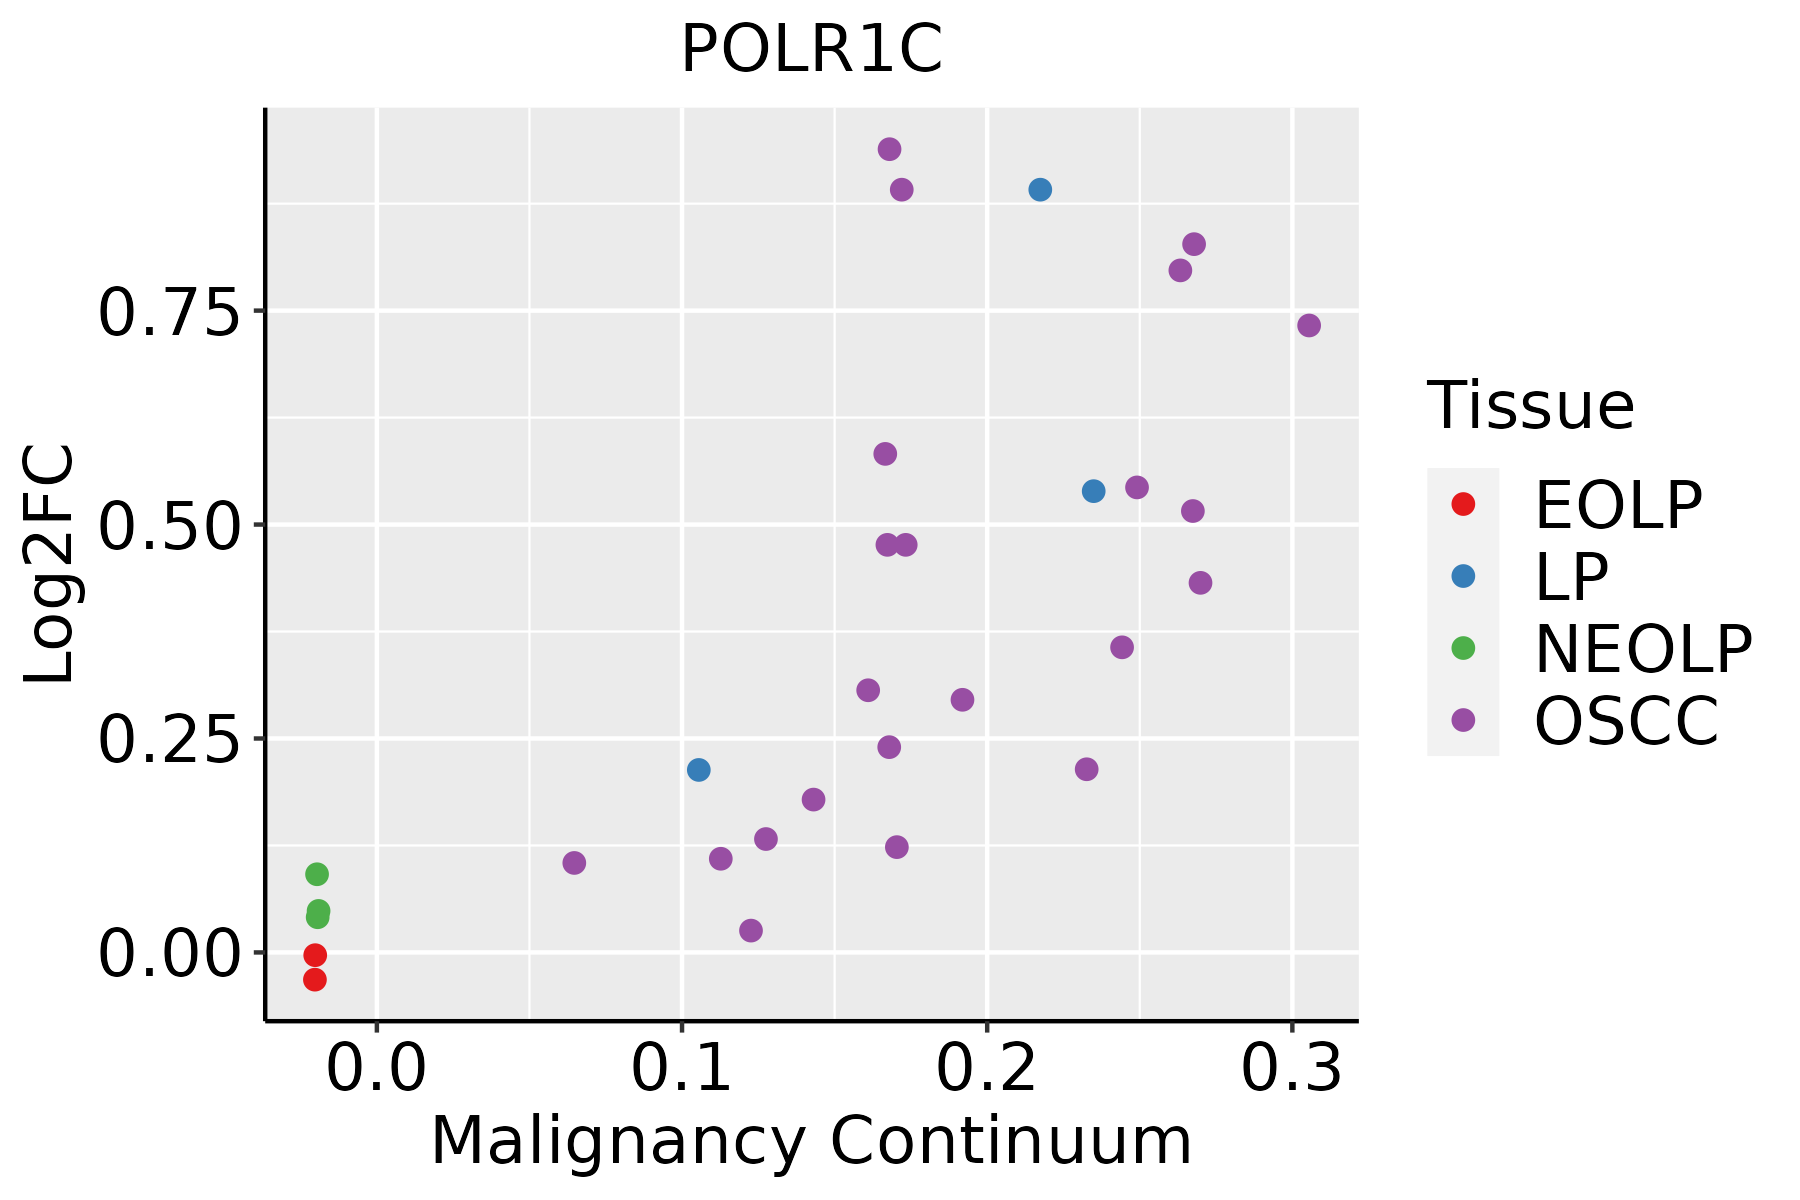 | EOLP: Erosive Oral lichen planus |
| LP: leukoplakia | ||
| NEOLP: Non-erosive oral lichen planus | ||
| OSCC: Oral squamous cell carcinoma | ||
| Skin | 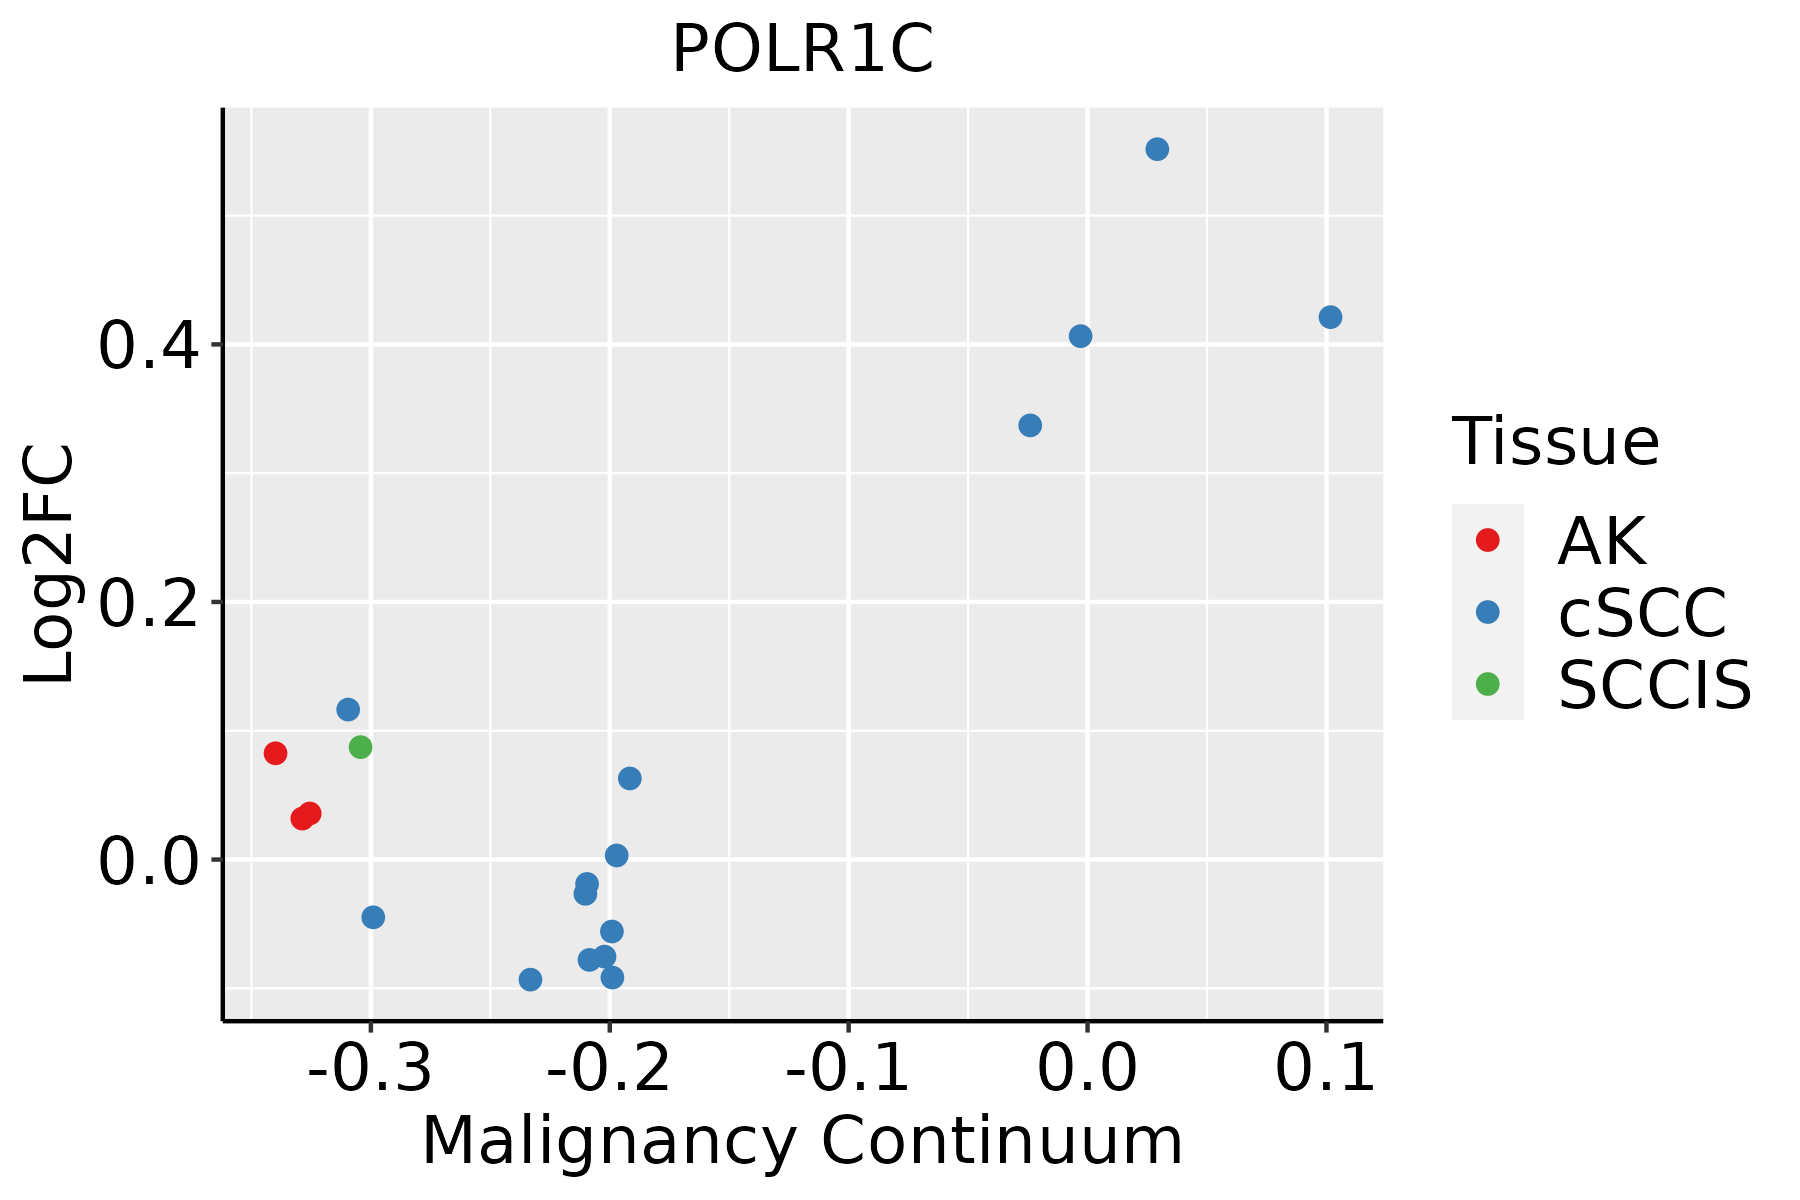 | AK: Actinic keratosis |
| cSCC: Cutaneous squamous cell carcinoma | ||
| SCCIS:squamous cell carcinoma in situ | ||
| Thyroid | 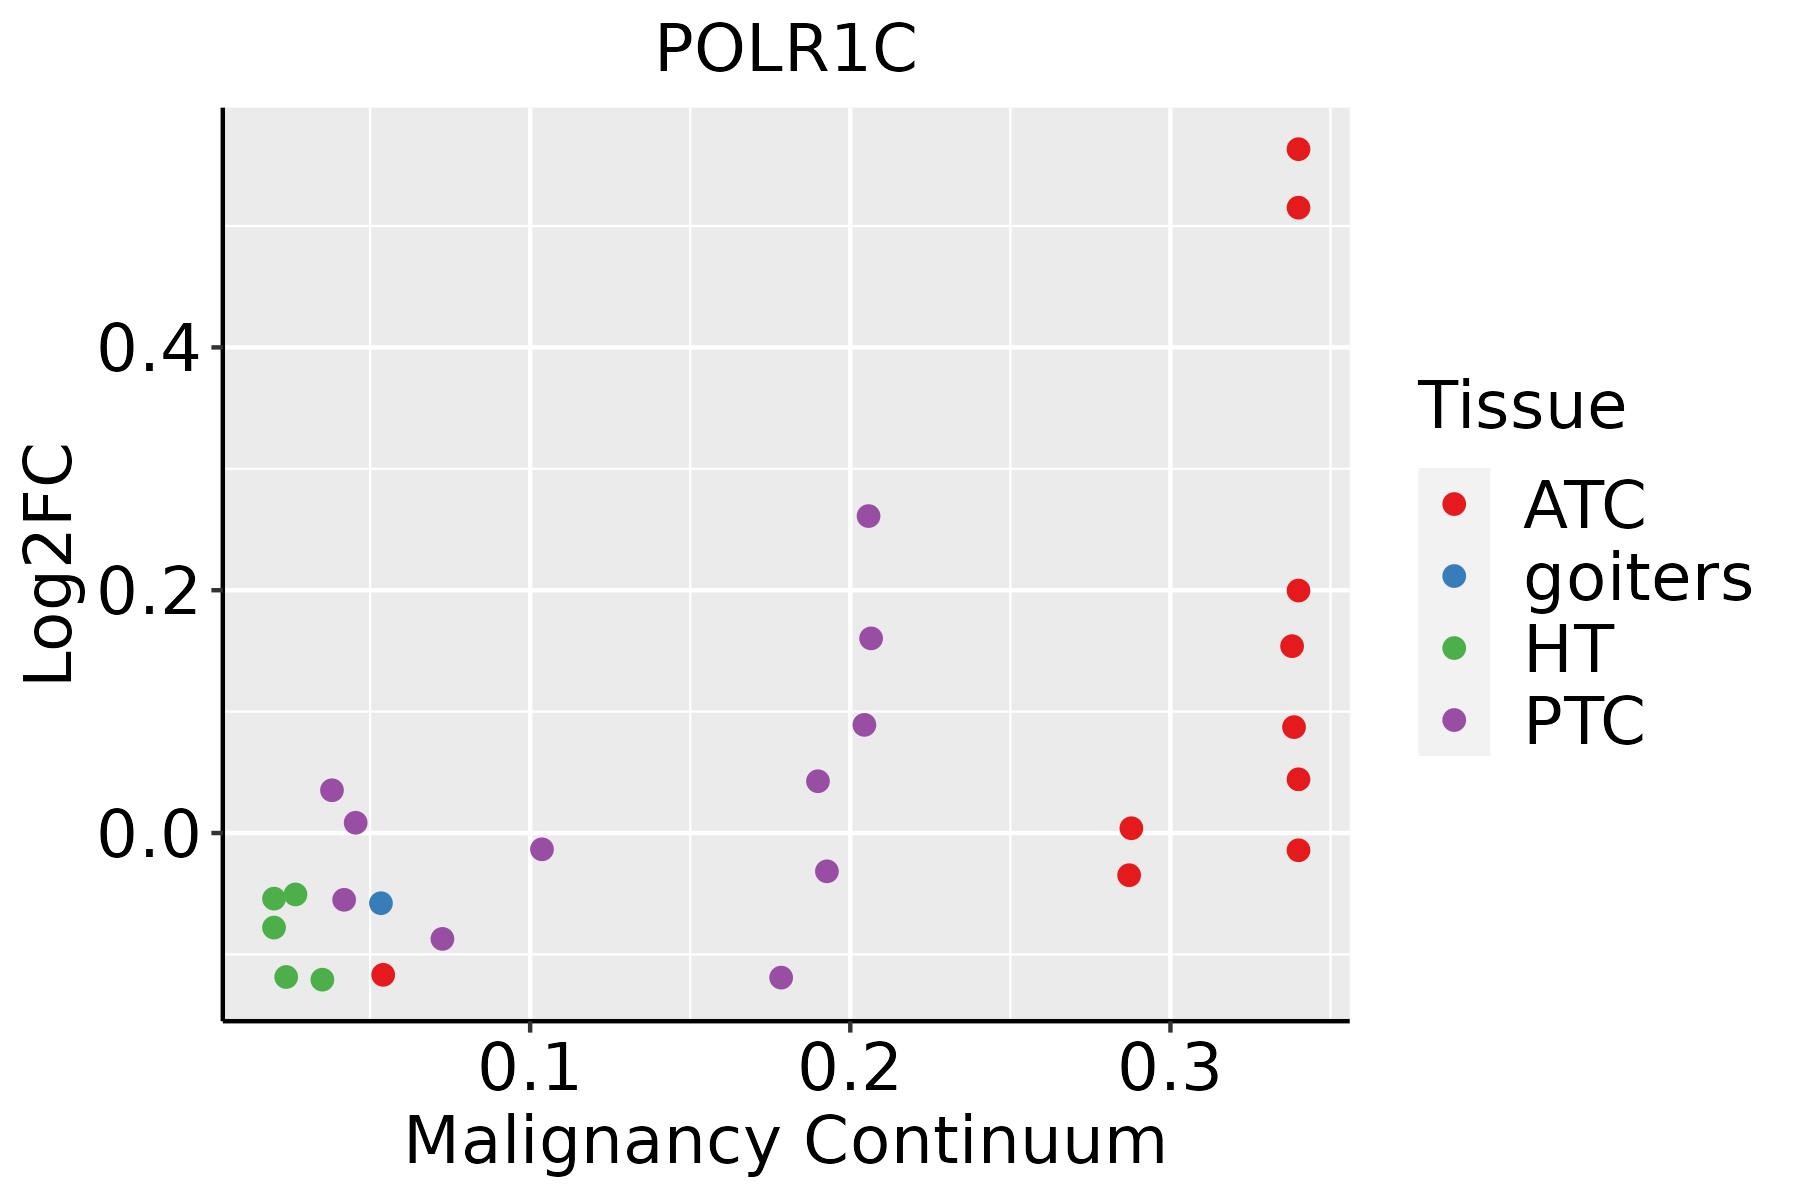 | ATC: Anaplastic thyroid cancer |
| HT: Hashimoto's thyroiditis | ||
| PTC: Papillary thyroid cancer |
| ∗log2FC in expression of this searched gene in stem-like cells from each diseased tissue sample relative to stem-like cells in normal samples in each tissue plotted against the malignancy continuum. Samples are colored based on if they are from different disease stage. |
Top |
Malignant transformation related pathway analysis |
| Find out the enriched GO biological processes and KEGG pathways involved in transition from healthy to precancer to cancer |
| Tissue | Disease Stage | Enriched GO biological Processes |
| Colorectum | AD |  |
| Colorectum | SER |  |
| Colorectum | MSS |  |
| Colorectum | MSI-H |  |
| Colorectum | FAP |  |
| ∗Top 15 enriched GO BP terms are showed in the bar plot of each disease state in each tissue. Each row represents a significant GO biological process which is colored according to the -log10(p.adjust). |
| Page: 1 2 3 4 5 6 7 8 9 |
| GO ID | Tissue | Disease Stage | Description | Gene Ratio | Bg Ratio | pvalue | p.adjust | Count |
| GO:00063833 | Esophagus | ESCC | transcription by RNA polymerase III | 41/8552 | 46/18723 | 7.69e-10 | 1.90e-08 | 41 |
| GO:00063602 | Esophagus | ESCC | transcription by RNA polymerase I | 42/8552 | 55/18723 | 3.41e-06 | 3.78e-05 | 42 |
| GO:0006360 | Liver | HCC | transcription by RNA polymerase I | 36/7958 | 55/18723 | 4.94e-04 | 3.23e-03 | 36 |
| GO:0006383 | Liver | HCC | transcription by RNA polymerase III | 31/7958 | 46/18723 | 5.67e-04 | 3.61e-03 | 31 |
| GO:00063832 | Oral cavity | OSCC | transcription by RNA polymerase III | 34/7305 | 46/18723 | 1.61e-06 | 2.11e-05 | 34 |
| GO:00063601 | Oral cavity | OSCC | transcription by RNA polymerase I | 36/7305 | 55/18723 | 6.42e-05 | 5.22e-04 | 36 |
| GO:00063831 | Oral cavity | LP | transcription by RNA polymerase III | 20/4623 | 46/18723 | 4.03e-03 | 2.61e-02 | 20 |
| GO:00063603 | Skin | cSCC | transcription by RNA polymerase I | 30/4864 | 55/18723 | 6.13e-06 | 8.70e-05 | 30 |
| GO:00063834 | Skin | cSCC | transcription by RNA polymerase III | 20/4864 | 46/18723 | 7.44e-03 | 3.50e-02 | 20 |
| GO:00063604 | Thyroid | PTC | transcription by RNA polymerase I | 28/5968 | 55/18723 | 2.55e-03 | 1.31e-02 | 28 |
| GO:00063835 | Thyroid | PTC | transcription by RNA polymerase III | 23/5968 | 46/18723 | 7.89e-03 | 3.33e-02 | 23 |
| GO:000636011 | Thyroid | ATC | transcription by RNA polymerase I | 28/6293 | 55/18723 | 5.94e-03 | 2.39e-02 | 28 |
| Page: 1 |
| Pathway ID | Tissue | Disease Stage | Description | Gene Ratio | Bg Ratio | pvalue | p.adjust | qvalue | Count |
| hsa046234 | Esophagus | ESCC | Cytosolic DNA-sensing pathway | 49/4205 | 75/8465 | 4.35e-03 | 1.12e-02 | 5.74e-03 | 49 |
| hsa0462311 | Esophagus | ESCC | Cytosolic DNA-sensing pathway | 49/4205 | 75/8465 | 4.35e-03 | 1.12e-02 | 5.74e-03 | 49 |
| hsa03020 | Liver | HCC | RNA polymerase | 24/4020 | 34/8465 | 5.40e-03 | 1.57e-02 | 8.75e-03 | 24 |
| hsa030201 | Liver | HCC | RNA polymerase | 24/4020 | 34/8465 | 5.40e-03 | 1.57e-02 | 8.75e-03 | 24 |
| hsa04623 | Oral cavity | OSCC | Cytosolic DNA-sensing pathway | 44/3704 | 75/8465 | 6.44e-03 | 1.51e-02 | 7.68e-03 | 44 |
| hsa046231 | Oral cavity | OSCC | Cytosolic DNA-sensing pathway | 44/3704 | 75/8465 | 6.44e-03 | 1.51e-02 | 7.68e-03 | 44 |
| hsa046232 | Oral cavity | LP | Cytosolic DNA-sensing pathway | 31/2418 | 75/8465 | 1.17e-02 | 3.91e-02 | 2.52e-02 | 31 |
| hsa046233 | Oral cavity | LP | Cytosolic DNA-sensing pathway | 31/2418 | 75/8465 | 1.17e-02 | 3.91e-02 | 2.52e-02 | 31 |
| Page: 1 |
Top |
Cell-cell communication analysis |
| Identification of potential cell-cell interactions between two cell types and their ligand-receptor pairs for different disease states |
| Ligand | Receptor | LRpair | Pathway | Tissue | Disease Stage |
| Page: 1 |
Top |
Single-cell gene regulatory network inference analysis |
| Find out the significant the regulons (TFs) and the target genes of each regulon across cell types for different disease states |
| TF | Cell Type | Tissue | Disease Stage | Target Gene | RSS | Regulon Activity |
| ∗The dot plots of a searched regulon are shown for all cell subpopulations in each disease state of each tissue based on the regulon specific score inferred using pySCENIC and by calculating the average expression. |
| Page: 1 |
Top |
Somatic mutation of malignant transformation related genes |
| Annotation of somatic variants for genes involved in malignant transformation |
| Hugo Symbol | Variant Class | Variant Classification | dbSNP RS | HGVSc | HGVSp | HGVSp Short | SWISSPROT | BIOTYPE | SIFT | PolyPhen | Tumor Sample Barcode | Tissue | Histology | Sex | Age | Stage | Therapy Types | Drugs | Outcome |
| POLR1C | SNV | Missense_Mutation | rs745593101 | c.68A>G | p.Asn23Ser | p.N23S | O15160 | protein_coding | tolerated(0.06) | benign(0.357) | TCGA-A2-A0CP-01 | Breast | breast invasive carcinoma | Female | <65 | I/II | Chemotherapy | cytoxan | SD |
| POLR1C | SNV | Missense_Mutation | novel | c.20N>C | p.Val7Ala | p.V7A | O15160 | protein_coding | tolerated(0.16) | benign(0.039) | TCGA-D8-A1XQ-01 | Breast | breast invasive carcinoma | Female | >=65 | I/II | Unknown | Unknown | SD |
| POLR1C | insertion | Nonsense_Mutation | novel | c.521_522insTGTGCCGGGCCAGGAGGGGGTTTTTTAATCA | p.Trp175ValfsTer9 | p.W175Vfs*9 | O15160 | protein_coding | TCGA-A7-A0CJ-01 | Breast | breast invasive carcinoma | Female | <65 | I/II | Chemotherapy | cytoxan | SD | ||
| POLR1C | SNV | Missense_Mutation | rs753326212 | c.359N>A | p.Arg120His | p.R120H | O15160 | protein_coding | deleterious(0) | probably_damaging(0.999) | TCGA-DS-A1OD-01 | Cervix | cervical & endocervical cancer | Female | <65 | I/II | Chemotherapy | cisplatin | SD |
| POLR1C | SNV | Missense_Mutation | rs777698504 | c.1004N>A | p.Arg335His | p.R335H | O15160 | protein_coding | tolerated(0.13) | benign(0.003) | TCGA-EK-A2R7-01 | Cervix | cervical & endocervical cancer | Female | <65 | I/II | Unknown | Unknown | SD |
| POLR1C | SNV | Missense_Mutation | c.190N>C | p.Asp64His | p.D64H | O15160 | protein_coding | deleterious(0) | probably_damaging(0.998) | TCGA-EK-A3GK-01 | Cervix | cervical & endocervical cancer | Female | <65 | I/II | Unknown | Unknown | SD | |
| POLR1C | SNV | Missense_Mutation | c.695N>T | p.Ser232Ile | p.S232I | O15160 | protein_coding | deleterious(0.02) | probably_damaging(0.969) | TCGA-Q1-A73R-01 | Cervix | cervical & endocervical cancer | Female | <65 | I/II | Unknown | Unknown | SD | |
| POLR1C | SNV | Missense_Mutation | c.640N>C | p.Cys214Arg | p.C214R | O15160 | protein_coding | deleterious(0) | probably_damaging(0.925) | TCGA-G4-6586-01 | Colorectum | colon adenocarcinoma | Female | >=65 | I/II | Unknown | Unknown | SD | |
| POLR1C | SNV | Missense_Mutation | c.685N>A | p.Ala229Thr | p.A229T | O15160 | protein_coding | deleterious(0.02) | probably_damaging(0.955) | TCGA-G4-6586-01 | Colorectum | colon adenocarcinoma | Female | >=65 | I/II | Unknown | Unknown | SD | |
| POLR1C | SNV | Missense_Mutation | novel | c.797N>T | p.Glu266Val | p.E266V | O15160 | protein_coding | tolerated(0.06) | benign(0.424) | TCGA-A5-A1OF-01 | Endometrium | uterine corpus endometrioid carcinoma | Female | <65 | I/II | Unknown | Unknown | SD |
| Page: 1 2 3 |
Top |
Related drugs of malignant transformation related genes |
| Identification of chemicals and drugs interact with genes involved in malignant transfromation |
| (DGIdb 4.0) |
| Entrez ID | Symbol | Category | Interaction Types | Drug Claim Name | Drug Name | PMIDs |
| Page: 1 |

Copyright 2023-Present -The University of Texas Health Science Center at Houston |