Schematic overview of the cellular and molecular mechanisms involved in the cancer progression, including the proposed cellular and molecular mechanisms in cancer cells trajectory. AT1: alveolar type 1 cells; AT2: alveolar type 2 cells; AAH: atypical adenomatous hyperplasia; AIS: adenocarcinoma in situ; MIA: minimally invasive adenocarcinoma; IA: invasive adenocarcinoma; EMT: epithelial-mesenchymal transition

Home

Download

Statistics

Help

Contact

Center for Computational Systems Medicine
leaf

Gene summary

leaf

Malignant transformation analysis

leaf

Malignant transformation related pathway analysis

leaf

Cell-cell communication analysis

leaf

Single-cell gene regulatory network inference analysis

leaf

Somatic mutation of malignant transformation related genes

leaf

Related drugs of malignant transformation related genes

Gene: PNPLA4

Gene summary for PNPLA4

check button Gene summary.

Gene informationSpeciesHuman
Gene symbol

PNPLA4

Gene ID

8228

Gene namepatatin like phospholipase domain containing 4
Gene AliasDXS1283E
CytomapXp22.31
Gene Typeprotein-coding
GO ID

GO:0001523

UniProtAcc

A0A024RBU8


Top

Malignant transformation analysis

check button Identification of the aberrant gene expression in precancerous and cancerous lesions by comparing the gene expression of stem-like cells in diseased tissues with normal stem cells
check button Malignant transformation involving gene list.
Entrez IDSymbolReplicatesSpeciesOrganTissueAdj P-valueLog2FCMalignancy
8228PNPLA4LP15HumanOral cavityLP4.22e-172.10e+000.2174
8228PNPLA4LP17HumanOral cavityLP5.85e-034.28e-010.2349
8228PNPLA4SYSMH1HumanOral cavityOSCC4.81e-052.36e-010.1127
8228PNPLA4SYSMH2HumanOral cavityOSCC2.42e-215.42e-010.2326
8228PNPLA4SYSMH3HumanOral cavityOSCC3.55e-236.12e-010.2442
8228PNPLA4SYSMH6HumanOral cavityOSCC4.01e-083.99e-010.1275
8228PNPLA4P4_S8_cSCCHumanSkincSCC3.20e-061.46e-01-0.3095
8228PNPLA4P1_cSCCHumanSkincSCC5.12e-206.88e-010.0292
8228PNPLA4P2_cSCCHumanSkincSCC1.86e-062.97e-01-0.024
8228PNPLA4P4_cSCCHumanSkincSCC5.56e-216.00e-01-0.00290000000000005
8228PNPLA4P10_cSCCHumanSkincSCC9.43e-114.62e-010.1017
Page: 1 2 3 4 5 

check button Transcriptomic changes along malignancy continuum.
TissueExpression DynamicsAbbreviation
EsophagusThe image shows the transcriptomic changes along malignancy continuum.log2FC in expression of this searched gene in stem-like cells from each diseased tissue sample relative to stem-like cells in normal samples in each tissue plotted against the malignancy continuum. Samples are colored based on if they are from different disease stage.ESCC: Esophageal squamous cell carcinoma
HGIN: High-grade intraepithelial neoplasias
LGIN: Low-grade intraepithelial neoplasias
LiverThe image shows the transcriptomic changes along malignancy continuum.log2FC in expression of this searched gene in stem-like cells from each diseased tissue sample relative to stem-like cells in normal samples in each tissue plotted against the malignancy continuum. Samples are colored based on if they are from different disease stage.
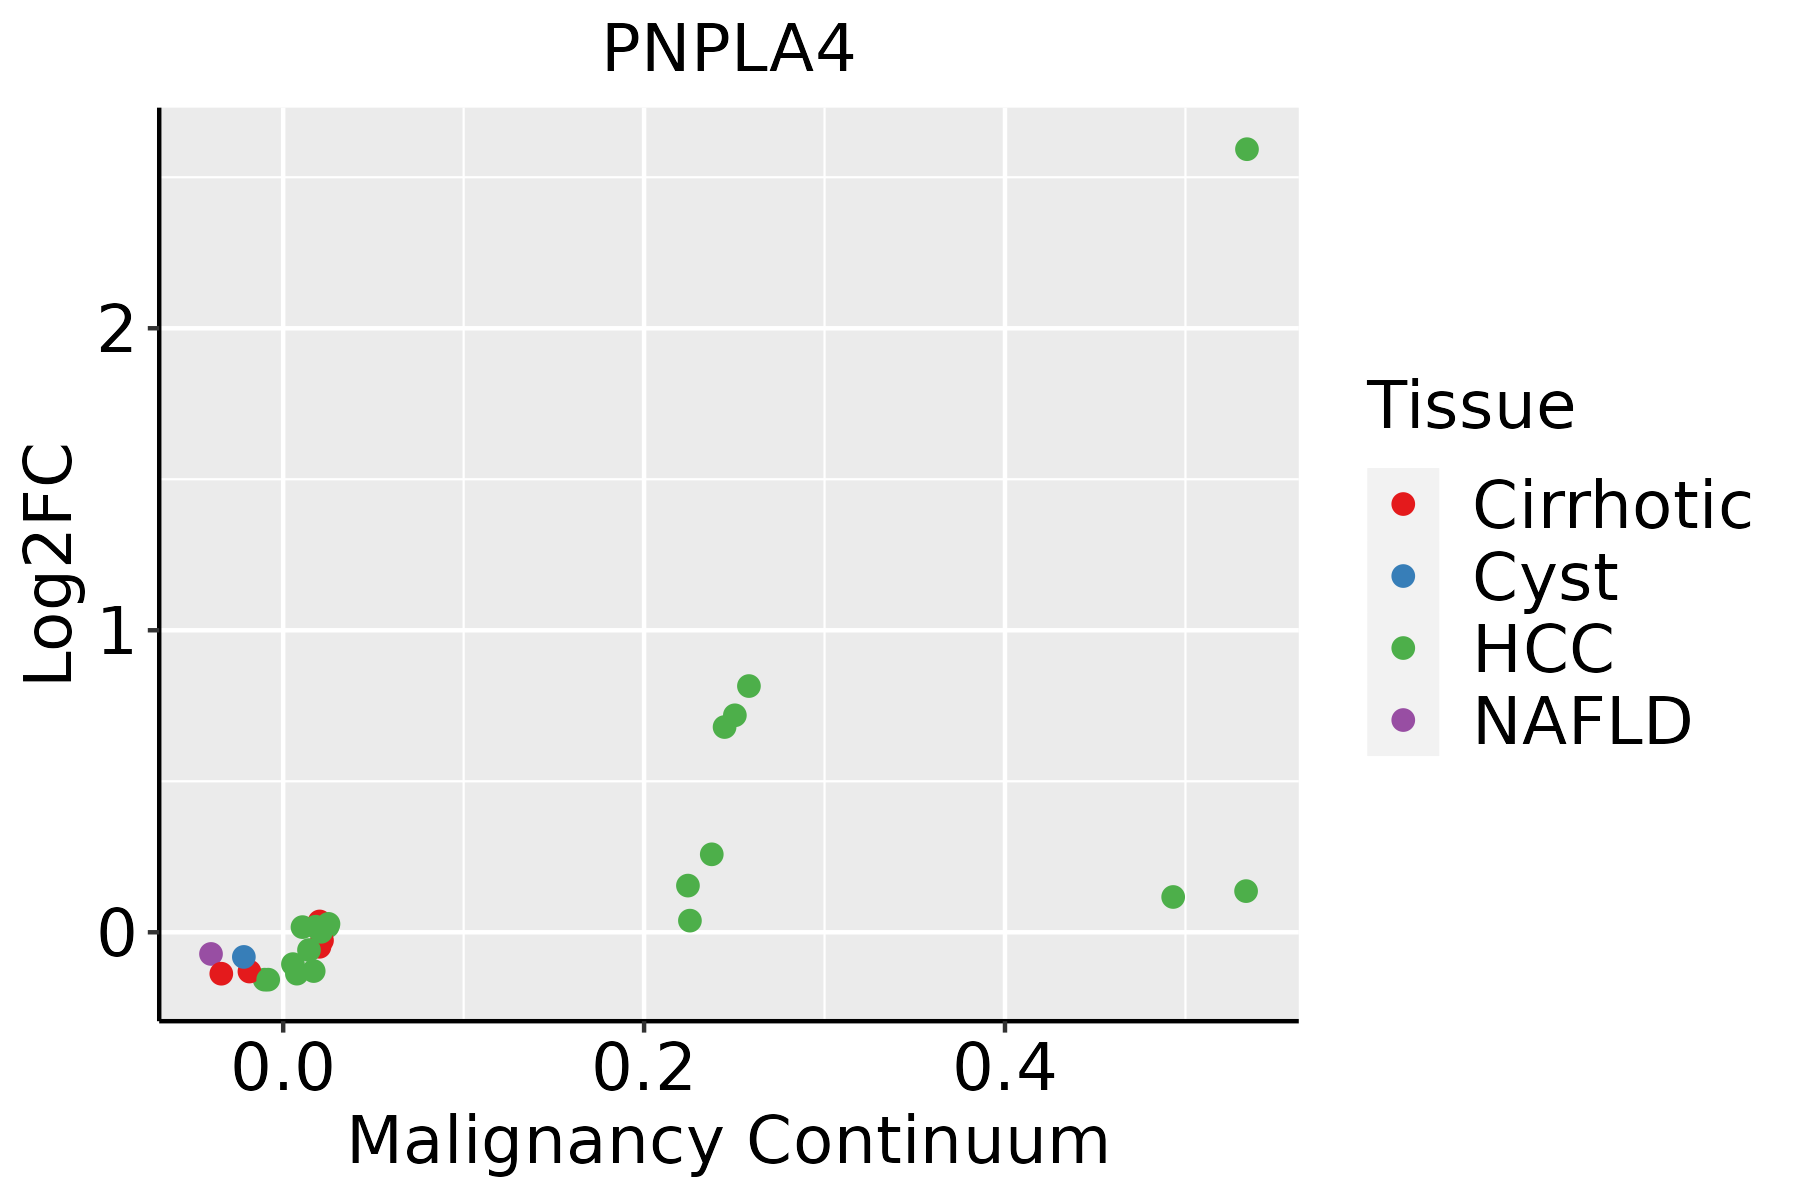
HCC: Hepatocellular carcinoma
NAFLD: Non-alcoholic fatty liver disease
Oral CavityThe image shows the transcriptomic changes along malignancy continuum.log2FC in expression of this searched gene in stem-like cells from each diseased tissue sample relative to stem-like cells in normal samples in each tissue plotted against the malignancy continuum. Samples are colored based on if they are from different disease stage.
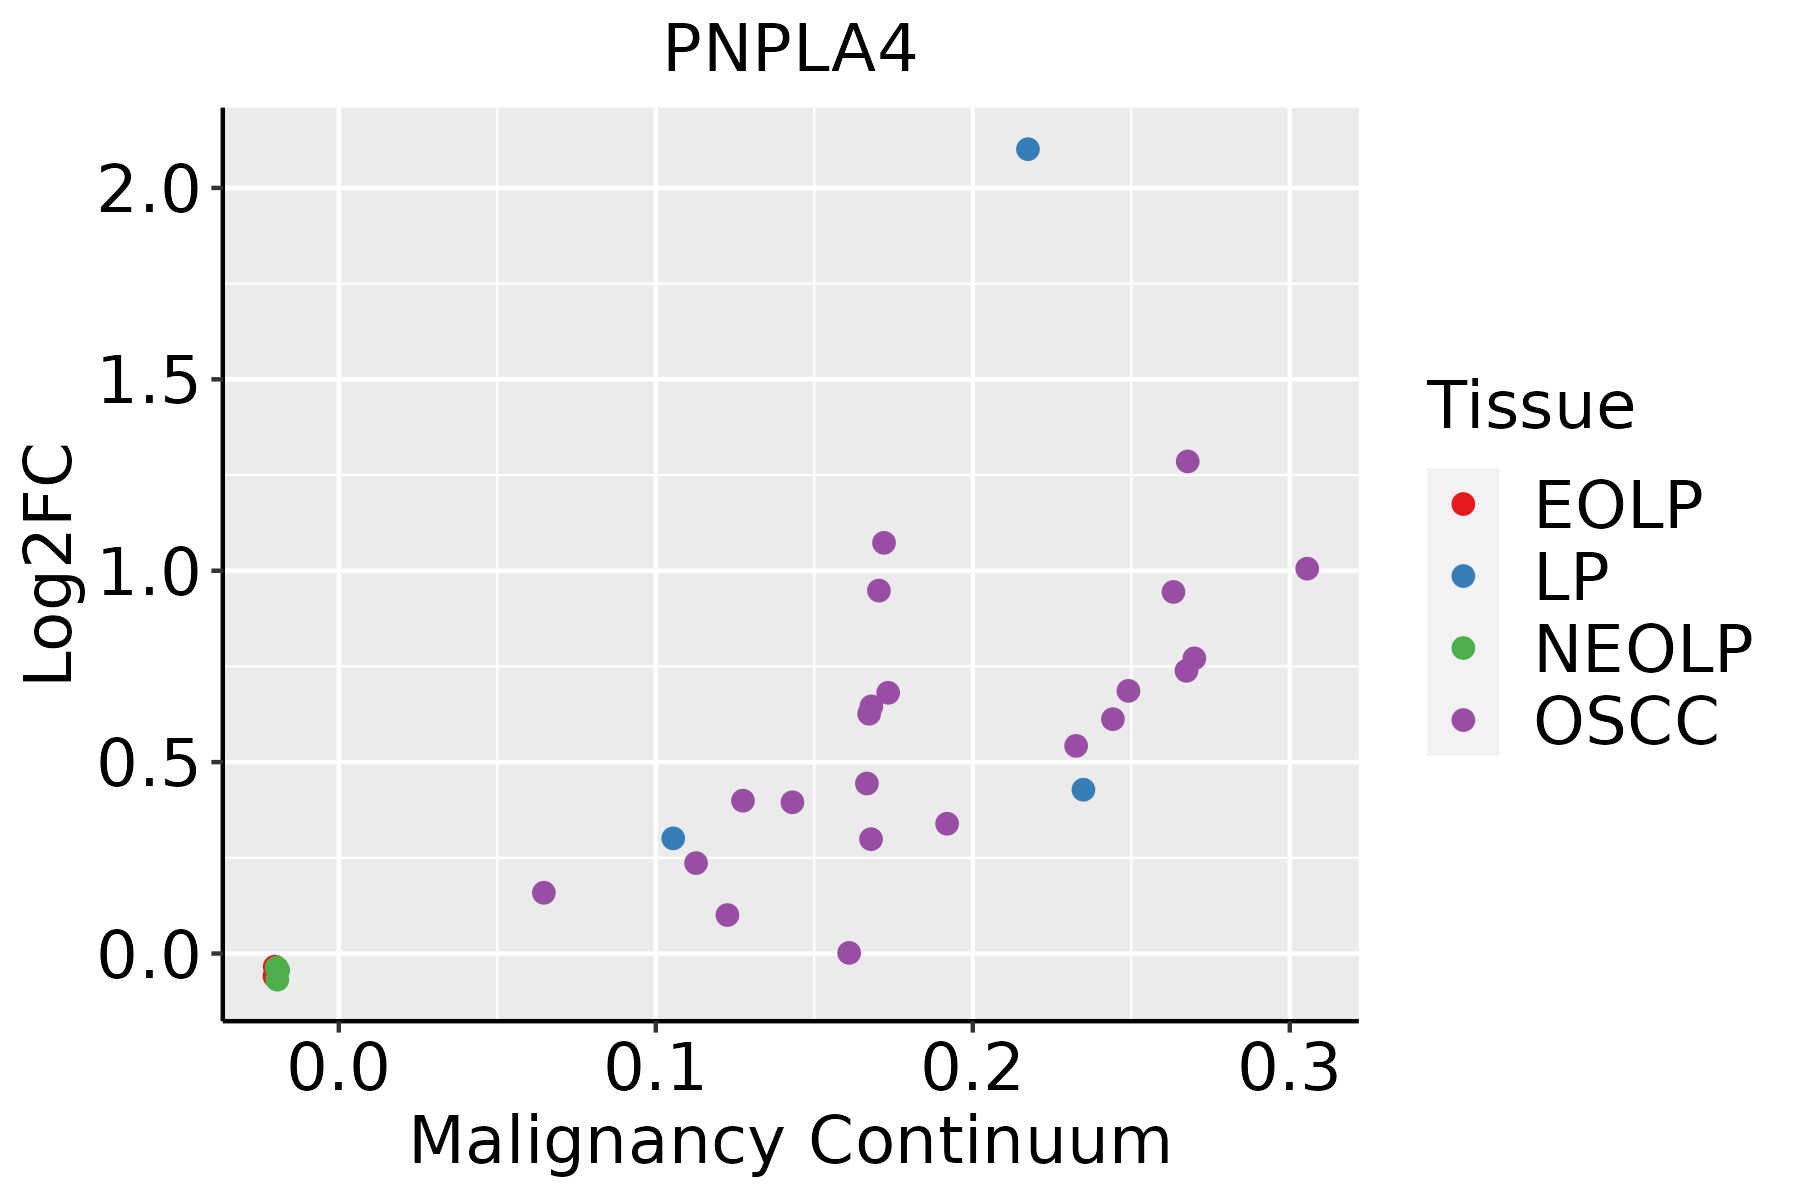
EOLP: Erosive Oral lichen planus
LP: leukoplakia
NEOLP: Non-erosive oral lichen planus
OSCC: Oral squamous cell carcinoma
SkinThe image shows the transcriptomic changes along malignancy continuum.log2FC in expression of this searched gene in stem-like cells from each diseased tissue sample relative to stem-like cells in normal samples in each tissue plotted against the malignancy continuum. Samples are colored based on if they are from different disease stage.AK: Actinic keratosis
cSCC: Cutaneous squamous cell carcinoma
SCCIS:squamous cell carcinoma in situ
∗log2FC in expression of this searched gene in stem-like cells from each diseased tissue sample relative to stem-like cells in normal samples in each tissue plotted against the malignancy continuum. Samples are colored based on if they are from different disease stage.

Top

Malignant transformation related pathway analysis

check buttonFind out the enriched GO biological processes and KEGG pathways involved in transition from healthy to precancer to cancer
check button Figure of enriched GO biological processes.
TissueDisease StageEnriched GO biological Processes
ColorectumADGO analysis - Figure of enriched GO biological processes: Top 15 enriched GO BP terms are showed in the bar plot of each disease state in each tissue. Each row represents a significant GO biological process which is colored according to the -log10(p.adjust).
ColorectumSERGO analysis - Figure of enriched GO biological processes: Top 15 enriched GO BP terms are showed in the bar plot of each disease state in each tissue. Each row represents a significant GO biological process which is colored according to the -log10(p.adjust).
ColorectumMSSGO analysis - Figure of enriched GO biological processes: Top 15 enriched GO BP terms are showed in the bar plot of each disease state in each tissue. Each row represents a significant GO biological process which is colored according to the -log10(p.adjust).
ColorectumMSI-HGO analysis - Figure of enriched GO biological processes: Top 15 enriched GO BP terms are showed in the bar plot of each disease state in each tissue. Each row represents a significant GO biological process which is colored according to the -log10(p.adjust).
ColorectumFAPGO analysis - Figure of enriched GO biological processes: Top 15 enriched GO BP terms are showed in the bar plot of each disease state in each tissue. Each row represents a significant GO biological process which is colored according to the -log10(p.adjust).
∗Top 15 enriched GO BP terms are showed in the bar plot of each disease state in each tissue. Each row represents a significant GO biological process which is colored according to the -log10(p.adjust).
Page: 1 2 3 4 5 6 7 8 9 

check button Enriched GO biological processes.
GO IDTissueDisease StageDescriptionGene RatioBg Ratiopvaluep.adjustCount
GO:00060668EsophagusESCCalcohol metabolic process202/8552353/187237.32e-067.26e-05202
GO:00464864EsophagusESCCglycerolipid metabolic process211/8552392/187236.51e-043.46e-03211
GO:00442427EsophagusESCCcellular lipid catabolic process121/8552214/187238.63e-044.43e-03121
GO:00160427EsophagusESCClipid catabolic process168/8552320/187237.97e-032.84e-02168
GO:000606621LiverHCCalcohol metabolic process208/7958353/187232.80e-109.50e-09208
GO:004424222LiverHCCcellular lipid catabolic process134/7958214/187232.07e-095.79e-08134
GO:00550882LiverHCClipid homeostasis103/7958167/187234.27e-077.18e-06103
GO:004648611LiverHCCglycerolipid metabolic process215/7958392/187234.54e-077.49e-06215
GO:001604221LiverHCClipid catabolic process175/7958320/187236.50e-067.88e-05175
GO:00066412LiverHCCtriglyceride metabolic process59/7958100/187236.35e-043.93e-0359
GO:000663911LiverHCCacylglycerol metabolic process72/7958128/187231.16e-036.54e-0372
GO:000663811LiverHCCneutral lipid metabolic process72/7958129/187231.54e-038.14e-0372
GO:000672011LiverHCCisoprenoid metabolic process65/7958116/187232.23e-031.11e-0265
GO:003430812LiverHCCprimary alcohol metabolic process55/7958102/187231.30e-024.67e-0255
GO:00060667Oral cavityOSCCalcohol metabolic process179/7305353/187234.54e-065.21e-05179
GO:00442426Oral cavityOSCCcellular lipid catabolic process104/7305214/187232.61e-031.15e-02104
GO:00067203Oral cavityOSCCisoprenoid metabolic process59/7305116/187236.18e-032.33e-0259
GO:000606613Oral cavityLPalcohol metabolic process111/4623353/187232.24e-031.62e-02111
GO:004424213Oral cavityLPcellular lipid catabolic process70/4623214/187234.82e-033.05e-0270
Page: 1 

check button Enriched KEGG pathways.
Pathway IDTissueDisease StageDescriptionGene RatioBg Ratiopvaluep.adjustqvalueCount
Page: 1 

Top

Cell-cell communication analysis

check buttonIdentification of potential cell-cell interactions between two cell types and their ligand-receptor pairs for different disease states
LigandReceptorLRpairPathwayTissueDisease Stage
Page: 1 

Top

Single-cell gene regulatory network inference analysis

check buttonFind out the significant the regulons (TFs) and the target genes of each regulon across cell types for different disease states
TFCell TypeTissueDisease StageTarget GeneRSSRegulon Activity
∗The dot plots of a searched regulon are shown for all cell subpopulations in each disease state of each tissue based on the regulon specific score inferred using pySCENIC and by calculating the average expression.
Page: 1 

Top

Somatic mutation of malignant transformation related genes

check buttonAnnotation of somatic variants for genes involved in malignant transformation
Hugo SymbolVariant ClassVariant ClassificationdbSNP RSHGVScHGVSpHGVSp ShortSWISSPROTBIOTYPESIFTPolyPhenTumor Sample BarcodeTissueHistologySexAgeStageTherapy TypesDrugsOutcome
PNPLA4SNVMissense_Mutationc.680N>Ap.Ser227Asnp.S227NP41247protein_codingtolerated(0.43)benign(0)TCGA-AR-A0TW-01Breastbreast invasive carcinomaFemale<65III/IVChemotherapydoxorubicinPD
PNPLA4SNVMissense_Mutationc.679N>Tp.Ser227Cysp.S227CP41247protein_codingdeleterious(0.03)benign(0.379)TCGA-AR-A0TW-01Breastbreast invasive carcinomaFemale<65III/IVChemotherapydoxorubicinPD
PNPLA4SNVMissense_Mutationrs767773321c.188N>Gp.Asn63Serp.N63SP41247protein_codingtolerated(0.73)benign(0)TCGA-GI-A2C9-01Breastbreast invasive carcinomaFemale<65I/IIUnspecificSD
PNPLA4insertionFrame_Shift_Insnovelc.182_183insTTATCAAACTGTGAAACCTATGCCTGGAATACTCp.Glu61AspfsTer14p.E61Dfs*14P41247protein_codingTCGA-A8-A082-01Breastbreast invasive carcinomaFemale<65I/IIChemotherapy5-fluorouracilCR
PNPLA4insertionFrame_Shift_Insnovelc.300_301insGCCGCAGCCCAGTACCp.Pro101AlafsTer42p.P101Afs*42P41247protein_codingTCGA-AN-A0FX-01Breastbreast invasive carcinomaFemale<65I/IIUnknownUnknownSD
PNPLA4insertionFrame_Shift_Insnovelc.298_299insAp.Pro100HisfsTer38p.P100Hfs*38P41247protein_codingTCGA-AN-A0FX-01Breastbreast invasive carcinomaFemale<65I/IIUnknownUnknownSD
PNPLA4SNVMissense_Mutationc.491N>Tp.Gly164Valp.G164VP41247protein_codingdeleterious(0)probably_damaging(0.995)TCGA-2W-A8YY-01Cervixcervical & endocervical cancerFemale<65I/IIChemotherapycisplatinCR
PNPLA4SNVMissense_Mutationnovelc.437N>Tp.Pro146Leup.P146LP41247protein_codingdeleterious(0)probably_damaging(0.999)TCGA-2W-A8YY-01Cervixcervical & endocervical cancerFemale<65I/IIChemotherapycisplatinCR
PNPLA4SNVMissense_Mutationrs775251646c.329N>Ap.Arg110Glnp.R110QP41247protein_codingdeleterious(0)possibly_damaging(0.876)TCGA-EA-A3HS-01Cervixcervical & endocervical cancerFemale<65I/IIUnknownUnknownSD
PNPLA4SNVMissense_Mutationc.203N>Tp.Lys68Metp.K68MP41247protein_codingdeleterious(0.03)possibly_damaging(0.799)TCGA-AA-3672-01Colorectumcolon adenocarcinomaFemale>=65III/IVUnknownUnknownSD
Page: 1 2 3 4 

Top

Related drugs of malignant transformation related genes

check buttonIdentification of chemicals and drugs interact with genes involved in malignant transfromation
(DGIdb 4.0)
Entrez IDSymbolCategoryInteraction TypesDrug Claim NameDrug NamePMIDs
Page: 1