
|
|||||
|
 | |
| |
| |
| |
| |
| |
|
Gene: PMF1 |
Gene summary for PMF1 |
| Gene information | Species | Human | Gene symbol | PMF1 | Gene ID | 11243 |
| Gene name | polyamine modulated factor 1 | |
| Gene Alias | PMF1 | |
| Cytomap | 1q22 | |
| Gene Type | protein-coding | GO ID | GO:0006139 | UniProtAcc | Q6P1K2 |
Top |
Malignant transformation analysis |
| Identification of the aberrant gene expression in precancerous and cancerous lesions by comparing the gene expression of stem-like cells in diseased tissues with normal stem cells |
| Entrez ID | Symbol | Replicates | Species | Organ | Tissue | Adj P-value | Log2FC | Malignancy |
| 11243 | PMF1 | P80T-E | Human | Esophagus | ESCC | 1.24e-05 | 6.06e-02 | 0.155 |
| 11243 | PMF1 | P83T-E | Human | Esophagus | ESCC | 1.61e-06 | 5.74e-02 | 0.1738 |
| 11243 | PMF1 | P89T-E | Human | Esophagus | ESCC | 4.30e-04 | 2.22e-01 | 0.1752 |
| 11243 | PMF1 | P107T-E | Human | Esophagus | ESCC | 1.85e-13 | 1.20e-01 | 0.171 |
| 11243 | PMF1 | P127T-E | Human | Esophagus | ESCC | 7.55e-04 | -5.38e-02 | 0.0826 |
| 11243 | PMF1 | P128T-E | Human | Esophagus | ESCC | 1.10e-06 | 1.54e-01 | 0.1241 |
| 11243 | PMF1 | P130T-E | Human | Esophagus | ESCC | 1.86e-20 | 1.18e-01 | 0.1676 |
| 11243 | PMF1 | C04 | Human | Oral cavity | OSCC | 3.32e-35 | 1.71e+00 | 0.2633 |
| 11243 | PMF1 | C21 | Human | Oral cavity | OSCC | 2.68e-55 | 1.80e+00 | 0.2678 |
| 11243 | PMF1 | C30 | Human | Oral cavity | OSCC | 1.41e-45 | 2.31e+00 | 0.3055 |
| 11243 | PMF1 | C38 | Human | Oral cavity | OSCC | 2.77e-07 | 1.28e+00 | 0.172 |
| 11243 | PMF1 | C43 | Human | Oral cavity | OSCC | 6.89e-68 | 1.17e+00 | 0.1704 |
| 11243 | PMF1 | C46 | Human | Oral cavity | OSCC | 9.22e-39 | 1.19e+00 | 0.1673 |
| 11243 | PMF1 | C51 | Human | Oral cavity | OSCC | 3.88e-12 | 1.04e+00 | 0.2674 |
| 11243 | PMF1 | C57 | Human | Oral cavity | OSCC | 3.63e-11 | 7.92e-01 | 0.1679 |
| 11243 | PMF1 | C06 | Human | Oral cavity | OSCC | 2.21e-08 | 1.62e+00 | 0.2699 |
| 11243 | PMF1 | C07 | Human | Oral cavity | OSCC | 8.80e-04 | 1.31e+00 | 0.2491 |
| 11243 | PMF1 | C08 | Human | Oral cavity | OSCC | 7.99e-50 | 1.09e+00 | 0.1919 |
| 11243 | PMF1 | C09 | Human | Oral cavity | OSCC | 2.84e-08 | 4.08e-01 | 0.1431 |
| 11243 | PMF1 | LN22 | Human | Oral cavity | OSCC | 3.48e-11 | 1.44e+00 | 0.1733 |
| Page: 1 2 3 4 5 6 7 |
| Tissue | Expression Dynamics | Abbreviation |
| Colorectum (GSE201348) |  | FAP: Familial adenomatous polyposis |
| CRC: Colorectal cancer | ||
| Colorectum (HTA11) |  | AD: Adenomas |
| SER: Sessile serrated lesions | ||
| MSI-H: Microsatellite-high colorectal cancer | ||
| MSS: Microsatellite stable colorectal cancer | ||
| Esophagus | 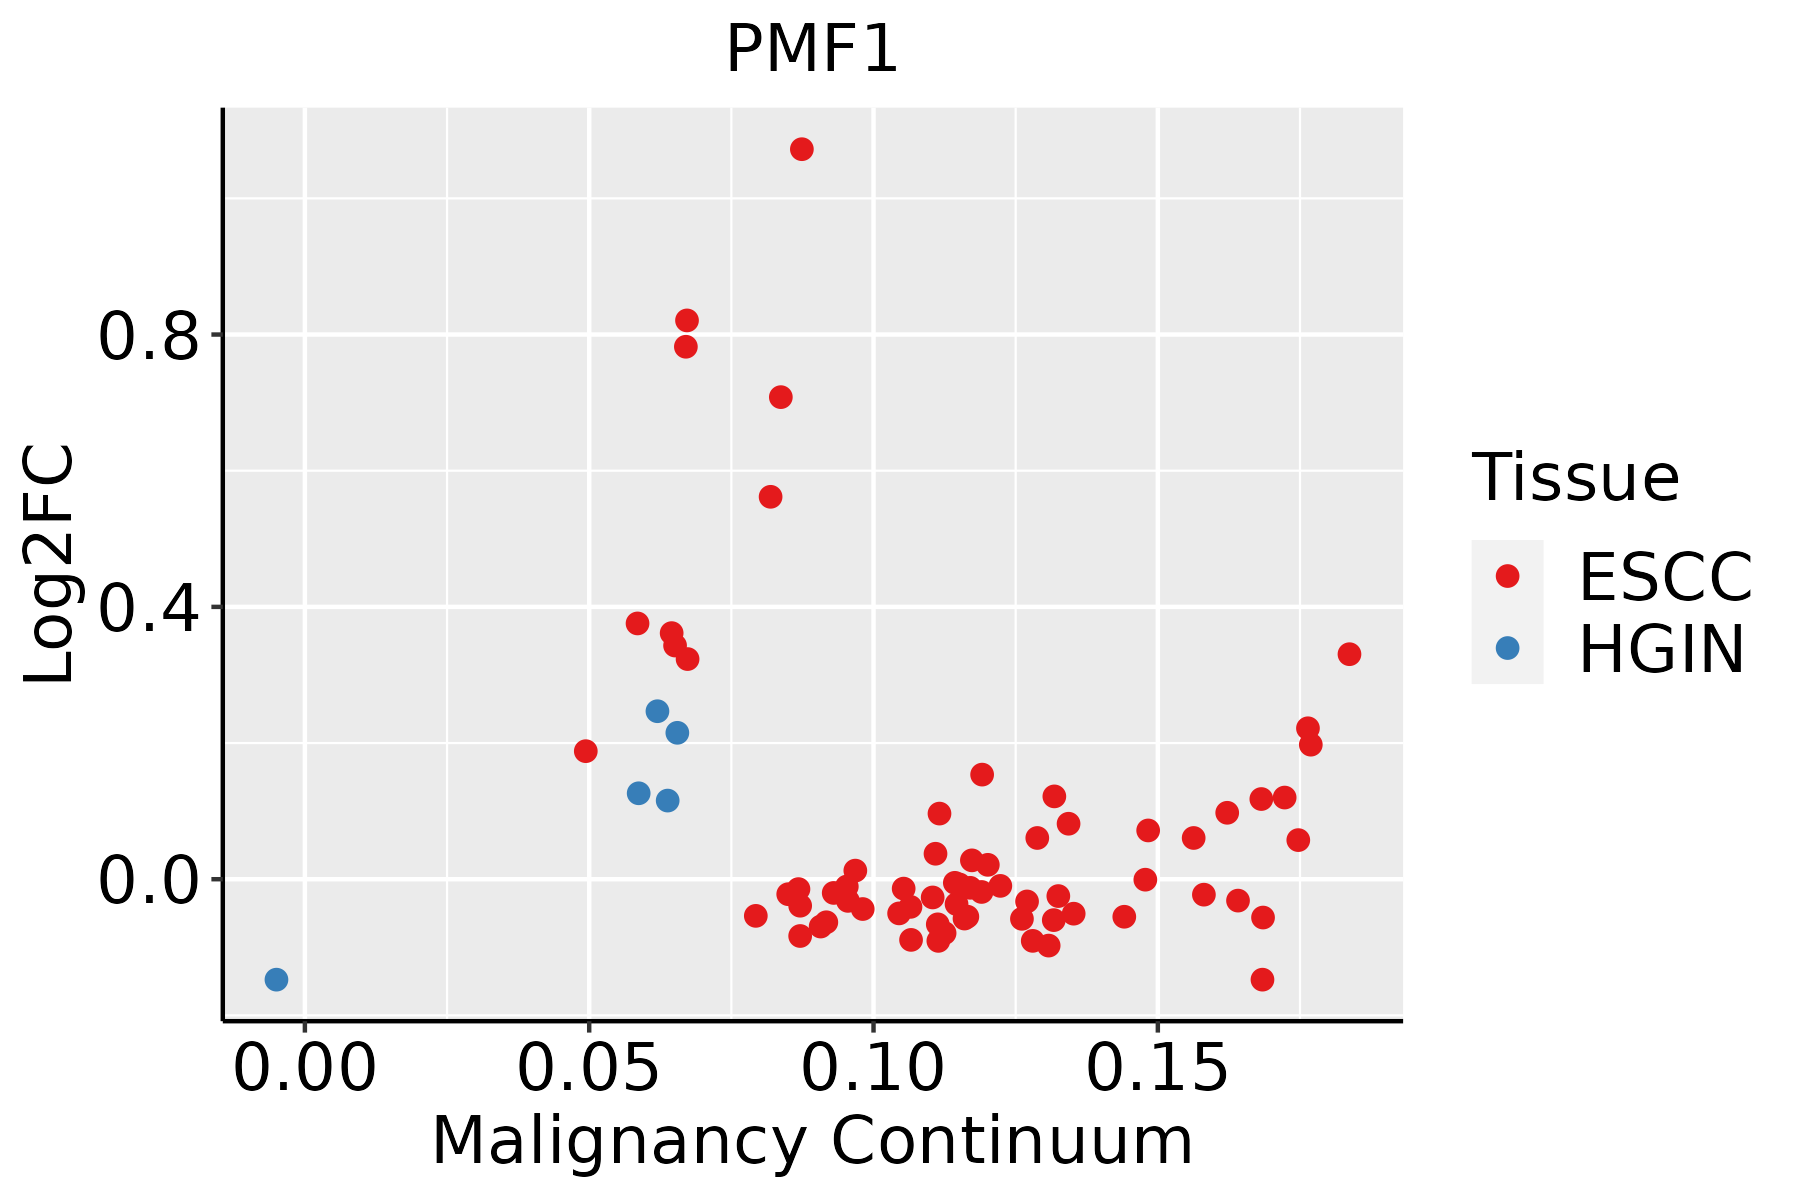 | ESCC: Esophageal squamous cell carcinoma |
| HGIN: High-grade intraepithelial neoplasias | ||
| LGIN: Low-grade intraepithelial neoplasias | ||
| Oral Cavity | 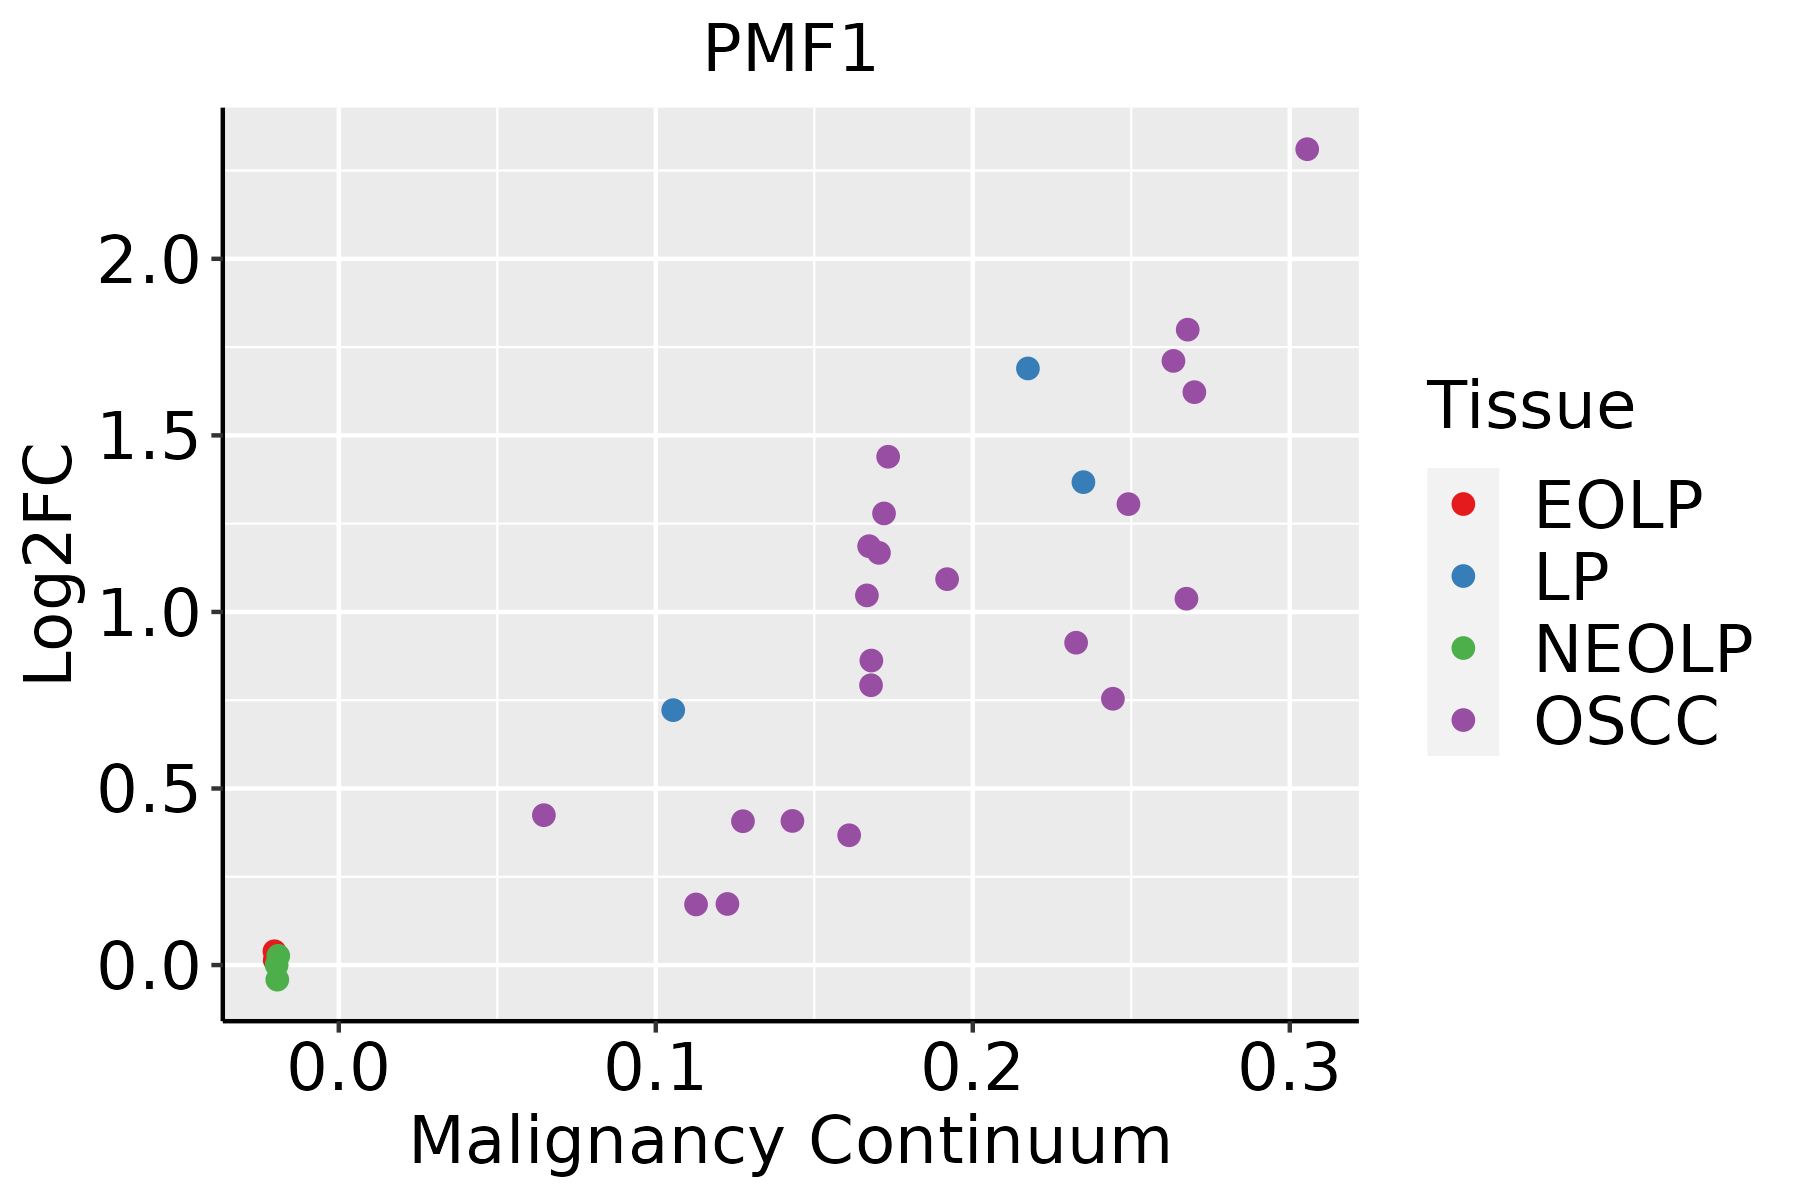 | EOLP: Erosive Oral lichen planus |
| LP: leukoplakia | ||
| NEOLP: Non-erosive oral lichen planus | ||
| OSCC: Oral squamous cell carcinoma | ||
| Skin | 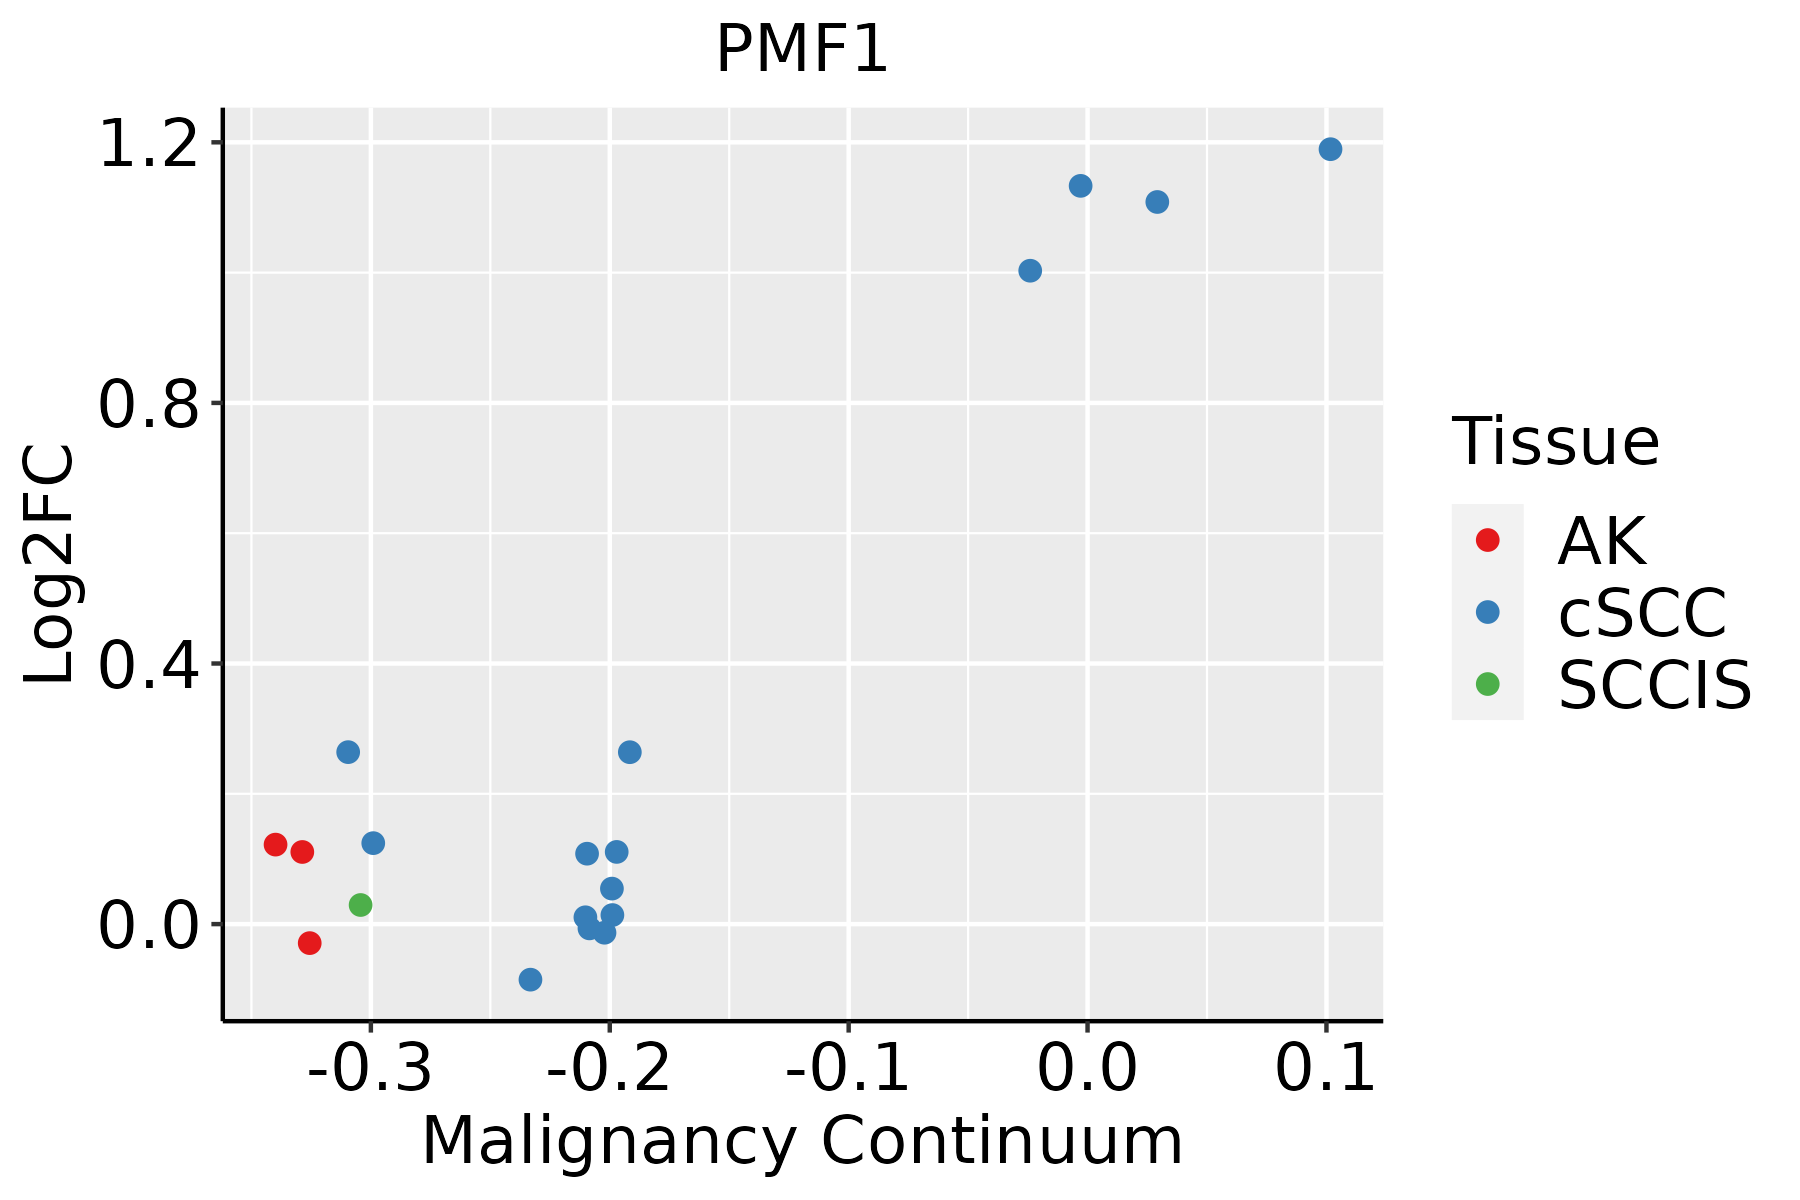 | AK: Actinic keratosis |
| cSCC: Cutaneous squamous cell carcinoma | ||
| SCCIS:squamous cell carcinoma in situ | ||
| Thyroid | 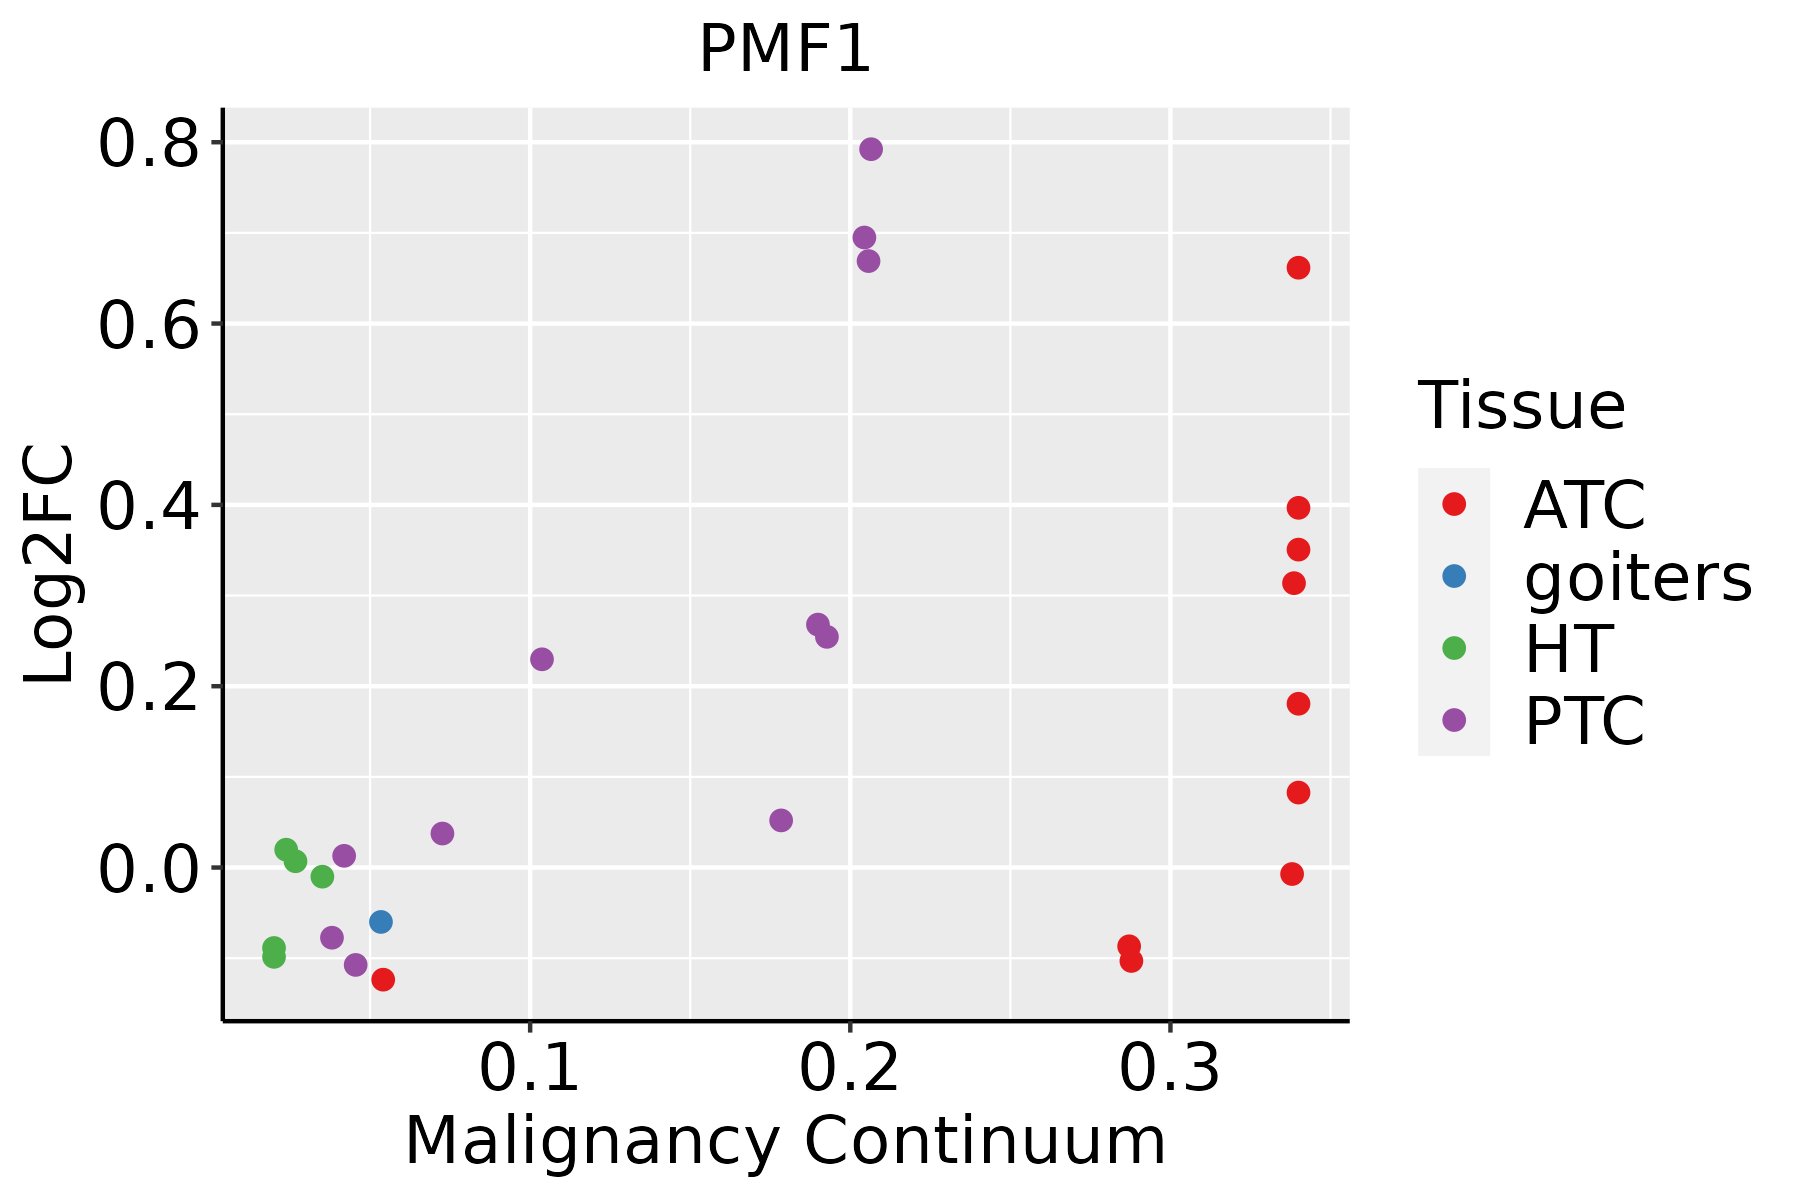 | ATC: Anaplastic thyroid cancer |
| HT: Hashimoto's thyroiditis | ||
| PTC: Papillary thyroid cancer |
| ∗log2FC in expression of this searched gene in stem-like cells from each diseased tissue sample relative to stem-like cells in normal samples in each tissue plotted against the malignancy continuum. Samples are colored based on if they are from different disease stage. |
Top |
Malignant transformation related pathway analysis |
| Find out the enriched GO biological processes and KEGG pathways involved in transition from healthy to precancer to cancer |
| Tissue | Disease Stage | Enriched GO biological Processes |
| Colorectum | AD |  |
| Colorectum | SER |  |
| Colorectum | MSS |  |
| Colorectum | MSI-H |  |
| Colorectum | FAP |  |
| ∗Top 15 enriched GO BP terms are showed in the bar plot of each disease state in each tissue. Each row represents a significant GO biological process which is colored according to the -log10(p.adjust). |
| Page: 1 2 3 4 5 6 7 8 9 |
| GO ID | Tissue | Disease Stage | Description | Gene Ratio | Bg Ratio | pvalue | p.adjust | Count |
| GO:000705911 | Esophagus | ESCC | chromosome segregation | 238/8552 | 346/18723 | 1.72e-18 | 1.82e-16 | 238 |
| GO:00070592 | Oral cavity | OSCC | chromosome segregation | 206/7305 | 346/18723 | 5.82e-15 | 3.76e-13 | 206 |
| GO:00070591 | Oral cavity | LP | chromosome segregation | 117/4623 | 346/18723 | 7.61e-05 | 9.91e-04 | 117 |
| GO:000705912 | Skin | cSCC | chromosome segregation | 161/4864 | 346/18723 | 8.34e-17 | 8.57e-15 | 161 |
| GO:00070595 | Thyroid | PTC | chromosome segregation | 146/5968 | 346/18723 | 2.99e-05 | 2.87e-04 | 146 |
| GO:000705913 | Thyroid | ATC | chromosome segregation | 183/6293 | 346/18723 | 8.03e-14 | 4.23e-12 | 183 |
| Page: 1 |
| Pathway ID | Tissue | Disease Stage | Description | Gene Ratio | Bg Ratio | pvalue | p.adjust | qvalue | Count |
| Page: 1 |
Top |
Cell-cell communication analysis |
| Identification of potential cell-cell interactions between two cell types and their ligand-receptor pairs for different disease states |
| Ligand | Receptor | LRpair | Pathway | Tissue | Disease Stage |
| Page: 1 |
Top |
Single-cell gene regulatory network inference analysis |
| Find out the significant the regulons (TFs) and the target genes of each regulon across cell types for different disease states |
| TF | Cell Type | Tissue | Disease Stage | Target Gene | RSS | Regulon Activity |
| ∗The dot plots of a searched regulon are shown for all cell subpopulations in each disease state of each tissue based on the regulon specific score inferred using pySCENIC and by calculating the average expression. |
| Page: 1 |
Top |
Somatic mutation of malignant transformation related genes |
| Annotation of somatic variants for genes involved in malignant transformation |
| Hugo Symbol | Variant Class | Variant Classification | dbSNP RS | HGVSc | HGVSp | HGVSp Short | SWISSPROT | BIOTYPE | SIFT | PolyPhen | Tumor Sample Barcode | Tissue | Histology | Sex | Age | Stage | Therapy Types | Drugs | Outcome |
| PMF1 | insertion | Frame_Shift_Ins | novel | c.623_624insCTGCTCCACTATCGCCACTC | p.Ter208CysfsTer36 | p.*208Cfs*36 | Q6P1K2 | protein_coding | TCGA-A2-A0EO-01 | Breast | breast invasive carcinoma | Female | <65 | I/II | Hormone Therapy | tamoxiphen | SD | ||
| PMF1 | SNV | Missense_Mutation | novel | c.250N>C | p.Cys84Arg | p.C84R | Q6P1K2 | protein_coding | deleterious(0.01) | benign(0) | TCGA-AA-3845-01 | Colorectum | colon adenocarcinoma | Female | >=65 | I/II | Unknown | Unknown | PD |
| PMF1 | SNV | Missense_Mutation | c.418N>T | p.Ala140Ser | p.A140S | Q6P1K2 | protein_coding | deleterious(0.01) | benign(0.382) | TCGA-AA-A010-01 | Colorectum | colon adenocarcinoma | Female | <65 | I/II | Chemotherapy | folinic | CR | |
| PMF1 | SNV | Missense_Mutation | novel | c.464N>G | p.Gln155Arg | p.Q155R | Q6P1K2 | protein_coding | tolerated(0.59) | benign(0.006) | TCGA-A5-A2K2-01 | Endometrium | uterine corpus endometrioid carcinoma | Female | >=65 | I/II | Chemotherapy | taxol | SD |
| PMF1 | SNV | Missense_Mutation | rs548726372 | c.514C>T | p.Arg172Trp | p.R172W | Q6P1K2 | protein_coding | deleterious(0) | probably_damaging(0.999) | TCGA-B5-A3FC-01 | Endometrium | uterine corpus endometrioid carcinoma | Female | <65 | I/II | Unknown | Unknown | SD |
| PMF1 | SNV | Missense_Mutation | rs768500887 | c.455N>A | p.Arg152His | p.R152H | Q6P1K2 | protein_coding | tolerated(0.23) | benign(0.014) | TCGA-EO-A22R-01 | Endometrium | uterine corpus endometrioid carcinoma | Female | <65 | I/II | Unknown | Unknown | SD |
| PMF1 | SNV | Missense_Mutation | rs771971437 | c.376N>T | p.Arg126Cys | p.R126C | Q6P1K2 | protein_coding | deleterious(0) | probably_damaging(0.994) | TCGA-18-5592-01 | Lung | lung squamous cell carcinoma | Male | <65 | I/II | Unknown | Unknown | SD |
| PMF1 | SNV | Missense_Mutation | rs763130134 | c.397N>G | p.Lys133Glu | p.K133E | Q6P1K2 | protein_coding | tolerated(0.9) | benign(0.009) | TCGA-J9-A52C-01 | Prostate | prostate adenocarcinoma | Male | <65 | 9 | Unknown | Unknown | SD |
| PMF1 | SNV | Missense_Mutation | c.418G>T | p.Ala140Ser | p.A140S | Q6P1K2 | protein_coding | deleterious(0.01) | benign(0.382) | TCGA-XK-AAIW-01 | Prostate | prostate adenocarcinoma | Male | >=65 | 9 | Unknown | Unknown | PD | |
| PMF1 | SNV | Missense_Mutation | novel | c.491N>G | p.Leu164Arg | p.L164R | Q6P1K2 | protein_coding | deleterious(0) | probably_damaging(0.999) | TCGA-BR-7851-01 | Stomach | stomach adenocarcinoma | Male | >=65 | I/II | Unknown | Unknown | SD |
| Page: 1 2 |
Top |
Related drugs of malignant transformation related genes |
| Identification of chemicals and drugs interact with genes involved in malignant transfromation |
| (DGIdb 4.0) |
| Entrez ID | Symbol | Category | Interaction Types | Drug Claim Name | Drug Name | PMIDs |
| Page: 1 |

Copyright 2023-Present -The University of Texas Health Science Center at Houston |