
|
|||||
|
 | |
| |
| |
| |
| |
| |
|
Gene: PIAS2 |
Gene summary for PIAS2 |
| Gene information | Species | Human | Gene symbol | PIAS2 | Gene ID | 9063 |
| Gene name | protein inhibitor of activated STAT 2 | |
| Gene Alias | ARIP3 | |
| Cytomap | 18q21.1 | |
| Gene Type | protein-coding | GO ID | GO:0006139 | UniProtAcc | A0A024RC49 |
Top |
Malignant transformation analysis |
| Identification of the aberrant gene expression in precancerous and cancerous lesions by comparing the gene expression of stem-like cells in diseased tissues with normal stem cells |
| Entrez ID | Symbol | Replicates | Species | Organ | Tissue | Adj P-value | Log2FC | Malignancy |
| 9063 | PIAS2 | P79T-E | Human | Esophagus | ESCC | 1.53e-24 | 4.28e-01 | 0.1154 |
| 9063 | PIAS2 | P80T-E | Human | Esophagus | ESCC | 2.12e-12 | 2.78e-01 | 0.155 |
| 9063 | PIAS2 | P83T-E | Human | Esophagus | ESCC | 8.73e-22 | 5.47e-01 | 0.1738 |
| 9063 | PIAS2 | P89T-E | Human | Esophagus | ESCC | 1.88e-07 | 4.17e-01 | 0.1752 |
| 9063 | PIAS2 | P91T-E | Human | Esophagus | ESCC | 1.31e-03 | 3.77e-01 | 0.1828 |
| 9063 | PIAS2 | P107T-E | Human | Esophagus | ESCC | 4.31e-14 | 2.47e-01 | 0.171 |
| 9063 | PIAS2 | P127T-E | Human | Esophagus | ESCC | 2.56e-09 | 1.47e-01 | 0.0826 |
| 9063 | PIAS2 | P128T-E | Human | Esophagus | ESCC | 3.14e-17 | 3.96e-01 | 0.1241 |
| 9063 | PIAS2 | P130T-E | Human | Esophagus | ESCC | 2.95e-28 | 4.06e-01 | 0.1676 |
| 9063 | PIAS2 | NAFLD1 | Human | Liver | NAFLD | 2.41e-06 | 6.16e-01 | -0.04 |
| 9063 | PIAS2 | HCC1_Meng | Human | Liver | HCC | 9.73e-62 | 1.25e-01 | 0.0246 |
| 9063 | PIAS2 | HCC2_Meng | Human | Liver | HCC | 8.49e-05 | -4.89e-02 | 0.0107 |
| 9063 | PIAS2 | HCC1 | Human | Liver | HCC | 1.89e-10 | 3.60e+00 | 0.5336 |
| 9063 | PIAS2 | HCC2 | Human | Liver | HCC | 3.62e-28 | 3.78e+00 | 0.5341 |
| 9063 | PIAS2 | HCC5 | Human | Liver | HCC | 4.92e-12 | 2.77e+00 | 0.4932 |
| 9063 | PIAS2 | S028 | Human | Liver | HCC | 7.95e-04 | 3.23e-01 | 0.2503 |
| 9063 | PIAS2 | S029 | Human | Liver | HCC | 7.10e-06 | 4.36e-01 | 0.2581 |
| 9063 | PIAS2 | RNA-P25T1-P25T1-1 | Human | Lung | AIS | 1.01e-08 | 4.79e-01 | -0.2116 |
| 9063 | PIAS2 | RNA-P25T1-P25T1-2 | Human | Lung | AIS | 2.07e-04 | 6.21e-01 | -0.1941 |
| 9063 | PIAS2 | RNA-P25T1-P25T1-3 | Human | Lung | AIS | 6.12e-05 | 5.78e-01 | -0.2107 |
| Page: 1 2 3 4 5 6 |
| Tissue | Expression Dynamics | Abbreviation |
| Colorectum (GSE201348) |  | FAP: Familial adenomatous polyposis |
| CRC: Colorectal cancer | ||
| Colorectum (HTA11) |  | AD: Adenomas |
| SER: Sessile serrated lesions | ||
| MSI-H: Microsatellite-high colorectal cancer | ||
| MSS: Microsatellite stable colorectal cancer | ||
| Esophagus |  | ESCC: Esophageal squamous cell carcinoma |
| HGIN: High-grade intraepithelial neoplasias | ||
| LGIN: Low-grade intraepithelial neoplasias | ||
| Liver | 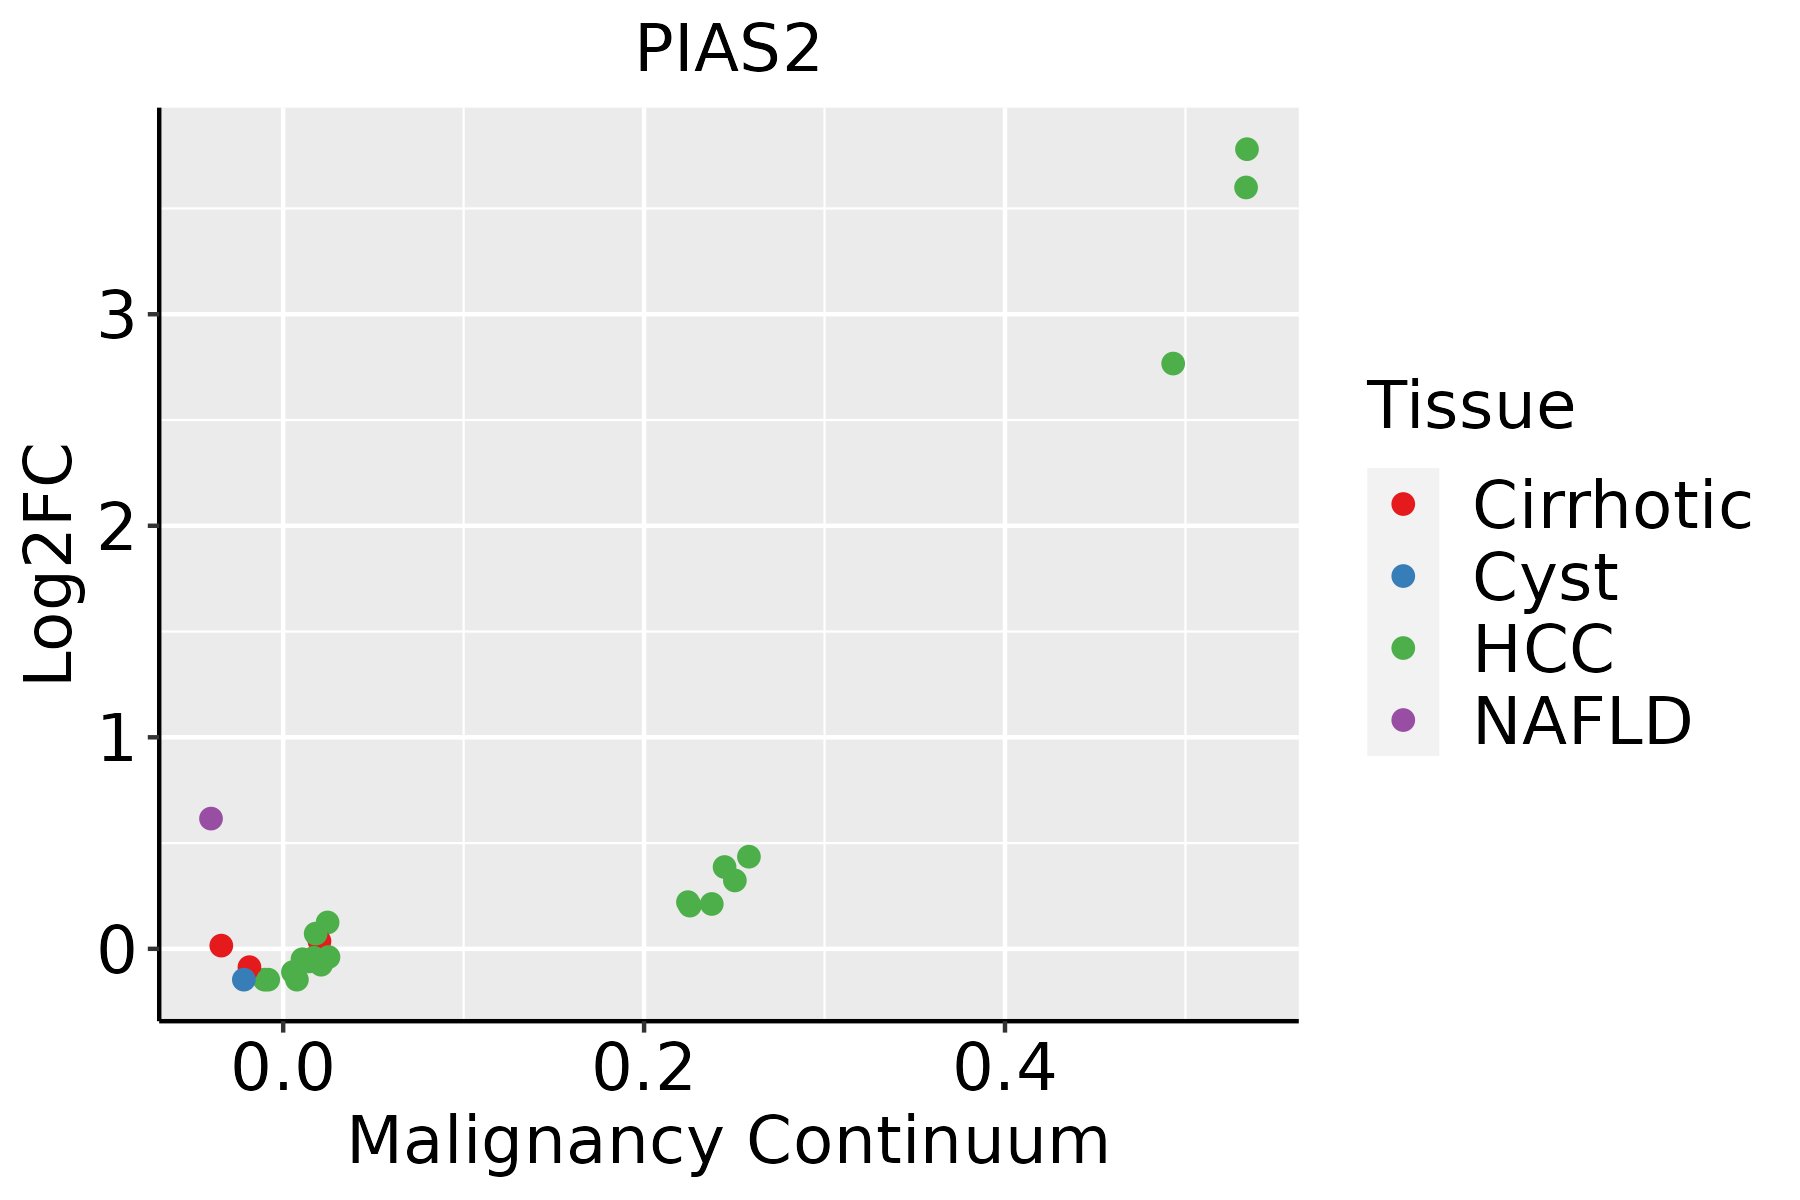 | HCC: Hepatocellular carcinoma |
| NAFLD: Non-alcoholic fatty liver disease | ||
| Lung |  | AAH: Atypical adenomatous hyperplasia |
| AIS: Adenocarcinoma in situ | ||
| IAC: Invasive lung adenocarcinoma | ||
| MIA: Minimally invasive adenocarcinoma | ||
| Oral Cavity |  | EOLP: Erosive Oral lichen planus |
| LP: leukoplakia | ||
| NEOLP: Non-erosive oral lichen planus | ||
| OSCC: Oral squamous cell carcinoma | ||
| Prostate | 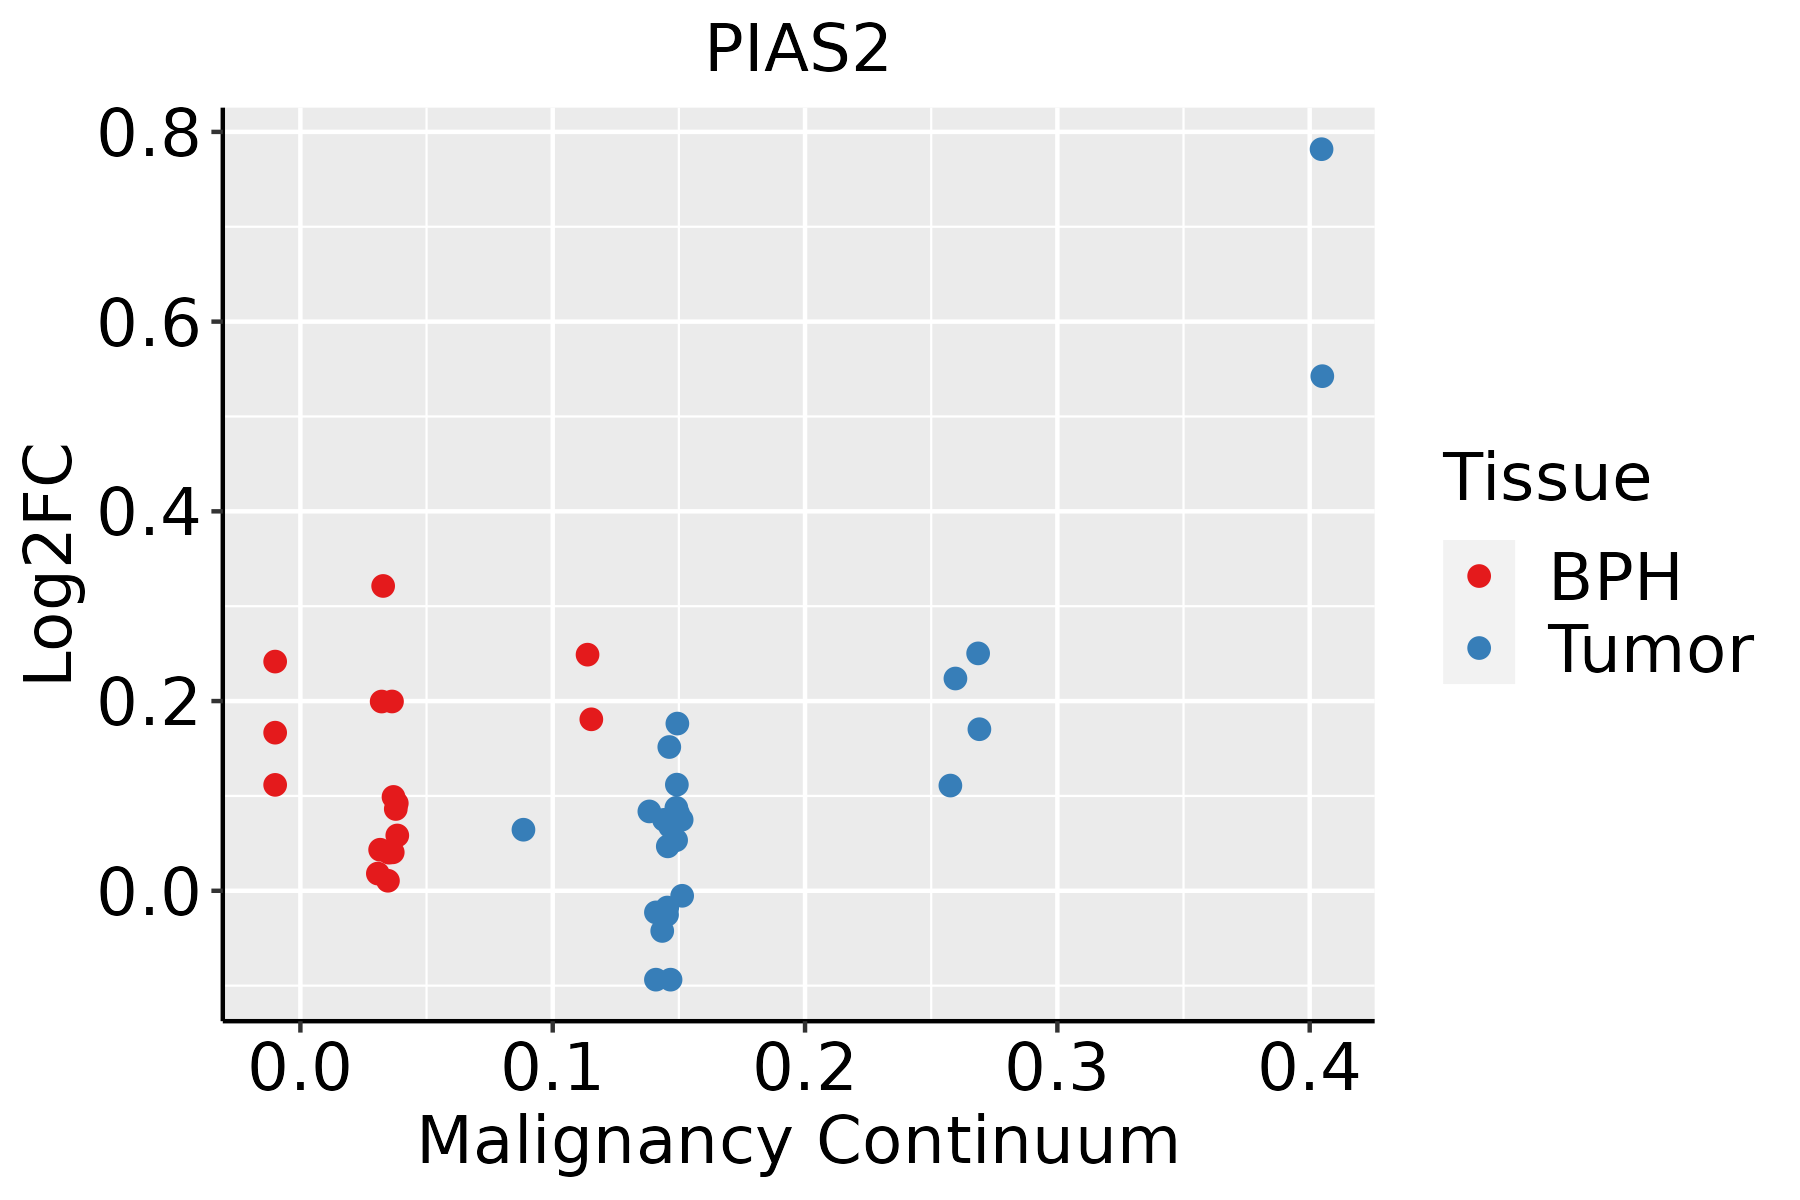 | BPH: Benign Prostatic Hyperplasia |
| ∗log2FC in expression of this searched gene in stem-like cells from each diseased tissue sample relative to stem-like cells in normal samples in each tissue plotted against the malignancy continuum. Samples are colored based on if they are from different disease stage. |
Top |
Malignant transformation related pathway analysis |
| Find out the enriched GO biological processes and KEGG pathways involved in transition from healthy to precancer to cancer |
| Tissue | Disease Stage | Enriched GO biological Processes |
| Colorectum | AD |  |
| Colorectum | SER |  |
| Colorectum | MSS |  |
| Colorectum | MSI-H |  |
| Colorectum | FAP |  |
| ∗Top 15 enriched GO BP terms are showed in the bar plot of each disease state in each tissue. Each row represents a significant GO biological process which is colored according to the -log10(p.adjust). |
| Page: 1 2 3 4 5 6 7 8 9 |
| GO ID | Tissue | Disease Stage | Description | Gene Ratio | Bg Ratio | pvalue | p.adjust | Count |
| GO:0071383 | Colorectum | AD | cellular response to steroid hormone stimulus | 73/3918 | 204/18723 | 6.31e-07 | 2.24e-05 | 73 |
| GO:0030522 | Colorectum | AD | intracellular receptor signaling pathway | 87/3918 | 265/18723 | 3.69e-06 | 1.03e-04 | 87 |
| GO:0043401 | Colorectum | AD | steroid hormone mediated signaling pathway | 51/3918 | 136/18723 | 6.52e-06 | 1.63e-04 | 51 |
| GO:0048545 | Colorectum | AD | response to steroid hormone | 104/3918 | 339/18723 | 1.33e-05 | 2.90e-04 | 104 |
| GO:0009755 | Colorectum | AD | hormone-mediated signaling pathway | 64/3918 | 190/18723 | 2.78e-05 | 5.24e-04 | 64 |
| GO:0030518 | Colorectum | AD | intracellular steroid hormone receptor signaling pathway | 43/3918 | 116/18723 | 4.61e-05 | 7.97e-04 | 43 |
| GO:0030521 | Colorectum | AD | androgen receptor signaling pathway | 20/3918 | 44/18723 | 2.26e-04 | 2.94e-03 | 20 |
| GO:0033144 | Colorectum | AD | negative regulation of intracellular steroid hormone receptor signaling pathway | 16/3918 | 38/18723 | 2.53e-03 | 1.93e-02 | 16 |
| GO:0060766 | Colorectum | AD | negative regulation of androgen receptor signaling pathway | 8/3918 | 15/18723 | 5.67e-03 | 3.64e-02 | 8 |
| GO:00713831 | Colorectum | SER | cellular response to steroid hormone stimulus | 55/2897 | 204/18723 | 1.66e-05 | 5.05e-04 | 55 |
| GO:00485451 | Colorectum | SER | response to steroid hormone | 80/2897 | 339/18723 | 5.15e-05 | 1.25e-03 | 80 |
| GO:00434011 | Colorectum | SER | steroid hormone mediated signaling pathway | 38/2897 | 136/18723 | 1.42e-04 | 2.82e-03 | 38 |
| GO:00097551 | Colorectum | SER | hormone-mediated signaling pathway | 49/2897 | 190/18723 | 1.54e-04 | 3.00e-03 | 49 |
| GO:00305221 | Colorectum | SER | intracellular receptor signaling pathway | 63/2897 | 265/18723 | 2.47e-04 | 4.20e-03 | 63 |
| GO:00305181 | Colorectum | SER | intracellular steroid hormone receptor signaling pathway | 31/2897 | 116/18723 | 1.25e-03 | 1.41e-02 | 31 |
| GO:00331441 | Colorectum | SER | negative regulation of intracellular steroid hormone receptor signaling pathway | 13/2897 | 38/18723 | 3.40e-03 | 2.90e-02 | 13 |
| GO:00305211 | Colorectum | SER | androgen receptor signaling pathway | 14/2897 | 44/18723 | 5.09e-03 | 3.91e-02 | 14 |
| GO:00713832 | Colorectum | MSS | cellular response to steroid hormone stimulus | 72/3467 | 204/18723 | 8.87e-09 | 5.43e-07 | 72 |
| GO:00434012 | Colorectum | MSS | steroid hormone mediated signaling pathway | 51/3467 | 136/18723 | 1.43e-07 | 6.67e-06 | 51 |
| GO:00305222 | Colorectum | MSS | intracellular receptor signaling pathway | 84/3467 | 265/18723 | 1.47e-07 | 6.79e-06 | 84 |
| Page: 1 2 3 4 5 6 7 |
| Pathway ID | Tissue | Disease Stage | Description | Gene Ratio | Bg Ratio | pvalue | p.adjust | qvalue | Count |
| hsa04120 | Colorectum | AD | Ubiquitin mediated proteolysis | 58/2092 | 142/8465 | 1.46e-05 | 1.53e-04 | 9.76e-05 | 58 |
| hsa041201 | Colorectum | AD | Ubiquitin mediated proteolysis | 58/2092 | 142/8465 | 1.46e-05 | 1.53e-04 | 9.76e-05 | 58 |
| hsa041202 | Colorectum | SER | Ubiquitin mediated proteolysis | 39/1580 | 142/8465 | 6.18e-03 | 3.66e-02 | 2.66e-02 | 39 |
| hsa041203 | Colorectum | SER | Ubiquitin mediated proteolysis | 39/1580 | 142/8465 | 6.18e-03 | 3.66e-02 | 2.66e-02 | 39 |
| hsa041204 | Colorectum | MSS | Ubiquitin mediated proteolysis | 55/1875 | 142/8465 | 5.02e-06 | 6.00e-05 | 3.68e-05 | 55 |
| hsa041205 | Colorectum | MSS | Ubiquitin mediated proteolysis | 55/1875 | 142/8465 | 5.02e-06 | 6.00e-05 | 3.68e-05 | 55 |
| hsa041206 | Colorectum | FAP | Ubiquitin mediated proteolysis | 51/1404 | 142/8465 | 1.55e-08 | 5.84e-07 | 3.55e-07 | 51 |
| hsa041207 | Colorectum | FAP | Ubiquitin mediated proteolysis | 51/1404 | 142/8465 | 1.55e-08 | 5.84e-07 | 3.55e-07 | 51 |
| hsa041208 | Colorectum | CRC | Ubiquitin mediated proteolysis | 42/1091 | 142/8465 | 9.98e-08 | 6.67e-06 | 4.52e-06 | 42 |
| hsa041209 | Colorectum | CRC | Ubiquitin mediated proteolysis | 42/1091 | 142/8465 | 9.98e-08 | 6.67e-06 | 4.52e-06 | 42 |
| hsa0412027 | Esophagus | ESCC | Ubiquitin mediated proteolysis | 122/4205 | 142/8465 | 6.53e-20 | 7.29e-18 | 3.74e-18 | 122 |
| hsa0412036 | Esophagus | ESCC | Ubiquitin mediated proteolysis | 122/4205 | 142/8465 | 6.53e-20 | 7.29e-18 | 3.74e-18 | 122 |
| hsa0412010 | Liver | NAFLD | Ubiquitin mediated proteolysis | 44/1043 | 142/8465 | 2.59e-09 | 1.70e-07 | 1.37e-07 | 44 |
| hsa0412011 | Liver | NAFLD | Ubiquitin mediated proteolysis | 44/1043 | 142/8465 | 2.59e-09 | 1.70e-07 | 1.37e-07 | 44 |
| hsa0412041 | Liver | HCC | Ubiquitin mediated proteolysis | 110/4020 | 142/8465 | 1.67e-13 | 3.74e-12 | 2.08e-12 | 110 |
| hsa0412051 | Liver | HCC | Ubiquitin mediated proteolysis | 110/4020 | 142/8465 | 1.67e-13 | 3.74e-12 | 2.08e-12 | 110 |
| hsa0412022 | Lung | AIS | Ubiquitin mediated proteolysis | 41/961 | 142/8465 | 8.01e-09 | 4.33e-07 | 2.77e-07 | 41 |
| hsa0412032 | Lung | AIS | Ubiquitin mediated proteolysis | 41/961 | 142/8465 | 8.01e-09 | 4.33e-07 | 2.77e-07 | 41 |
| hsa0412020 | Oral cavity | OSCC | Ubiquitin mediated proteolysis | 105/3704 | 142/8465 | 1.83e-13 | 4.37e-12 | 2.23e-12 | 105 |
| hsa04120110 | Oral cavity | OSCC | Ubiquitin mediated proteolysis | 105/3704 | 142/8465 | 1.83e-13 | 4.37e-12 | 2.23e-12 | 105 |
| Page: 1 2 |
Top |
Cell-cell communication analysis |
| Identification of potential cell-cell interactions between two cell types and their ligand-receptor pairs for different disease states |
| Ligand | Receptor | LRpair | Pathway | Tissue | Disease Stage |
| Page: 1 |
Top |
Single-cell gene regulatory network inference analysis |
| Find out the significant the regulons (TFs) and the target genes of each regulon across cell types for different disease states |
| TF | Cell Type | Tissue | Disease Stage | Target Gene | RSS | Regulon Activity |
| ∗The dot plots of a searched regulon are shown for all cell subpopulations in each disease state of each tissue based on the regulon specific score inferred using pySCENIC and by calculating the average expression. |
| Page: 1 |
Top |
Somatic mutation of malignant transformation related genes |
| Annotation of somatic variants for genes involved in malignant transformation |
| Hugo Symbol | Variant Class | Variant Classification | dbSNP RS | HGVSc | HGVSp | HGVSp Short | SWISSPROT | BIOTYPE | SIFT | PolyPhen | Tumor Sample Barcode | Tissue | Histology | Sex | Age | Stage | Therapy Types | Drugs | Outcome |
| PIAS2 | SNV | Missense_Mutation | c.1457N>T | p.Ala486Val | p.A486V | O75928 | protein_coding | tolerated(0.31) | benign(0.007) | TCGA-AN-A0AK-01 | Breast | breast invasive carcinoma | Female | >=65 | I/II | Unknown | Unknown | SD | |
| PIAS2 | SNV | Missense_Mutation | c.1805N>C | p.Ser602Thr | p.S602T | O75928 | protein_coding | tolerated_low_confidence(0.64) | benign(0.015) | TCGA-B6-A0RG-01 | Breast | breast invasive carcinoma | Female | <65 | I/II | Unknown | Unknown | SD | |
| PIAS2 | SNV | Missense_Mutation | c.1281G>A | p.Met427Ile | p.M427I | O75928 | protein_coding | tolerated(0.17) | benign(0.041) | TCGA-E2-A10C-01 | Breast | breast invasive carcinoma | Female | <65 | I/II | Chemotherapy | cytoxan | SD | |
| PIAS2 | insertion | Frame_Shift_Ins | novel | c.1173dupA | p.Ala392SerfsTer4 | p.A392Sfs*4 | O75928 | protein_coding | TCGA-D8-A1JG-01 | Breast | breast invasive carcinoma | Female | <65 | I/II | Chemotherapy | doxorubicin | SD | ||
| PIAS2 | deletion | Frame_Shift_Del | novel | c.1139delN | p.Lys380SerfsTer18 | p.K380Sfs*18 | O75928 | protein_coding | TCGA-EW-A2FV-01 | Breast | breast invasive carcinoma | Female | <65 | III/IV | Chemotherapy | docetaxel | SD | ||
| PIAS2 | SNV | Missense_Mutation | c.1438G>A | p.Glu480Lys | p.E480K | O75928 | protein_coding | deleterious(0.01) | benign(0.057) | TCGA-C5-A1ME-01 | Cervix | cervical & endocervical cancer | Female | <65 | I/II | Unknown | Unknown | SD | |
| PIAS2 | SNV | Missense_Mutation | novel | c.811N>C | p.Ser271Pro | p.S271P | O75928 | protein_coding | tolerated(1) | benign(0.09) | TCGA-AA-3984-01 | Colorectum | colon adenocarcinoma | Female | <65 | I/II | Unknown | Unknown | SD |
| PIAS2 | SNV | Missense_Mutation | c.1418N>T | p.Thr473Ile | p.T473I | O75928 | protein_coding | deleterious(0.01) | probably_damaging(0.984) | TCGA-AD-A5EJ-01 | Colorectum | colon adenocarcinoma | Female | >=65 | I/II | Unknown | Unknown | SD | |
| PIAS2 | SNV | Missense_Mutation | novel | c.1580N>T | p.Pro527Leu | p.P527L | O75928 | protein_coding | tolerated(0.13) | benign(0.012) | TCGA-AM-5820-01 | Colorectum | colon adenocarcinoma | Female | <65 | I/II | Unknown | Unknown | SD |
| PIAS2 | SNV | Missense_Mutation | c.674A>C | p.Asn225Thr | p.N225T | O75928 | protein_coding | tolerated(0.29) | benign(0.102) | TCGA-AY-A8YK-01 | Colorectum | colon adenocarcinoma | Male | <65 | I/II | Chemotherapy | 5-fu | CR |
| Page: 1 2 3 4 5 6 7 |
Top |
Related drugs of malignant transformation related genes |
| Identification of chemicals and drugs interact with genes involved in malignant transfromation |
| (DGIdb 4.0) |
| Entrez ID | Symbol | Category | Interaction Types | Drug Claim Name | Drug Name | PMIDs |
| Page: 1 |

Copyright 2023-Present -The University of Texas Health Science Center at Houston |