Schematic overview of the cellular and molecular mechanisms involved in the cancer progression, including the proposed cellular and molecular mechanisms in cancer cells trajectory. AT1: alveolar type 1 cells; AT2: alveolar type 2 cells; AAH: atypical adenomatous hyperplasia; AIS: adenocarcinoma in situ; MIA: minimally invasive adenocarcinoma; IA: invasive adenocarcinoma; EMT: epithelial-mesenchymal transition

Home

Download

Statistics

Help

Contact

Center for Computational Systems Medicine
leaf

Gene summary

leaf

Malignant transformation analysis

leaf

Malignant transformation related pathway analysis

leaf

Cell-cell communication analysis

leaf

Single-cell gene regulatory network inference analysis

leaf

Somatic mutation of malignant transformation related genes

leaf

Related drugs of malignant transformation related genes

Gene: PDZD11

Gene summary for PDZD11

check button Gene summary.

Gene informationSpeciesHuman
Gene symbol

PDZD11

Gene ID

51248

Gene namePDZ domain containing 11
Gene AliasAIPP1
CytomapXq13.1
Gene Typeprotein-coding
GO ID

GO:0001505

UniProtAcc

Q5EBL8


Top

Malignant transformation analysis

check button Identification of the aberrant gene expression in precancerous and cancerous lesions by comparing the gene expression of stem-like cells in diseased tissues with normal stem cells
check button Malignant transformation involving gene list.
Entrez IDSymbolReplicatesSpeciesOrganTissueAdj P-valueLog2FCMalignancy
51248PDZD11S028HumanLiverHCC6.93e-341.44e+000.2503
51248PDZD11S029HumanLiverHCC8.82e-391.72e+000.2581
51248PDZD11C04HumanOral cavityOSCC1.91e-301.74e+000.2633
51248PDZD11C21HumanOral cavityOSCC9.17e-572.03e+000.2678
51248PDZD11C30HumanOral cavityOSCC1.36e-562.82e+000.3055
51248PDZD11C38HumanOral cavityOSCC7.84e-171.55e+000.172
51248PDZD11C43HumanOral cavityOSCC1.77e-851.52e+000.1704
51248PDZD11C46HumanOral cavityOSCC5.67e-388.47e-010.1673
51248PDZD11C51HumanOral cavityOSCC2.22e-211.12e+000.2674
51248PDZD11C57HumanOral cavityOSCC4.35e-268.80e-010.1679
51248PDZD11C06HumanOral cavityOSCC2.69e-142.18e+000.2699
51248PDZD11C07HumanOral cavityOSCC1.12e-071.61e+000.2491
51248PDZD11C08HumanOral cavityOSCC2.16e-561.20e+000.1919
51248PDZD11C09HumanOral cavityOSCC2.84e-164.66e-010.1431
51248PDZD11LN22HumanOral cavityOSCC2.98e-111.26e+000.1733
51248PDZD11LN38HumanOral cavityOSCC3.56e-111.60e+000.168
51248PDZD11LN46HumanOral cavityOSCC1.13e-219.09e-010.1666
51248PDZD11LP15HumanOral cavityLP9.16e-071.05e+000.2174
51248PDZD11LP17HumanOral cavityLP1.36e-061.11e+000.2349
51248PDZD11SYSMH1HumanOral cavityOSCC1.46e-112.96e-010.1127
Page: 1 2 3 4 5 6 7 

check button Transcriptomic changes along malignancy continuum.
TissueExpression DynamicsAbbreviation
EsophagusThe image shows the transcriptomic changes along malignancy continuum.log2FC in expression of this searched gene in stem-like cells from each diseased tissue sample relative to stem-like cells in normal samples in each tissue plotted against the malignancy continuum. Samples are colored based on if they are from different disease stage.
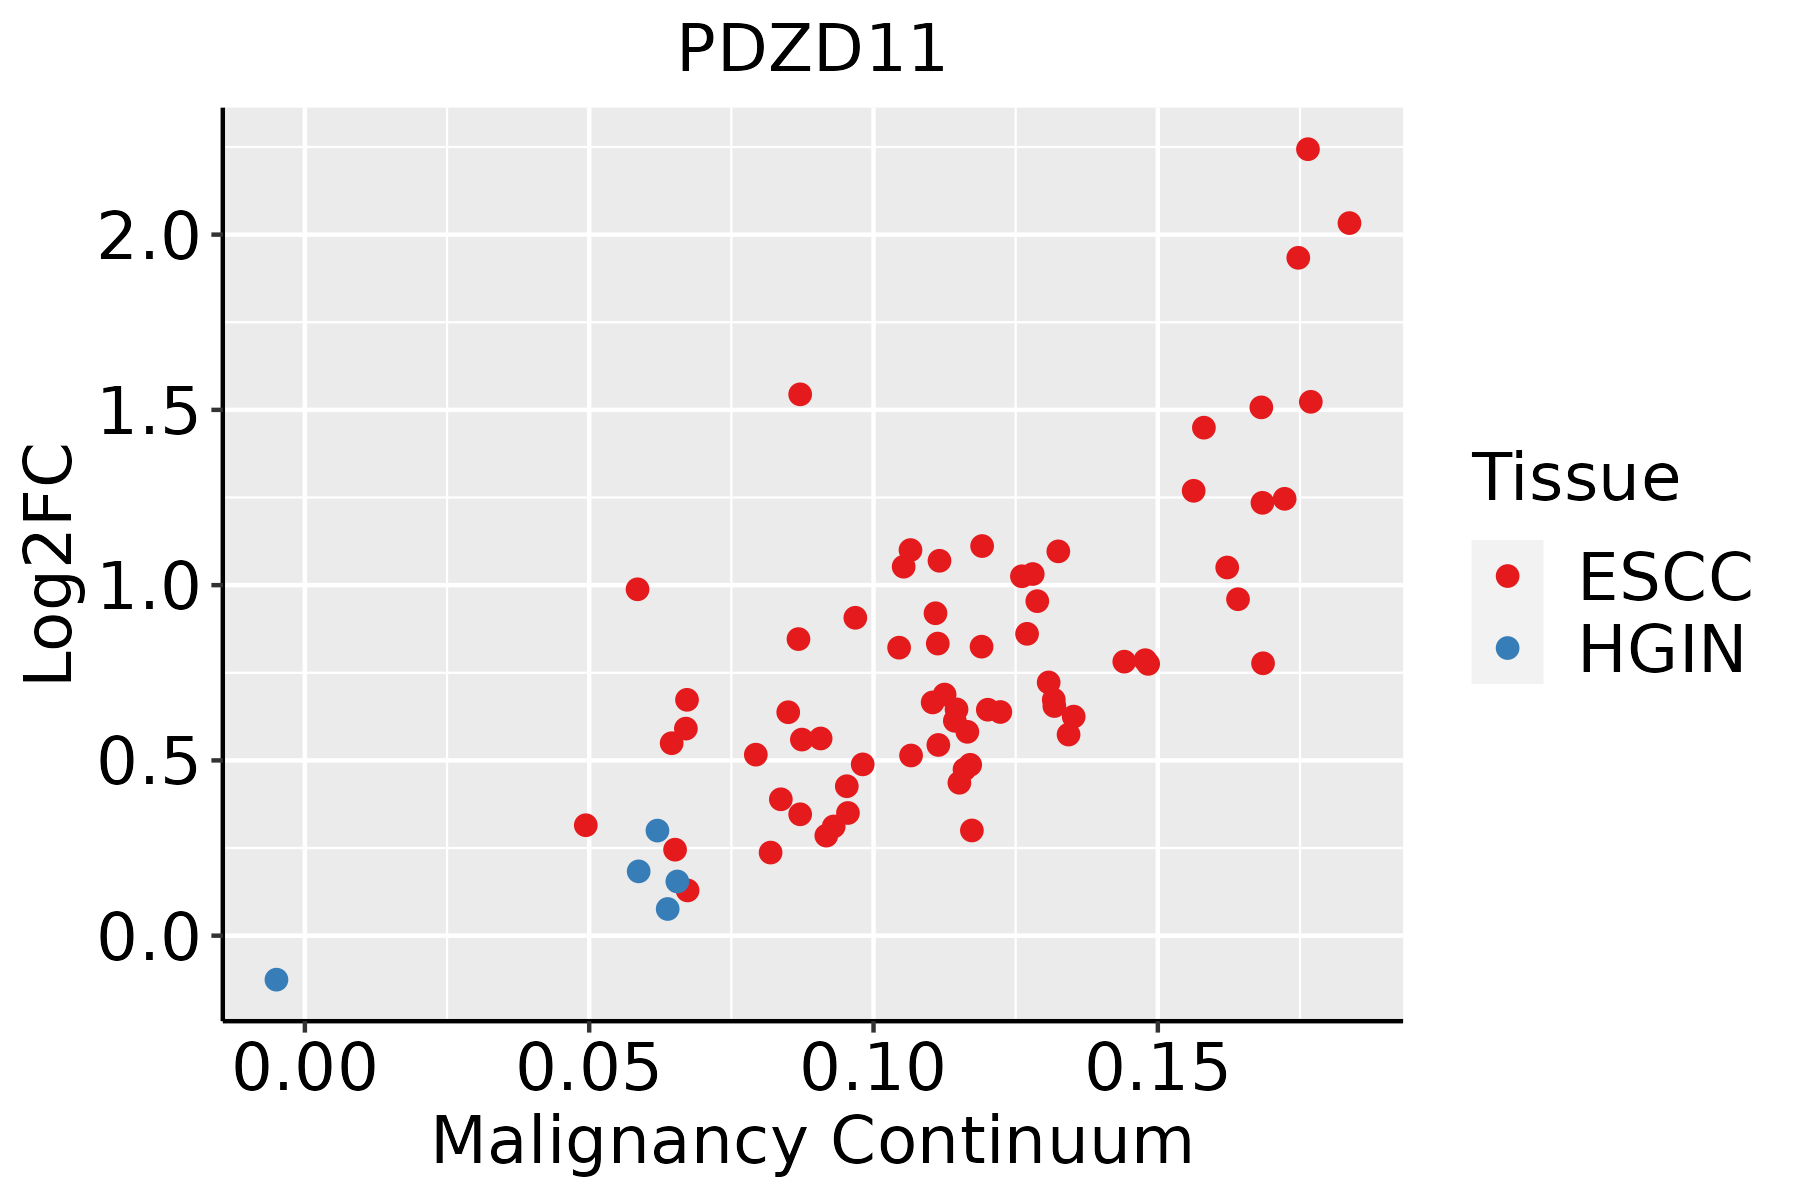
ESCC: Esophageal squamous cell carcinoma
HGIN: High-grade intraepithelial neoplasias
LGIN: Low-grade intraepithelial neoplasias
LiverThe image shows the transcriptomic changes along malignancy continuum.log2FC in expression of this searched gene in stem-like cells from each diseased tissue sample relative to stem-like cells in normal samples in each tissue plotted against the malignancy continuum. Samples are colored based on if they are from different disease stage.HCC: Hepatocellular carcinoma
NAFLD: Non-alcoholic fatty liver disease
Oral CavityThe image shows the transcriptomic changes along malignancy continuum.log2FC in expression of this searched gene in stem-like cells from each diseased tissue sample relative to stem-like cells in normal samples in each tissue plotted against the malignancy continuum. Samples are colored based on if they are from different disease stage.EOLP: Erosive Oral lichen planus
LP: leukoplakia
NEOLP: Non-erosive oral lichen planus
OSCC: Oral squamous cell carcinoma
SkinThe image shows the transcriptomic changes along malignancy continuum.log2FC in expression of this searched gene in stem-like cells from each diseased tissue sample relative to stem-like cells in normal samples in each tissue plotted against the malignancy continuum. Samples are colored based on if they are from different disease stage.
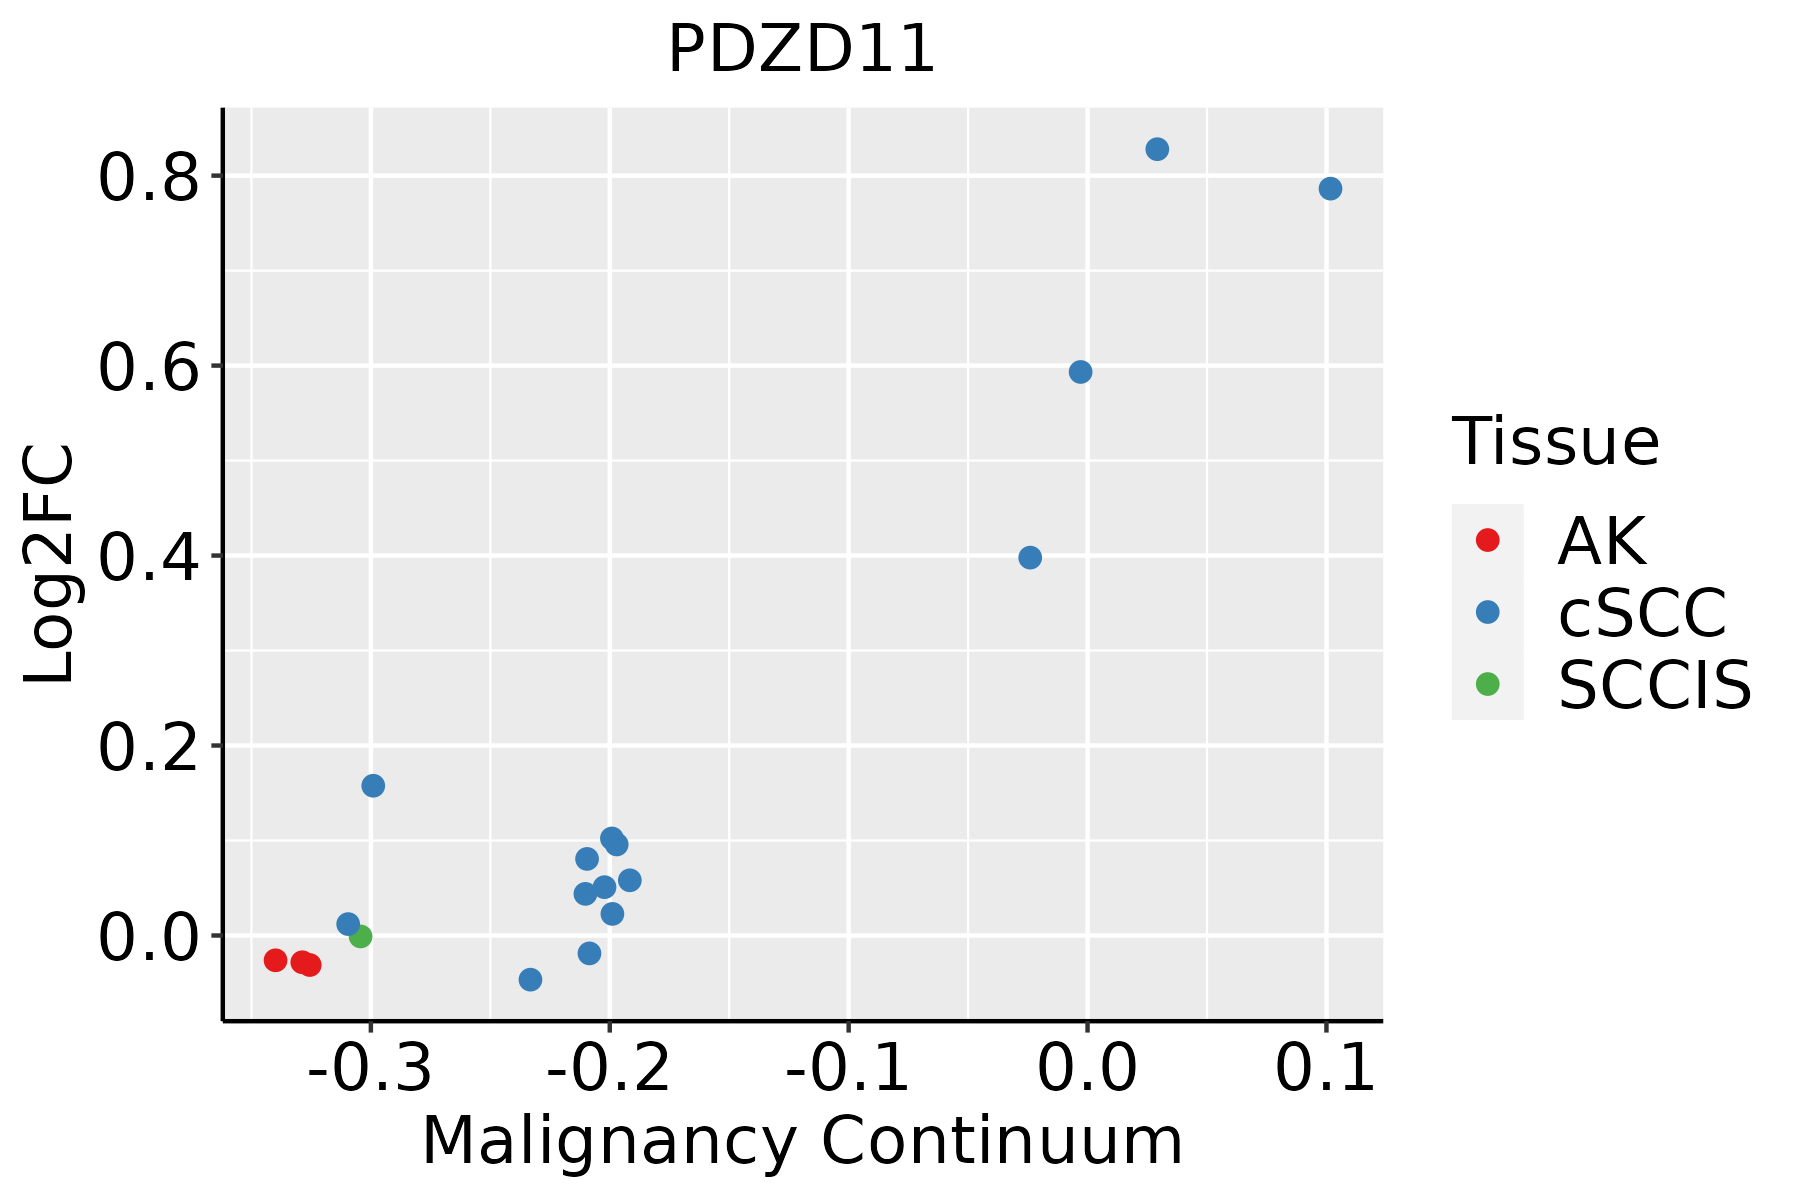
AK: Actinic keratosis
cSCC: Cutaneous squamous cell carcinoma
SCCIS:squamous cell carcinoma in situ
ThyroidThe image shows the transcriptomic changes along malignancy continuum.log2FC in expression of this searched gene in stem-like cells from each diseased tissue sample relative to stem-like cells in normal samples in each tissue plotted against the malignancy continuum. Samples are colored based on if they are from different disease stage.
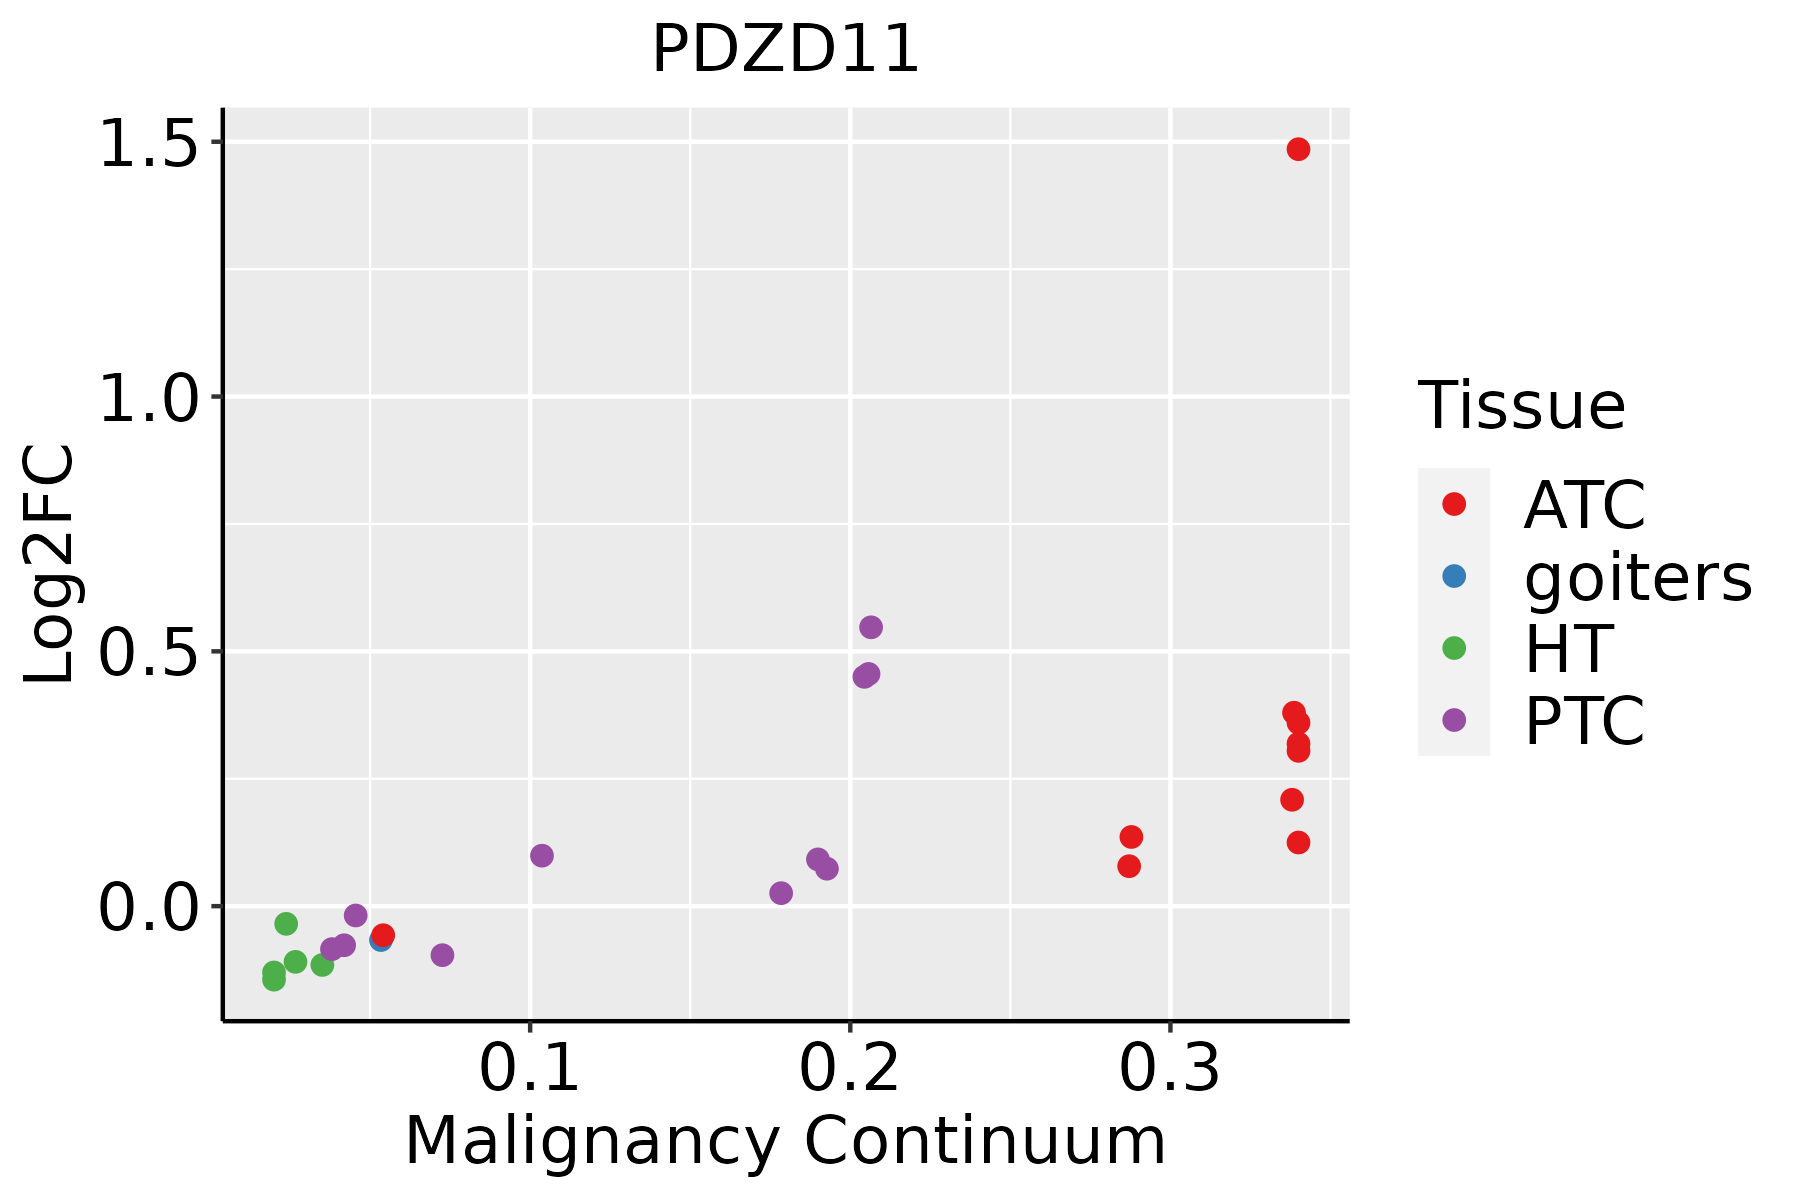
ATC: Anaplastic thyroid cancer
HT: Hashimoto's thyroiditis
PTC: Papillary thyroid cancer
∗log2FC in expression of this searched gene in stem-like cells from each diseased tissue sample relative to stem-like cells in normal samples in each tissue plotted against the malignancy continuum. Samples are colored based on if they are from different disease stage.

Top

Malignant transformation related pathway analysis

check buttonFind out the enriched GO biological processes and KEGG pathways involved in transition from healthy to precancer to cancer
check button Figure of enriched GO biological processes.
TissueDisease StageEnriched GO biological Processes
ColorectumADGO analysis - Figure of enriched GO biological processes: Top 15 enriched GO BP terms are showed in the bar plot of each disease state in each tissue. Each row represents a significant GO biological process which is colored according to the -log10(p.adjust).
ColorectumSERGO analysis - Figure of enriched GO biological processes: Top 15 enriched GO BP terms are showed in the bar plot of each disease state in each tissue. Each row represents a significant GO biological process which is colored according to the -log10(p.adjust).
ColorectumMSSGO analysis - Figure of enriched GO biological processes: Top 15 enriched GO BP terms are showed in the bar plot of each disease state in each tissue. Each row represents a significant GO biological process which is colored according to the -log10(p.adjust).
ColorectumMSI-HGO analysis - Figure of enriched GO biological processes: Top 15 enriched GO BP terms are showed in the bar plot of each disease state in each tissue. Each row represents a significant GO biological process which is colored according to the -log10(p.adjust).
ColorectumFAPGO analysis - Figure of enriched GO biological processes: Top 15 enriched GO BP terms are showed in the bar plot of each disease state in each tissue. Each row represents a significant GO biological process which is colored according to the -log10(p.adjust).
∗Top 15 enriched GO BP terms are showed in the bar plot of each disease state in each tissue. Each row represents a significant GO biological process which is colored according to the -log10(p.adjust).
Page: 1 2 3 4 5 6 7 8 9 

check button Enriched GO biological processes.
GO IDTissueDisease StageDescriptionGene RatioBg Ratiopvaluep.adjustCount
GO:199077819EsophagusESCCprotein localization to cell periphery217/8552333/187234.08e-131.88e-11217
GO:000716320EsophagusESCCestablishment or maintenance of cell polarity143/8552218/187232.05e-094.65e-08143
GO:00469316EsophagusESCCpore complex assembly16/855220/187231.85e-038.40e-0316
GO:00350888EsophagusESCCestablishment or maintenance of apical/basal cell polarity32/855249/187234.39e-031.73e-0232
GO:00612458EsophagusESCCestablishment or maintenance of bipolar cell polarity32/855249/187234.39e-031.73e-0232
GO:00451978EsophagusESCCestablishment or maintenance of epithelial cell apical/basal polarity29/855244/187235.41e-032.02e-0229
GO:199077811LiverCirrhoticprotein localization to cell periphery135/4634333/187231.18e-106.21e-09135
GO:000716312LiverCirrhoticestablishment or maintenance of cell polarity82/4634218/187231.55e-052.11e-0482
GO:0046931LiverCirrhoticpore complex assembly12/463420/187238.43e-046.12e-0312
GO:199077821LiverHCCprotein localization to cell periphery200/7958333/187236.07e-112.23e-09200
GO:000716322LiverHCCestablishment or maintenance of cell polarity133/7958218/187232.48e-085.73e-07133
GO:00469311LiverHCCpore complex assembly17/795820/187231.18e-049.87e-0417
GO:199077816Oral cavityOSCCprotein localization to cell periphery190/7305333/187231.46e-115.13e-10190
GO:000716318Oral cavityOSCCestablishment or maintenance of cell polarity129/7305218/187231.16e-092.86e-08129
GO:00469315Oral cavityOSCCpore complex assembly15/730520/187231.19e-035.99e-0315
GO:199077817Oral cavityLPprotein localization to cell periphery133/4623333/187234.42e-102.21e-08133
GO:000716319Oral cavityLPestablishment or maintenance of cell polarity79/4623218/187238.84e-051.11e-0379
GO:000716327SkincSCCestablishment or maintenance of cell polarity103/4864218/187239.44e-124.85e-10103
GO:199077824SkincSCCprotein localization to cell periphery134/4864333/187237.09e-092.30e-07134
GO:003508814SkincSCCestablishment or maintenance of apical/basal cell polarity26/486449/187234.78e-054.96e-0426
Page: 1 2 

check button Enriched KEGG pathways.
Pathway IDTissueDisease StageDescriptionGene RatioBg Ratiopvaluep.adjustqvalueCount
Page: 1 

Top

Cell-cell communication analysis

check buttonIdentification of potential cell-cell interactions between two cell types and their ligand-receptor pairs for different disease states
LigandReceptorLRpairPathwayTissueDisease Stage
Page: 1 

Top

Single-cell gene regulatory network inference analysis

check buttonFind out the significant the regulons (TFs) and the target genes of each regulon across cell types for different disease states
TFCell TypeTissueDisease StageTarget GeneRSSRegulon Activity
∗The dot plots of a searched regulon are shown for all cell subpopulations in each disease state of each tissue based on the regulon specific score inferred using pySCENIC and by calculating the average expression.
Page: 1 

Top

Somatic mutation of malignant transformation related genes

check buttonAnnotation of somatic variants for genes involved in malignant transformation
Hugo SymbolVariant ClassVariant ClassificationdbSNP RSHGVScHGVSpHGVSp ShortSWISSPROTBIOTYPESIFTPolyPhenTumor Sample BarcodeTissueHistologySexAgeStageTherapy TypesDrugsOutcome
PDZD11insertionFrame_Shift_Insnovelc.136_137insATTCTGTGCTCTTGTCTTACAGTTGGGATTTAACATCCGAGGAGp.Arg46HisfsTer20p.R46Hfs*20Q5EBL8protein_codingTCGA-A8-A07R-01Breastbreast invasive carcinomaFemale>=65III/IVAncillaryzoledronicSD
PDZD11insertionIn_Frame_Insnovelc.177_178insGATAAGCAGGCCAATCGTp.Gly59_Phe60insAspLysGlnAlaAsnArgp.G59_F60insDKQANRQ5EBL8protein_codingTCGA-BH-A0E2-01Breastbreast invasive carcinomaFemale<65III/IVChemotherapydoxorubicinSD
PDZD11SNVMissense_Mutationrs751113363c.367N>Tp.Arg123Cysp.R123CQ5EBL8protein_codingtolerated(0.14)possibly_damaging(0.465)TCGA-2W-A8YY-01Cervixcervical & endocervical cancerFemale<65I/IIChemotherapycisplatinCR
PDZD11SNVMissense_Mutationc.188N>Ap.Arg63Glnp.R63QQ5EBL8protein_codingtolerated(0.11)benign(0.003)TCGA-A6-6781-01Colorectumcolon adenocarcinomaMale<65III/IVChemotherapyoxaliplatinSD
PDZD11SNVMissense_Mutationnovelc.98N>Gp.His33Argp.H33RQ5EBL8protein_codingtolerated(0.05)benign(0.047)TCGA-AA-3811-01Colorectumcolon adenocarcinomaFemale>=65III/IVUnknownUnknownPD
PDZD11SNVMissense_Mutationrs751113363c.367N>Tp.Arg123Cysp.R123CQ5EBL8protein_codingtolerated(0.14)possibly_damaging(0.465)TCGA-AA-A022-01Colorectumcolon adenocarcinomaFemale>=65I/IIUnknownUnknownSD
PDZD11SNVMissense_Mutationnovelc.125N>Tp.Gln42Leup.Q42LQ5EBL8protein_codingtolerated(0.08)benign(0.031)TCGA-AA-A02R-01Colorectumcolon adenocarcinomaFemale>=65I/IIUnknownUnknownPD
PDZD11SNVMissense_Mutationnovelc.323G>Ap.Ser108Asnp.S108NQ5EBL8protein_codingtolerated(0.12)benign(0.13)TCGA-AP-A1DK-01Endometriumuterine corpus endometrioid carcinomaFemale<65I/IIUnknownUnknownSD
PDZD11SNVMissense_Mutationc.111C>Ap.Asn37Lysp.N37KQ5EBL8protein_codingdeleterious(0.02)probably_damaging(0.968)TCGA-B5-A0JN-01Endometriumuterine corpus endometrioid carcinomaFemale>=65III/IVChemotherapypaclitaxelSD
PDZD11SNVMissense_Mutationnovelc.374G>Ap.Arg125Hisp.R125HQ5EBL8protein_codingdeleterious(0)possibly_damaging(0.673)TCGA-B5-A3FA-01Endometriumuterine corpus endometrioid carcinomaFemale>=65I/IIUnknownUnknownSD
Page: 1 2 

Top

Related drugs of malignant transformation related genes

check buttonIdentification of chemicals and drugs interact with genes involved in malignant transfromation
(DGIdb 4.0)
Entrez IDSymbolCategoryInteraction TypesDrug Claim NameDrug NamePMIDs
Page: 1