| Tissue | Expression Dynamics | Abbreviation |
| Cervix | 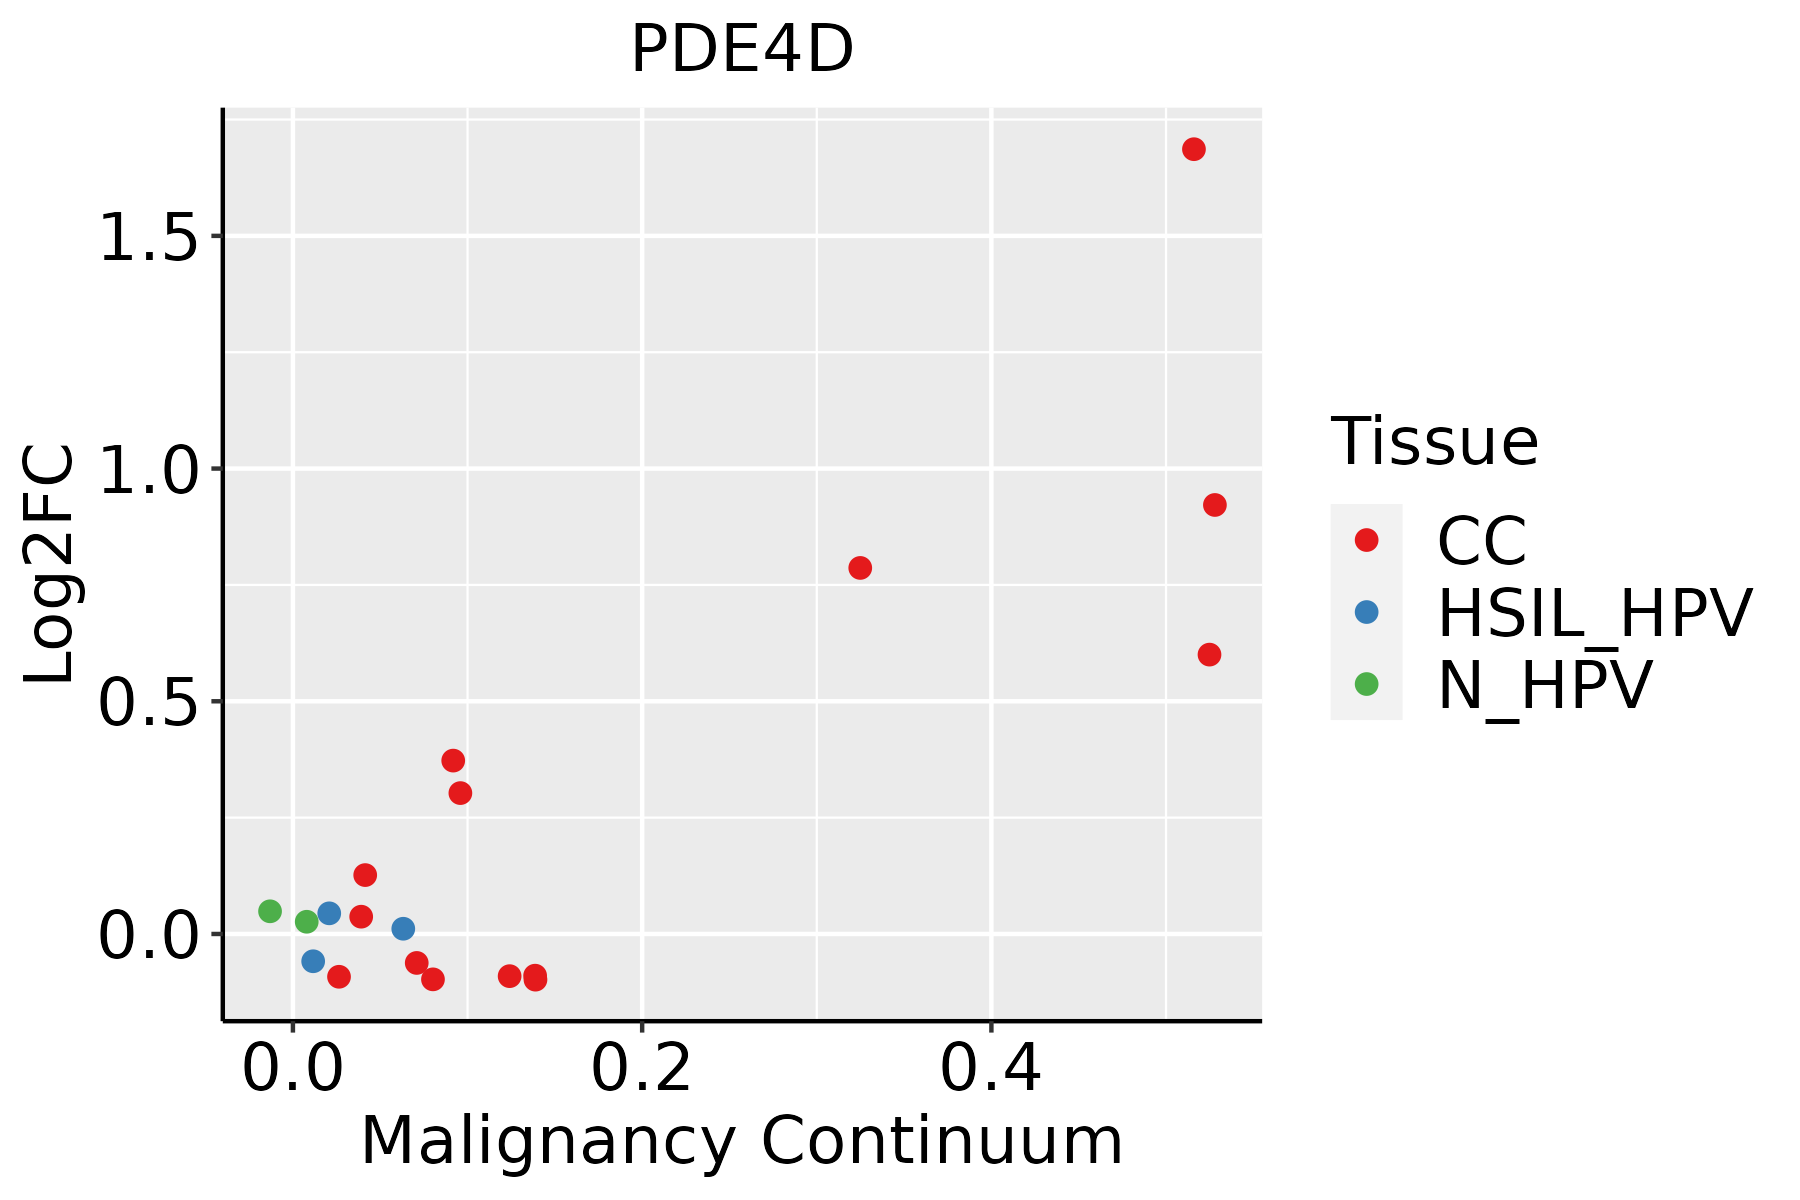 | CC: Cervix cancer |
| HSIL_HPV: HPV-infected high-grade squamous intraepithelial lesions |
| N_HPV: HPV-infected normal cervix |
| Colorectum (GSE201348) |  | FAP: Familial adenomatous polyposis |
| CRC: Colorectal cancer |
| Colorectum (HTA11) |  | AD: Adenomas |
| SER: Sessile serrated lesions |
| MSI-H: Microsatellite-high colorectal cancer |
| MSS: Microsatellite stable colorectal cancer |
| Endometrium | 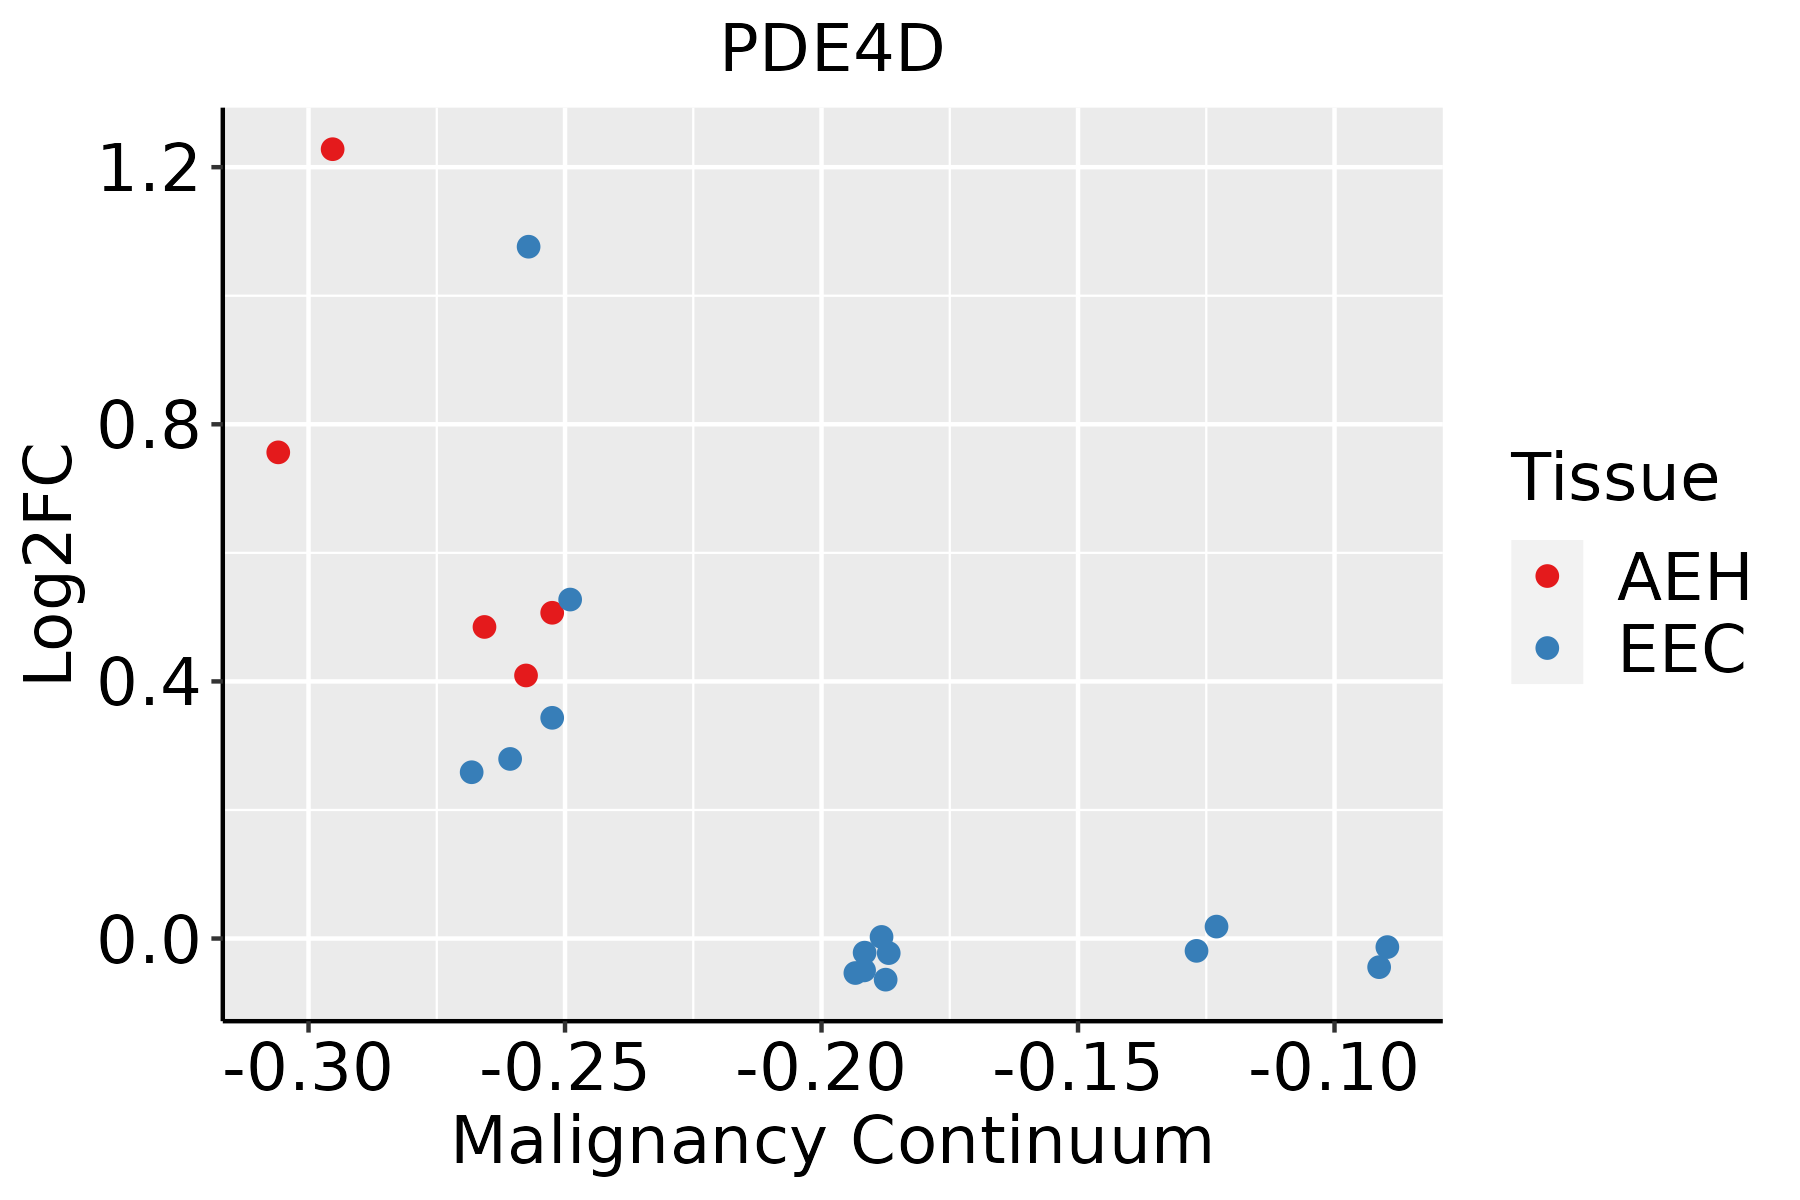 | AEH: Atypical endometrial hyperplasia |
| EEC: Endometrioid Cancer |
| Esophagus | 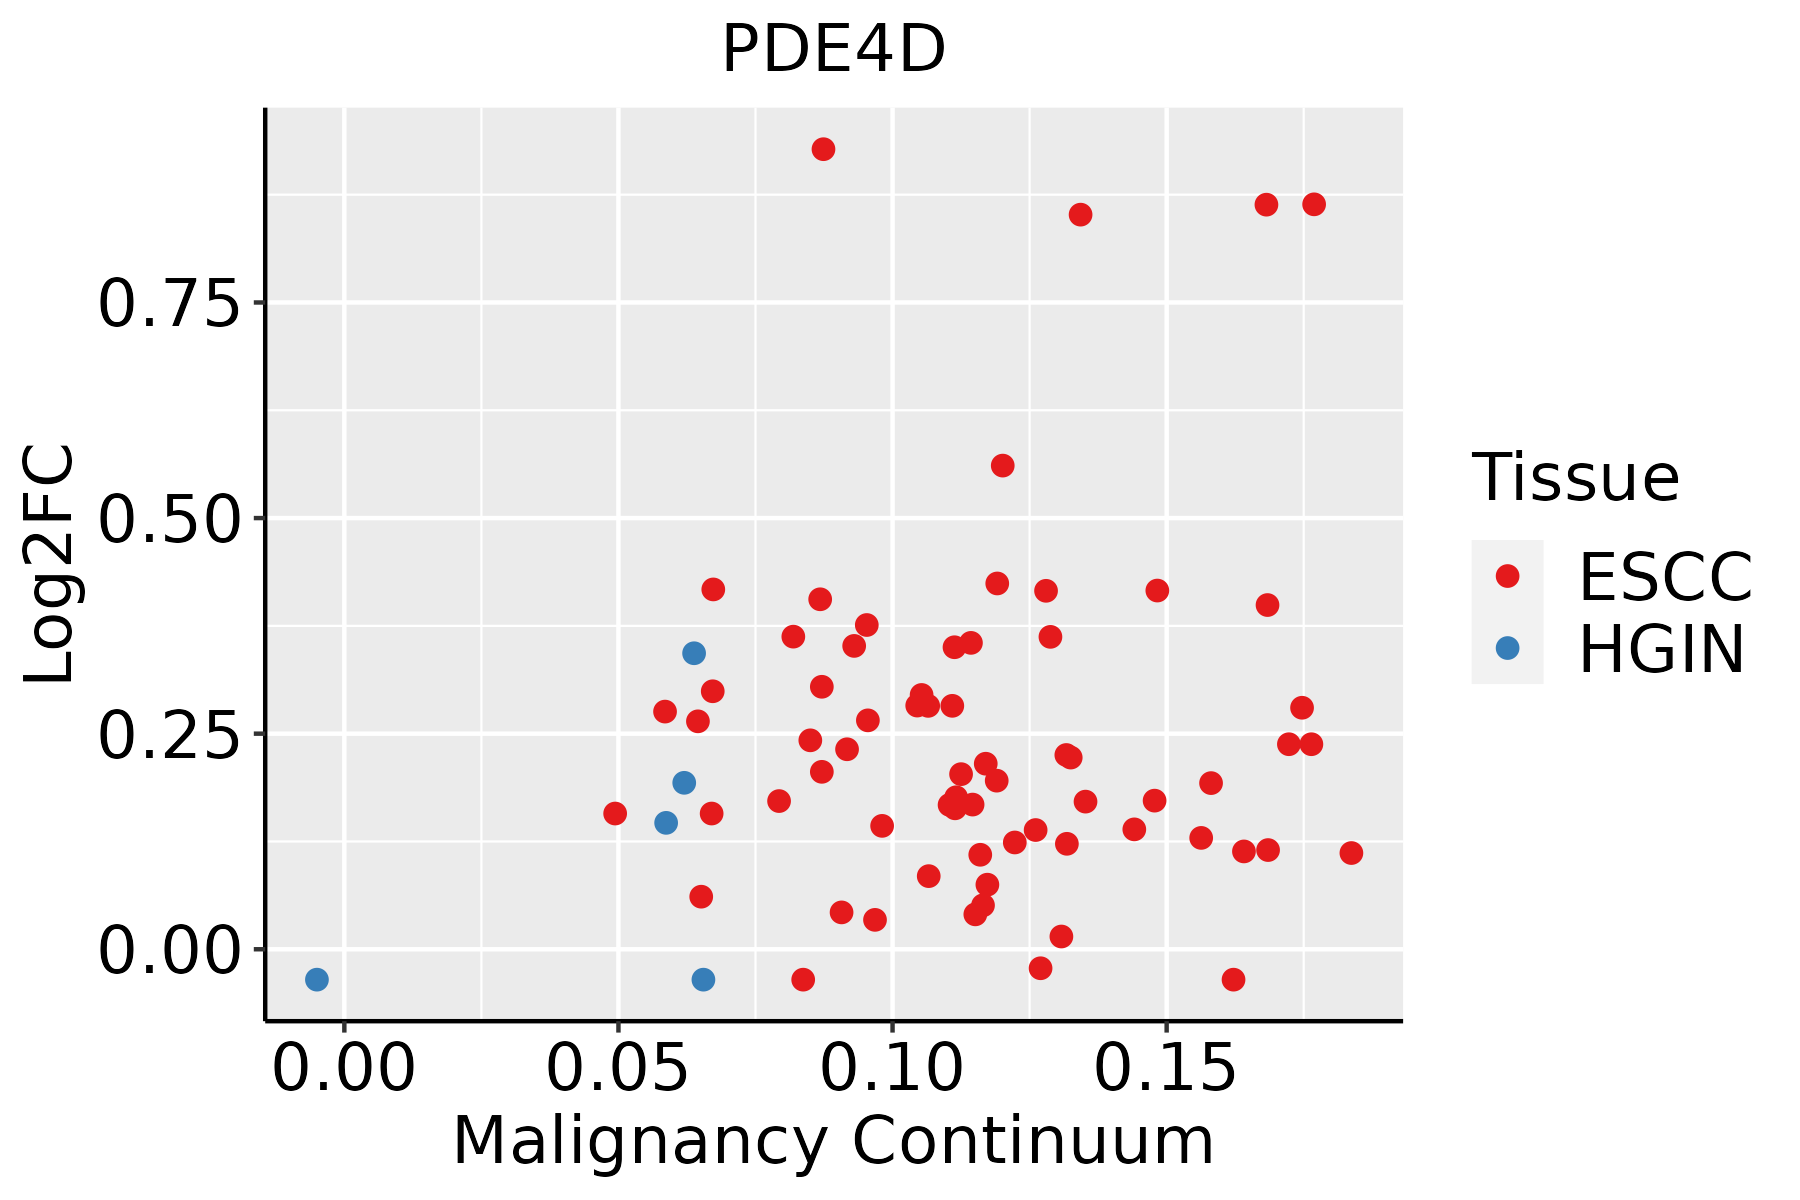 | ESCC: Esophageal squamous cell carcinoma |
| HGIN: High-grade intraepithelial neoplasias |
| LGIN: Low-grade intraepithelial neoplasias |
| GC | 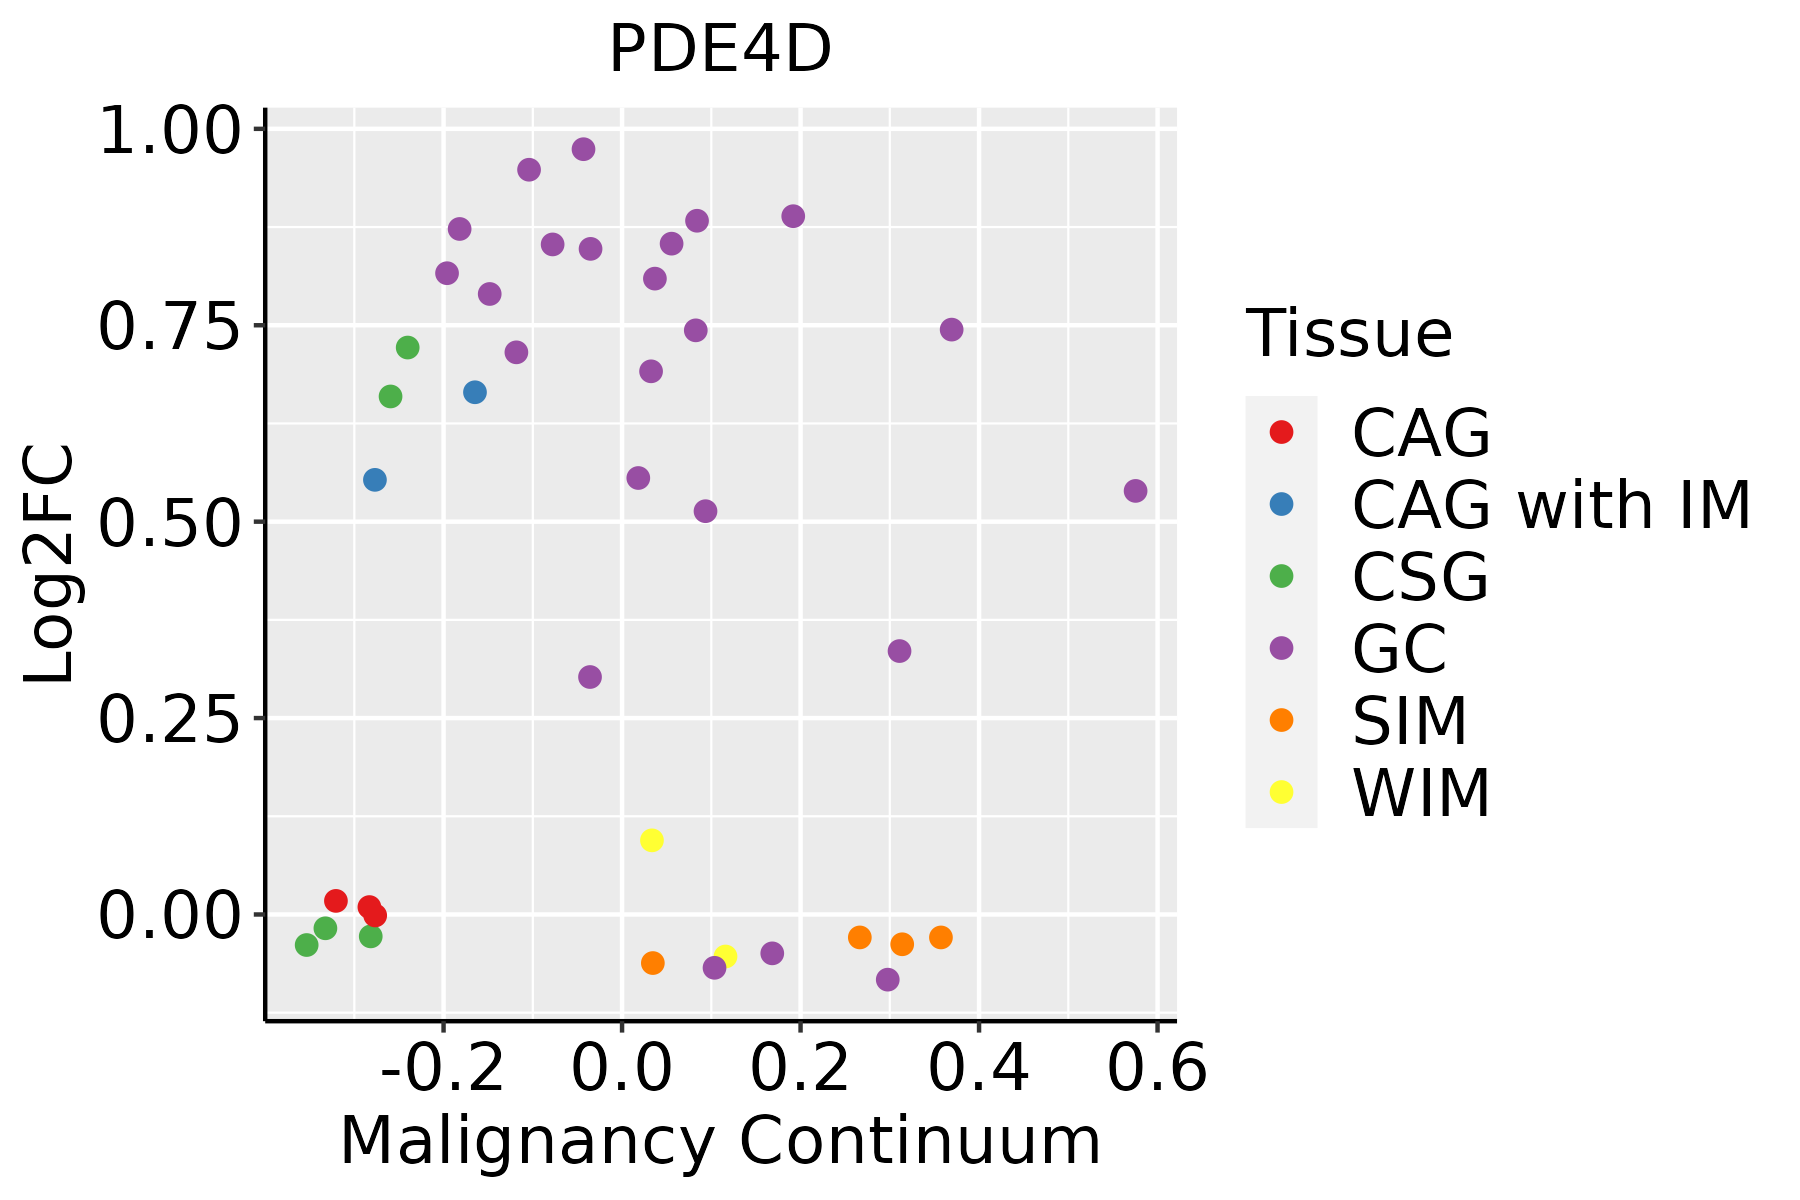 | CAG: Chronic atrophic gastritis |
| CAG with IM: Chronic atrophic gastritis with intestinal metaplasia |
| CSG: Chronic superficial gastritis |
| GC: Gastric cancer |
| SIM: Severe intestinal metaplasia |
| WIM: Wild intestinal metaplasia |
| Liver | 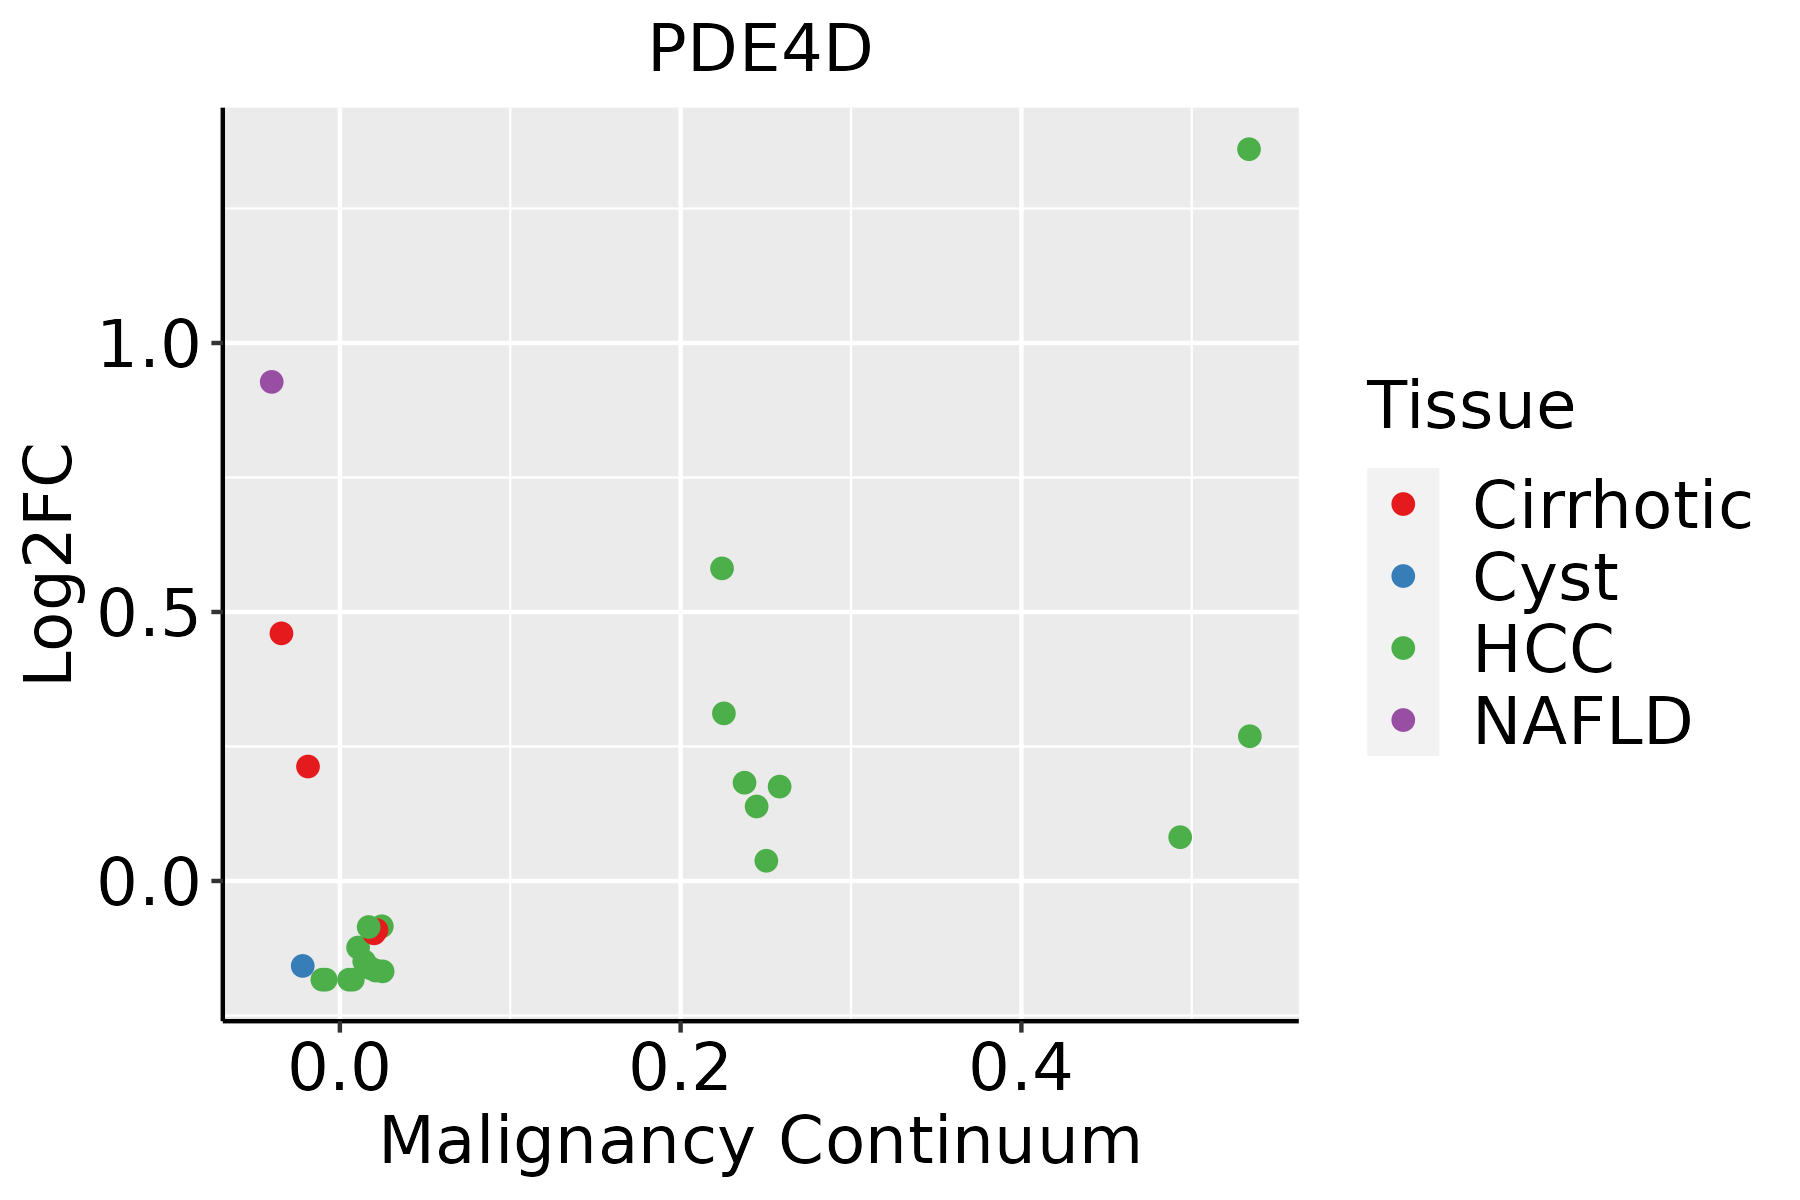 | HCC: Hepatocellular carcinoma |
| NAFLD: Non-alcoholic fatty liver disease |
| Lung | 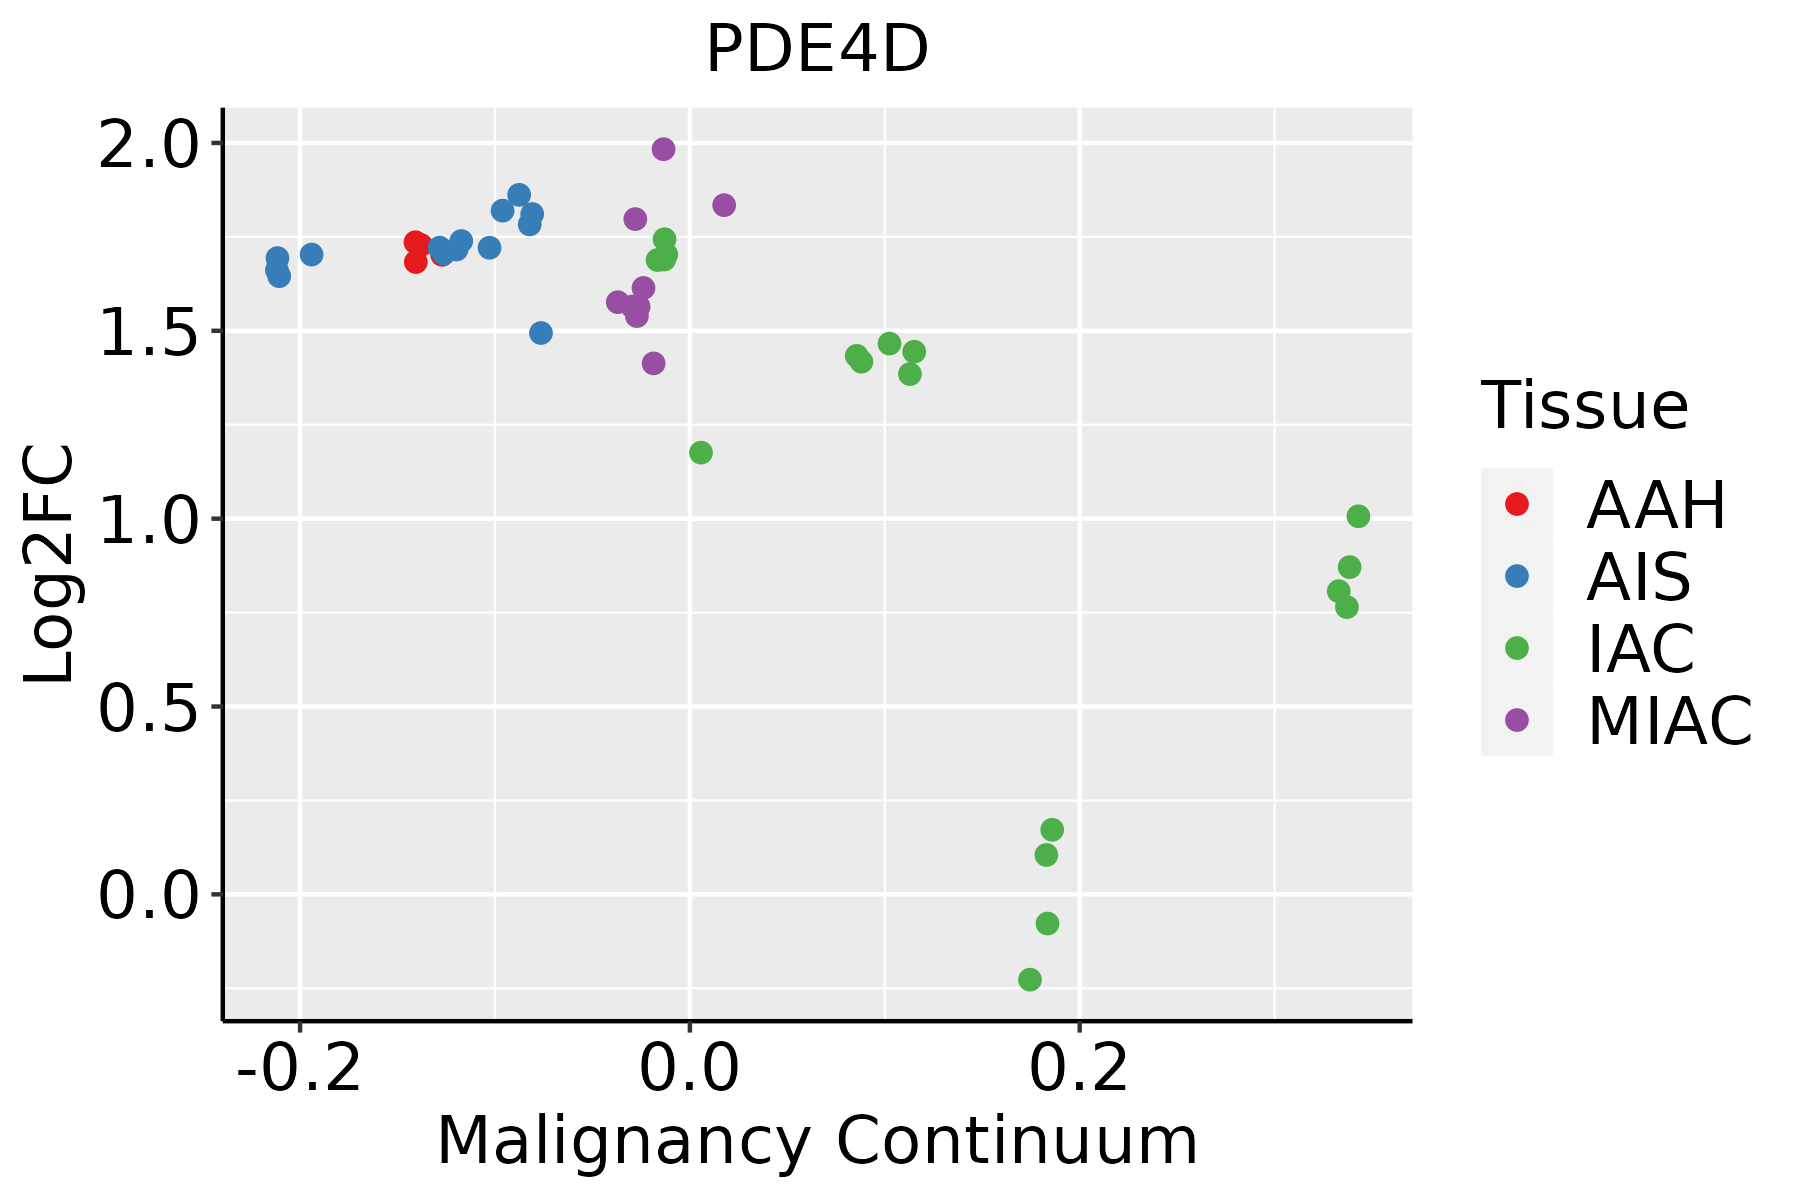 | AAH: Atypical adenomatous hyperplasia |
| AIS: Adenocarcinoma in situ |
| IAC: Invasive lung adenocarcinoma |
| MIA: Minimally invasive adenocarcinoma |
| Prostate | 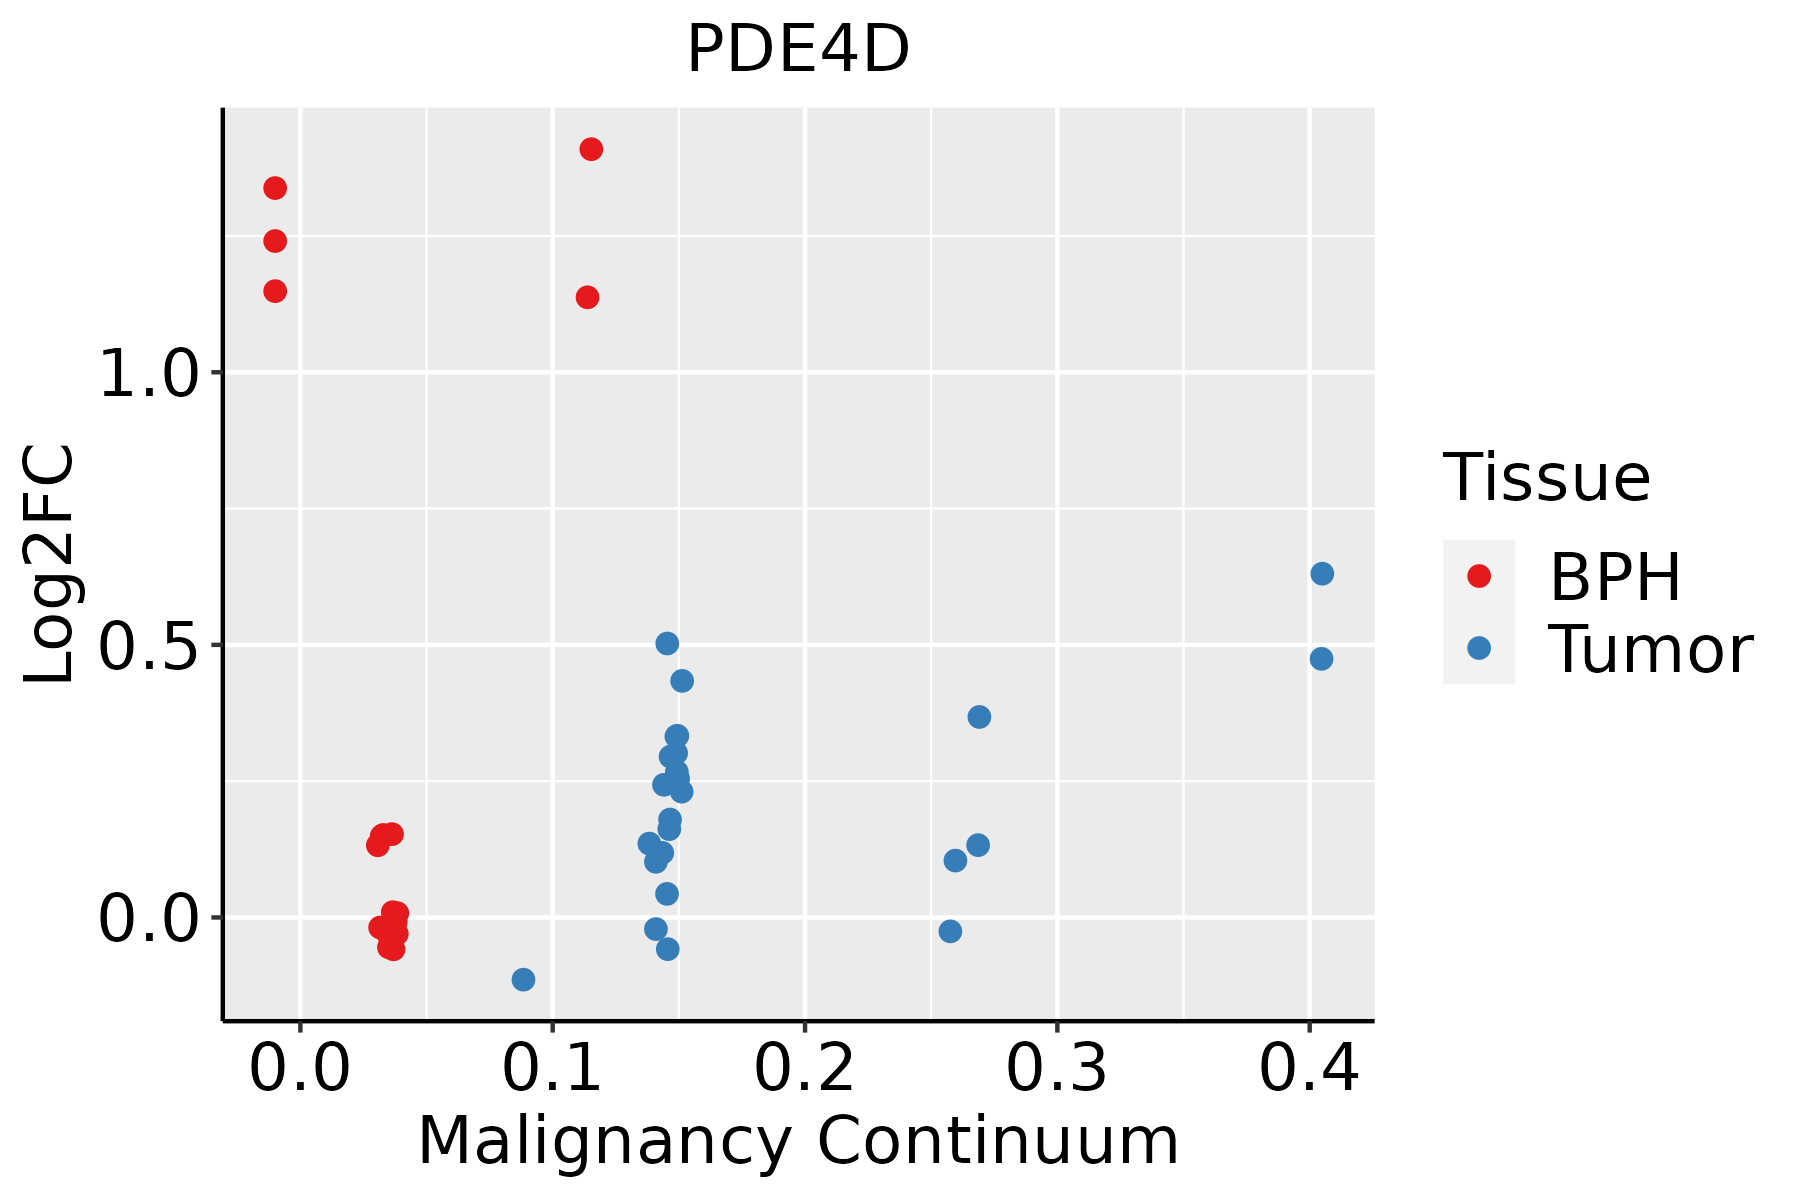 | BPH: Benign Prostatic Hyperplasia |
| Skin | 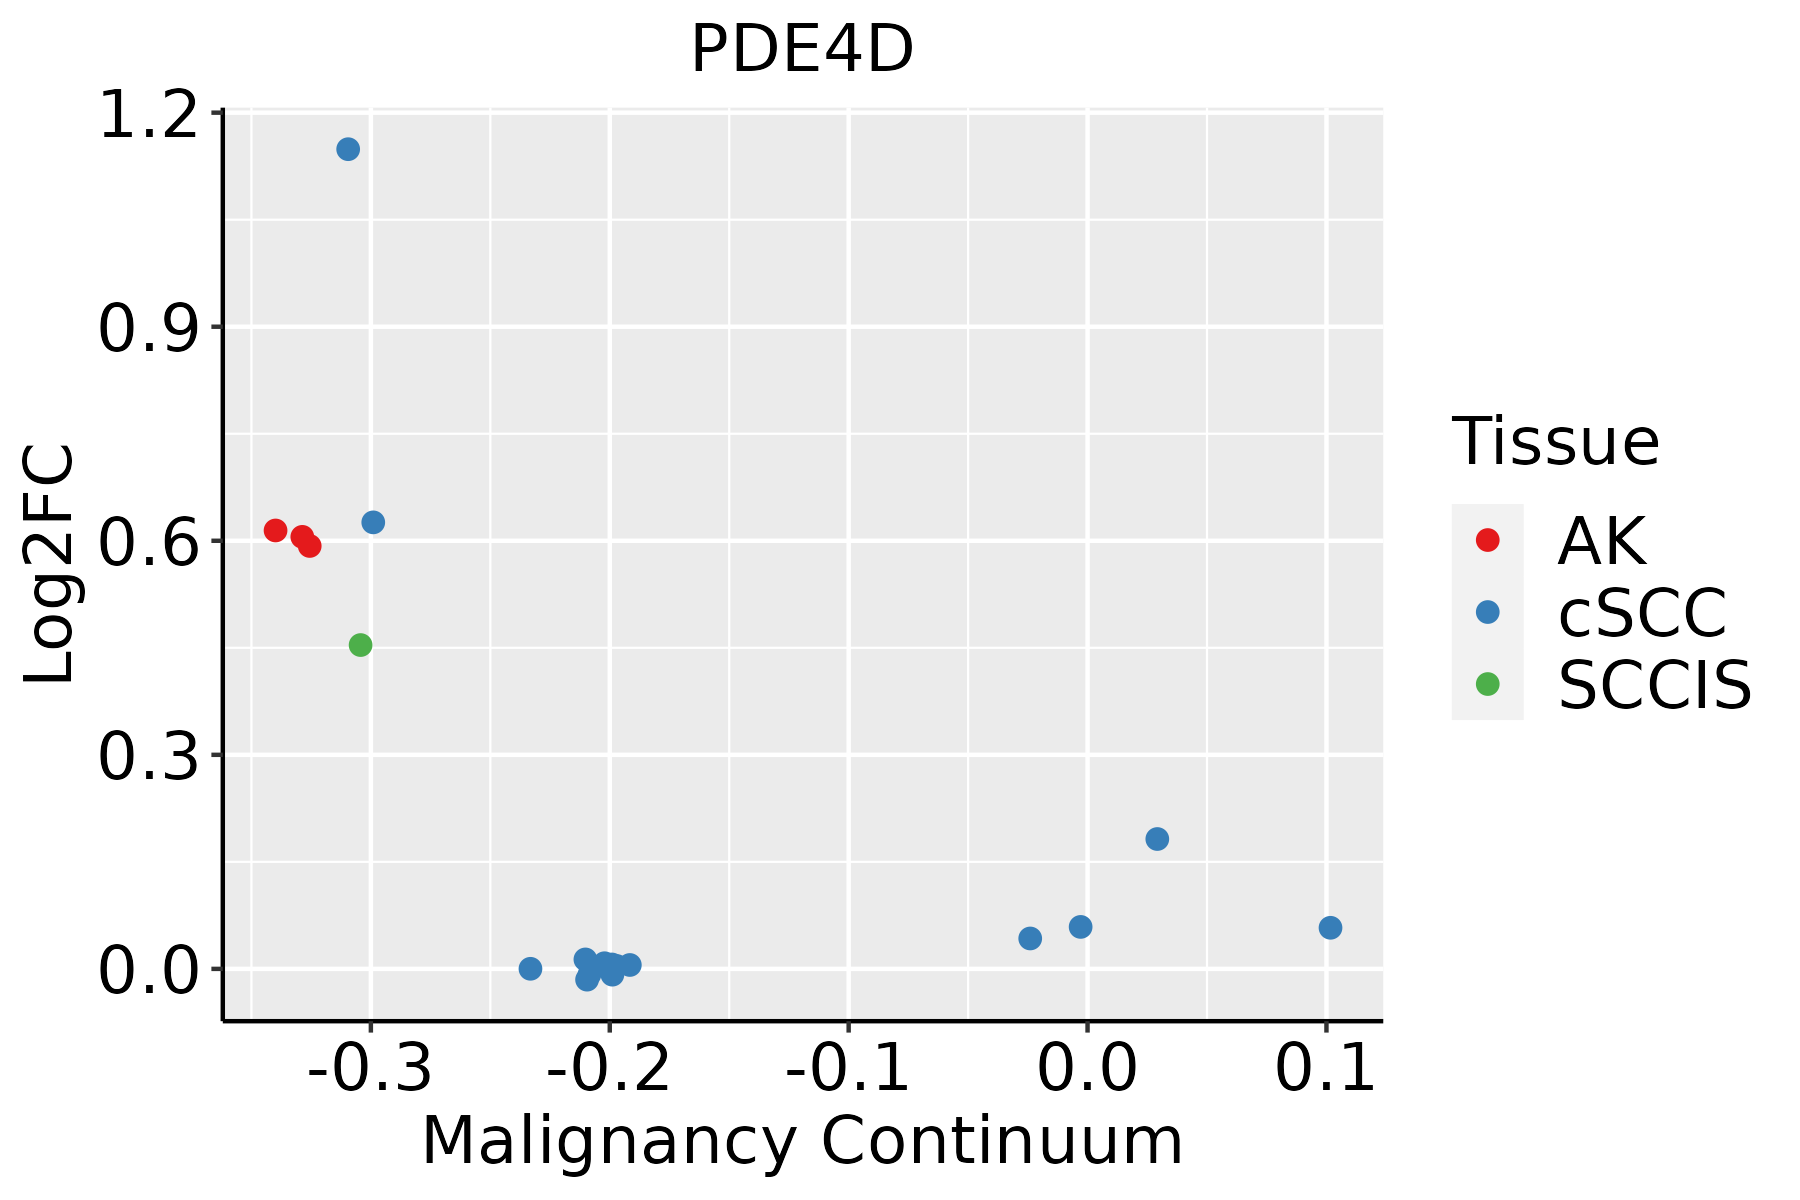 | AK: Actinic keratosis |
| cSCC: Cutaneous squamous cell carcinoma |
| SCCIS:squamous cell carcinoma in situ |
| Thyroid | 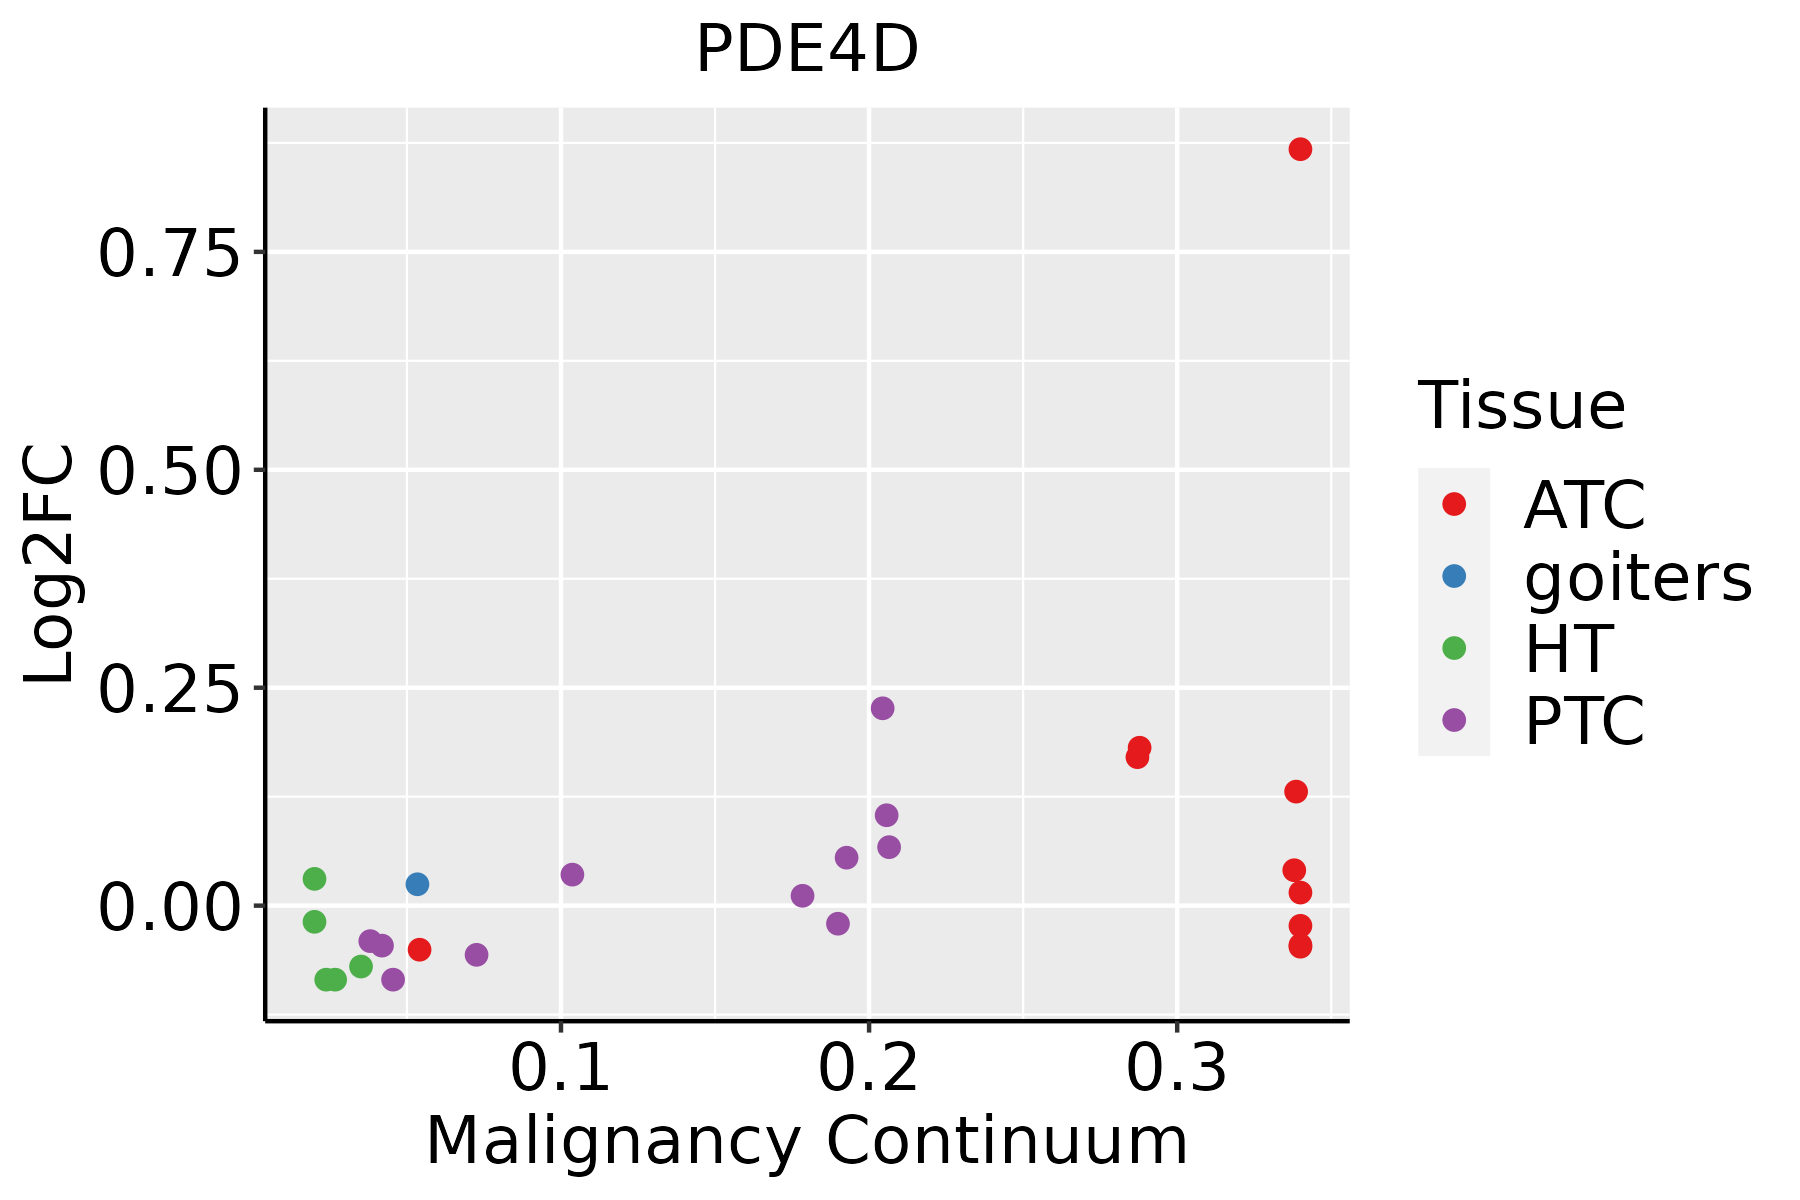 | ATC: Anaplastic thyroid cancer |
| HT: Hashimoto's thyroiditis |
| PTC: Papillary thyroid cancer |
| GO ID | Tissue | Disease Stage | Description | Gene Ratio | Bg Ratio | pvalue | p.adjust | Count |
| GO:003297010 | Cervix | CC | regulation of actin filament-based process | 96/2311 | 397/18723 | 4.00e-11 | 8.54e-09 | 96 |
| GO:00512359 | Cervix | CC | maintenance of location | 78/2311 | 327/18723 | 5.18e-09 | 4.92e-07 | 78 |
| GO:005165110 | Cervix | CC | maintenance of location in cell | 55/2311 | 214/18723 | 6.63e-08 | 3.85e-06 | 55 |
| GO:00027644 | Cervix | CC | immune response-regulating signaling pathway | 97/2311 | 468/18723 | 1.49e-07 | 7.07e-06 | 97 |
| GO:00018197 | Cervix | CC | positive regulation of cytokine production | 95/2311 | 467/18723 | 4.88e-07 | 1.85e-05 | 95 |
| GO:004593610 | Cervix | CC | negative regulation of phosphate metabolic process | 88/2311 | 441/18723 | 2.92e-06 | 8.27e-05 | 88 |
| GO:001056310 | Cervix | CC | negative regulation of phosphorus metabolic process | 88/2311 | 442/18723 | 3.21e-06 | 8.77e-05 | 88 |
| GO:004232610 | Cervix | CC | negative regulation of phosphorylation | 77/2311 | 385/18723 | 1.09e-05 | 2.38e-04 | 77 |
| GO:000193310 | Cervix | CC | negative regulation of protein phosphorylation | 69/2311 | 342/18723 | 2.29e-05 | 4.01e-04 | 69 |
| GO:00181057 | Cervix | CC | peptidyl-serine phosphorylation | 63/2311 | 315/18723 | 6.65e-05 | 9.47e-04 | 63 |
| GO:00022533 | Cervix | CC | activation of immune response | 72/2311 | 375/18723 | 8.26e-05 | 1.11e-03 | 72 |
| GO:00182096 | Cervix | CC | peptidyl-serine modification | 66/2311 | 338/18723 | 9.58e-05 | 1.25e-03 | 66 |
| GO:00106444 | Cervix | CC | cell communication by electrical coupling | 12/2311 | 32/18723 | 2.53e-04 | 2.79e-03 | 12 |
| GO:00106494 | Cervix | CC | regulation of cell communication by electrical coupling | 8/2311 | 16/18723 | 2.73e-04 | 2.99e-03 | 8 |
| GO:00467008 | Cervix | CC | heterocycle catabolic process | 80/2311 | 445/18723 | 3.23e-04 | 3.42e-03 | 80 |
| GO:00346559 | Cervix | CC | nucleobase-containing compound catabolic process | 74/2311 | 407/18723 | 3.77e-04 | 3.88e-03 | 74 |
| GO:000206410 | Cervix | CC | epithelial cell development | 45/2311 | 220/18723 | 4.14e-04 | 4.21e-03 | 45 |
| GO:00196939 | Cervix | CC | ribose phosphate metabolic process | 72/2311 | 396/18723 | 4.49e-04 | 4.48e-03 | 72 |
| GO:00092599 | Cervix | CC | ribonucleotide metabolic process | 70/2311 | 385/18723 | 5.35e-04 | 5.18e-03 | 70 |
| GO:0002768 | Cervix | CC | immune response-regulating cell surface receptor signaling pathway | 59/2311 | 315/18723 | 6.64e-04 | 6.11e-03 | 59 |
| Pathway ID | Tissue | Disease Stage | Description | Gene Ratio | Bg Ratio | pvalue | p.adjust | qvalue | Count |
| hsa0492812 | Cervix | CC | Parathyroid hormone synthesis, secretion and action | 27/1267 | 106/8465 | 3.12e-03 | 1.19e-02 | 7.03e-03 | 27 |
| hsa0492813 | Cervix | CC | Parathyroid hormone synthesis, secretion and action | 27/1267 | 106/8465 | 3.12e-03 | 1.19e-02 | 7.03e-03 | 27 |
| hsa04928 | Colorectum | AD | Parathyroid hormone synthesis, secretion and action | 38/2092 | 106/8465 | 6.60e-03 | 2.77e-02 | 1.76e-02 | 38 |
| hsa049281 | Colorectum | AD | Parathyroid hormone synthesis, secretion and action | 38/2092 | 106/8465 | 6.60e-03 | 2.77e-02 | 1.76e-02 | 38 |
| hsa049282 | Colorectum | SER | Parathyroid hormone synthesis, secretion and action | 31/1580 | 106/8465 | 5.20e-03 | 3.28e-02 | 2.38e-02 | 31 |
| hsa049283 | Colorectum | SER | Parathyroid hormone synthesis, secretion and action | 31/1580 | 106/8465 | 5.20e-03 | 3.28e-02 | 2.38e-02 | 31 |
| hsa049284 | Colorectum | MSS | Parathyroid hormone synthesis, secretion and action | 37/1875 | 106/8465 | 1.72e-03 | 9.13e-03 | 5.59e-03 | 37 |
| hsa049285 | Colorectum | MSS | Parathyroid hormone synthesis, secretion and action | 37/1875 | 106/8465 | 1.72e-03 | 9.13e-03 | 5.59e-03 | 37 |
| hsa049286 | Colorectum | FAP | Parathyroid hormone synthesis, secretion and action | 29/1404 | 106/8465 | 3.37e-03 | 1.44e-02 | 8.77e-03 | 29 |
| hsa04024 | Colorectum | FAP | cAMP signaling pathway | 51/1404 | 225/8465 | 1.02e-02 | 3.68e-02 | 2.24e-02 | 51 |
| hsa049287 | Colorectum | FAP | Parathyroid hormone synthesis, secretion and action | 29/1404 | 106/8465 | 3.37e-03 | 1.44e-02 | 8.77e-03 | 29 |
| hsa040241 | Colorectum | FAP | cAMP signaling pathway | 51/1404 | 225/8465 | 1.02e-02 | 3.68e-02 | 2.24e-02 | 51 |
| hsa040242 | Colorectum | CRC | cAMP signaling pathway | 47/1091 | 225/8465 | 4.57e-04 | 4.77e-03 | 3.23e-03 | 47 |
| hsa049288 | Colorectum | CRC | Parathyroid hormone synthesis, secretion and action | 24/1091 | 106/8465 | 3.71e-03 | 2.29e-02 | 1.55e-02 | 24 |
| hsa040243 | Colorectum | CRC | cAMP signaling pathway | 47/1091 | 225/8465 | 4.57e-04 | 4.77e-03 | 3.23e-03 | 47 |
| hsa049289 | Colorectum | CRC | Parathyroid hormone synthesis, secretion and action | 24/1091 | 106/8465 | 3.71e-03 | 2.29e-02 | 1.55e-02 | 24 |
| hsa0492816 | Esophagus | ESCC | Parathyroid hormone synthesis, secretion and action | 66/4205 | 106/8465 | 5.86e-03 | 1.47e-02 | 7.51e-03 | 66 |
| hsa0492817 | Esophagus | ESCC | Parathyroid hormone synthesis, secretion and action | 66/4205 | 106/8465 | 5.86e-03 | 1.47e-02 | 7.51e-03 | 66 |
| hsa0492810 | Lung | IAC | Parathyroid hormone synthesis, secretion and action | 26/1053 | 106/8465 | 4.34e-04 | 4.03e-03 | 2.68e-03 | 26 |
| hsa0492811 | Lung | IAC | Parathyroid hormone synthesis, secretion and action | 26/1053 | 106/8465 | 4.34e-04 | 4.03e-03 | 2.68e-03 | 26 |
| Hugo Symbol | Variant Class | Variant Classification | dbSNP RS | HGVSc | HGVSp | HGVSp Short | SWISSPROT | BIOTYPE | SIFT | PolyPhen | Tumor Sample Barcode | Tissue | Histology | Sex | Age | Stage | Therapy Types | Drugs | Outcome |
| PDE4D | SNV | Missense_Mutation | | c.647T>C | p.Ile216Thr | p.I216T | Q08499 | protein_coding | tolerated_low_confidence(0.29) | possibly_damaging(0.84) | TCGA-A8-A09C-01 | Breast | breast invasive carcinoma | Female | >=65 | I/II | Unknown | Unknown | SD |
| PDE4D | SNV | Missense_Mutation | | c.1895N>A | p.Arg632His | p.R632H | Q08499 | protein_coding | deleterious_low_confidence(0) | probably_damaging(0.985) | TCGA-A8-A09Z-01 | Breast | breast invasive carcinoma | Female | >=65 | I/II | Unknown | Unknown | SD |
| PDE4D | SNV | Missense_Mutation | | c.1904N>T | p.Thr635Met | p.T635M | Q08499 | protein_coding | deleterious_low_confidence(0) | probably_damaging(1) | TCGA-AN-A0AJ-01 | Breast | breast invasive carcinoma | Female | >=65 | I/II | Unknown | Unknown | SD |
| PDE4D | SNV | Missense_Mutation | | c.896N>A | p.Ser299Tyr | p.S299Y | Q08499 | protein_coding | deleterious_low_confidence(0) | probably_damaging(0.974) | TCGA-BH-A0BP-01 | Breast | breast invasive carcinoma | Female | >=65 | I/II | Unknown | Unknown | SD |
| PDE4D | SNV | Missense_Mutation | | c.1691N>G | p.Lys564Arg | p.K564R | Q08499 | protein_coding | tolerated_low_confidence(0.27) | probably_damaging(0.97) | TCGA-BH-A18T-01 | Breast | breast invasive carcinoma | Female | >=65 | I/II | Unknown | Unknown | PD |
| PDE4D | SNV | Missense_Mutation | | c.1291N>T | p.Arg431Trp | p.R431W | Q08499 | protein_coding | deleterious_low_confidence(0) | probably_damaging(0.994) | TCGA-C8-A1HL-01 | Breast | breast invasive carcinoma | Female | <65 | III/IV | Unknown | Unknown | SD |
| PDE4D | SNV | Missense_Mutation | | c.2221G>C | p.Glu741Gln | p.E741Q | Q08499 | protein_coding | deleterious_low_confidence(0.01) | probably_damaging(0.954) | TCGA-E2-A159-01 | Breast | breast invasive carcinoma | Female | <65 | I/II | Chemotherapy | cyclophosphamide | SD |
| PDE4D | insertion | Nonsense_Mutation | novel | c.1924_1925insGTTGTTGTTGAAAATAGTGACAATTTTACCAAACTAAGTTTAG | p.Phe642CysfsTer4 | p.F642Cfs*4 | Q08499 | protein_coding | | | TCGA-A2-A0D1-01 | Breast | breast invasive carcinoma | Female | >=65 | I/II | Chemotherapy | taxotere | SD |
| PDE4D | deletion | Frame_Shift_Del | novel | c.2148delN | p.Ser717LeufsTer22 | p.S717Lfs*22 | Q08499 | protein_coding | | | TCGA-EW-A2FV-01 | Breast | breast invasive carcinoma | Female | <65 | III/IV | Chemotherapy | docetaxel | SD |
| PDE4D | SNV | Missense_Mutation | novel | c.359N>T | p.Ala120Val | p.A120V | Q08499 | protein_coding | tolerated_low_confidence(0.24) | benign(0.058) | TCGA-VS-A8EH-01 | Cervix | cervical & endocervical cancer | Female | <65 | III/IV | Chemotherapy | cisplatin | CR |


