
|
|||||
|
 | |
| |
| |
| |
| |
| |
|
Gene: PCDH7 |
Gene summary for PCDH7 |
| Gene information | Species | Human | Gene symbol | PCDH7 | Gene ID | 5099 |
| Gene name | protocadherin 7 | |
| Gene Alias | BH-Pcdh | |
| Cytomap | 4p15.1 | |
| Gene Type | protein-coding | GO ID | GO:0007155 | UniProtAcc | O60245 |
Top |
Malignant transformation analysis |
| Identification of the aberrant gene expression in precancerous and cancerous lesions by comparing the gene expression of stem-like cells in diseased tissues with normal stem cells |
| Entrez ID | Symbol | Replicates | Species | Organ | Tissue | Adj P-value | Log2FC | Malignancy |
| 5099 | PCDH7 | SYSMH3 | Human | Oral cavity | OSCC | 3.30e-49 | 1.33e+00 | 0.2442 |
| 5099 | PCDH7 | SYSMH4 | Human | Oral cavity | OSCC | 2.12e-03 | 9.40e-02 | 0.1226 |
| 5099 | PCDH7 | SYSMH5 | Human | Oral cavity | OSCC | 1.65e-17 | 6.85e-01 | 0.0647 |
| 5099 | PCDH7 | HTA12-23-1 | Human | Pancreas | PDAC | 2.25e-04 | 6.03e-01 | 0.3405 |
| 5099 | PCDH7 | HTA12-25-1 | Human | Pancreas | PDAC | 2.04e-11 | 1.01e+00 | 0.313 |
| 5099 | PCDH7 | HTA12-26-1 | Human | Pancreas | PDAC | 3.32e-05 | 5.05e-01 | 0.3728 |
| 5099 | PCDH7 | HTA12-29-1 | Human | Pancreas | PDAC | 7.31e-15 | 5.01e-01 | 0.3722 |
| 5099 | PCDH7 | HTA12-9-1 | Human | Pancreas | PDAC | 4.42e-05 | 4.53e-01 | 0.1532 |
| 5099 | PCDH7 | GSM5252137_BPH556PrGA2_Fcol | Human | Prostate | BPH | 2.47e-05 | 5.13e-01 | -0.23 |
| 5099 | PCDH7 | 047563_1562-all-cells | Human | Prostate | BPH | 5.69e-15 | 3.64e-01 | 0.0791 |
| 5099 | PCDH7 | 048752_1579-all-cells | Human | Prostate | BPH | 4.41e-23 | 8.88e-01 | 0.1008 |
| 5099 | PCDH7 | 052095_1628-all-cells | Human | Prostate | BPH | 6.98e-42 | 1.14e+00 | 0.1032 |
| 5099 | PCDH7 | 052097_1595-all-cells | Human | Prostate | BPH | 1.38e-33 | 1.00e+00 | 0.0972 |
| 5099 | PCDH7 | 052099_1652-all-cells | Human | Prostate | BPH | 1.65e-29 | 9.72e-01 | 0.1038 |
| 5099 | PCDH7 | Dong_P1 | Human | Prostate | Tumor | 8.94e-10 | -1.98e-01 | 0.035 |
| 5099 | PCDH7 | Dong_P3 | Human | Prostate | Tumor | 3.04e-19 | 2.89e-01 | 0.0278 |
| 5099 | PCDH7 | Dong_P5 | Human | Prostate | Tumor | 3.13e-09 | -2.89e-01 | 0.053 |
| 5099 | PCDH7 | GSM5353221_PA_PB2A_Pool_1_3_S25_L001 | Human | Prostate | Tumor | 1.92e-05 | 6.04e-01 | 0.1633 |
| 5099 | PCDH7 | GSM5353222_PA_PB2B_Pool_1_3_S52_L002 | Human | Prostate | Tumor | 5.63e-04 | 4.78e-01 | 0.1608 |
| 5099 | PCDH7 | GSM5353223_PA_PB2B_Pool_2_S26_L001 | Human | Prostate | Tumor | 2.97e-05 | 6.34e-01 | 0.1604 |
| Page: 1 2 3 4 5 6 7 |
| Tissue | Expression Dynamics | Abbreviation |
| Cervix |  | CC: Cervix cancer |
| HSIL_HPV: HPV-infected high-grade squamous intraepithelial lesions | ||
| N_HPV: HPV-infected normal cervix | ||
| Endometrium | 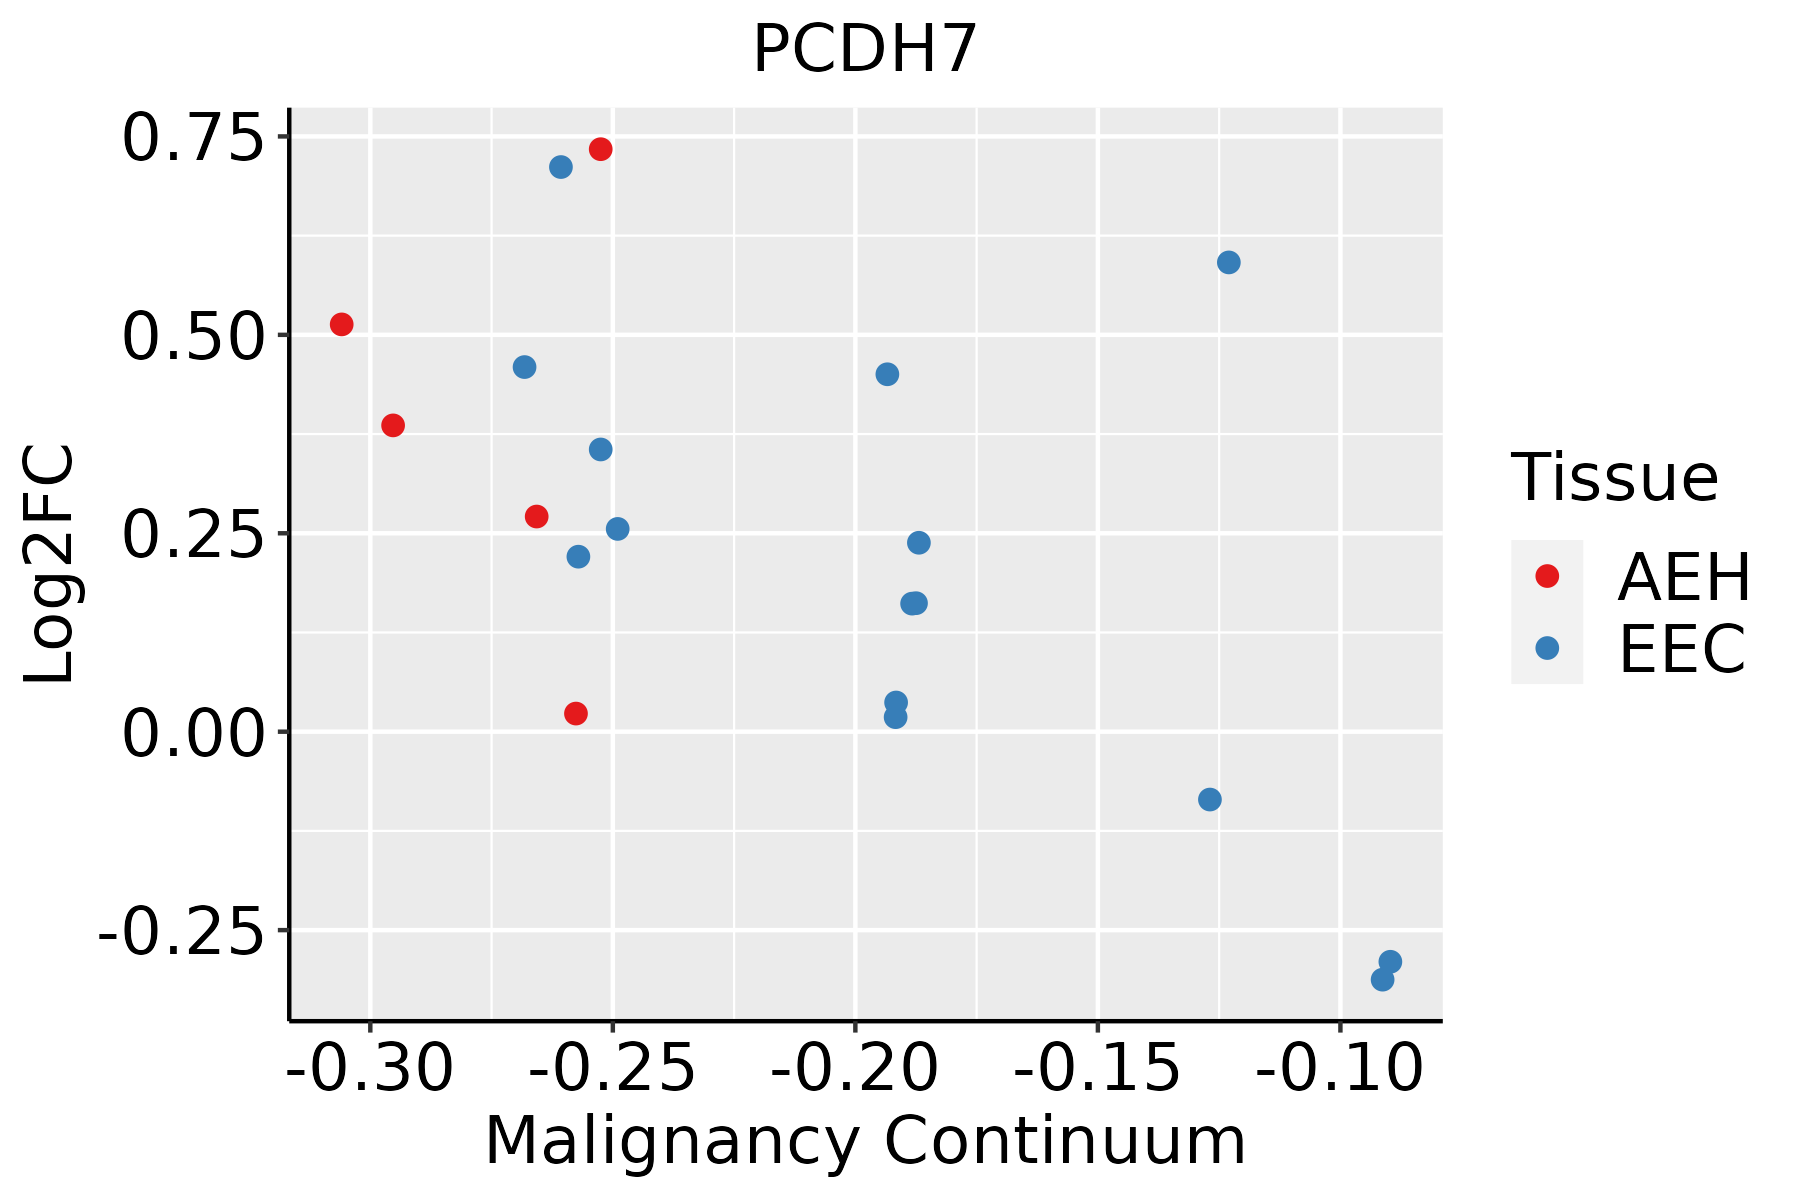 | AEH: Atypical endometrial hyperplasia |
| EEC: Endometrioid Cancer | ||
| Esophagus | 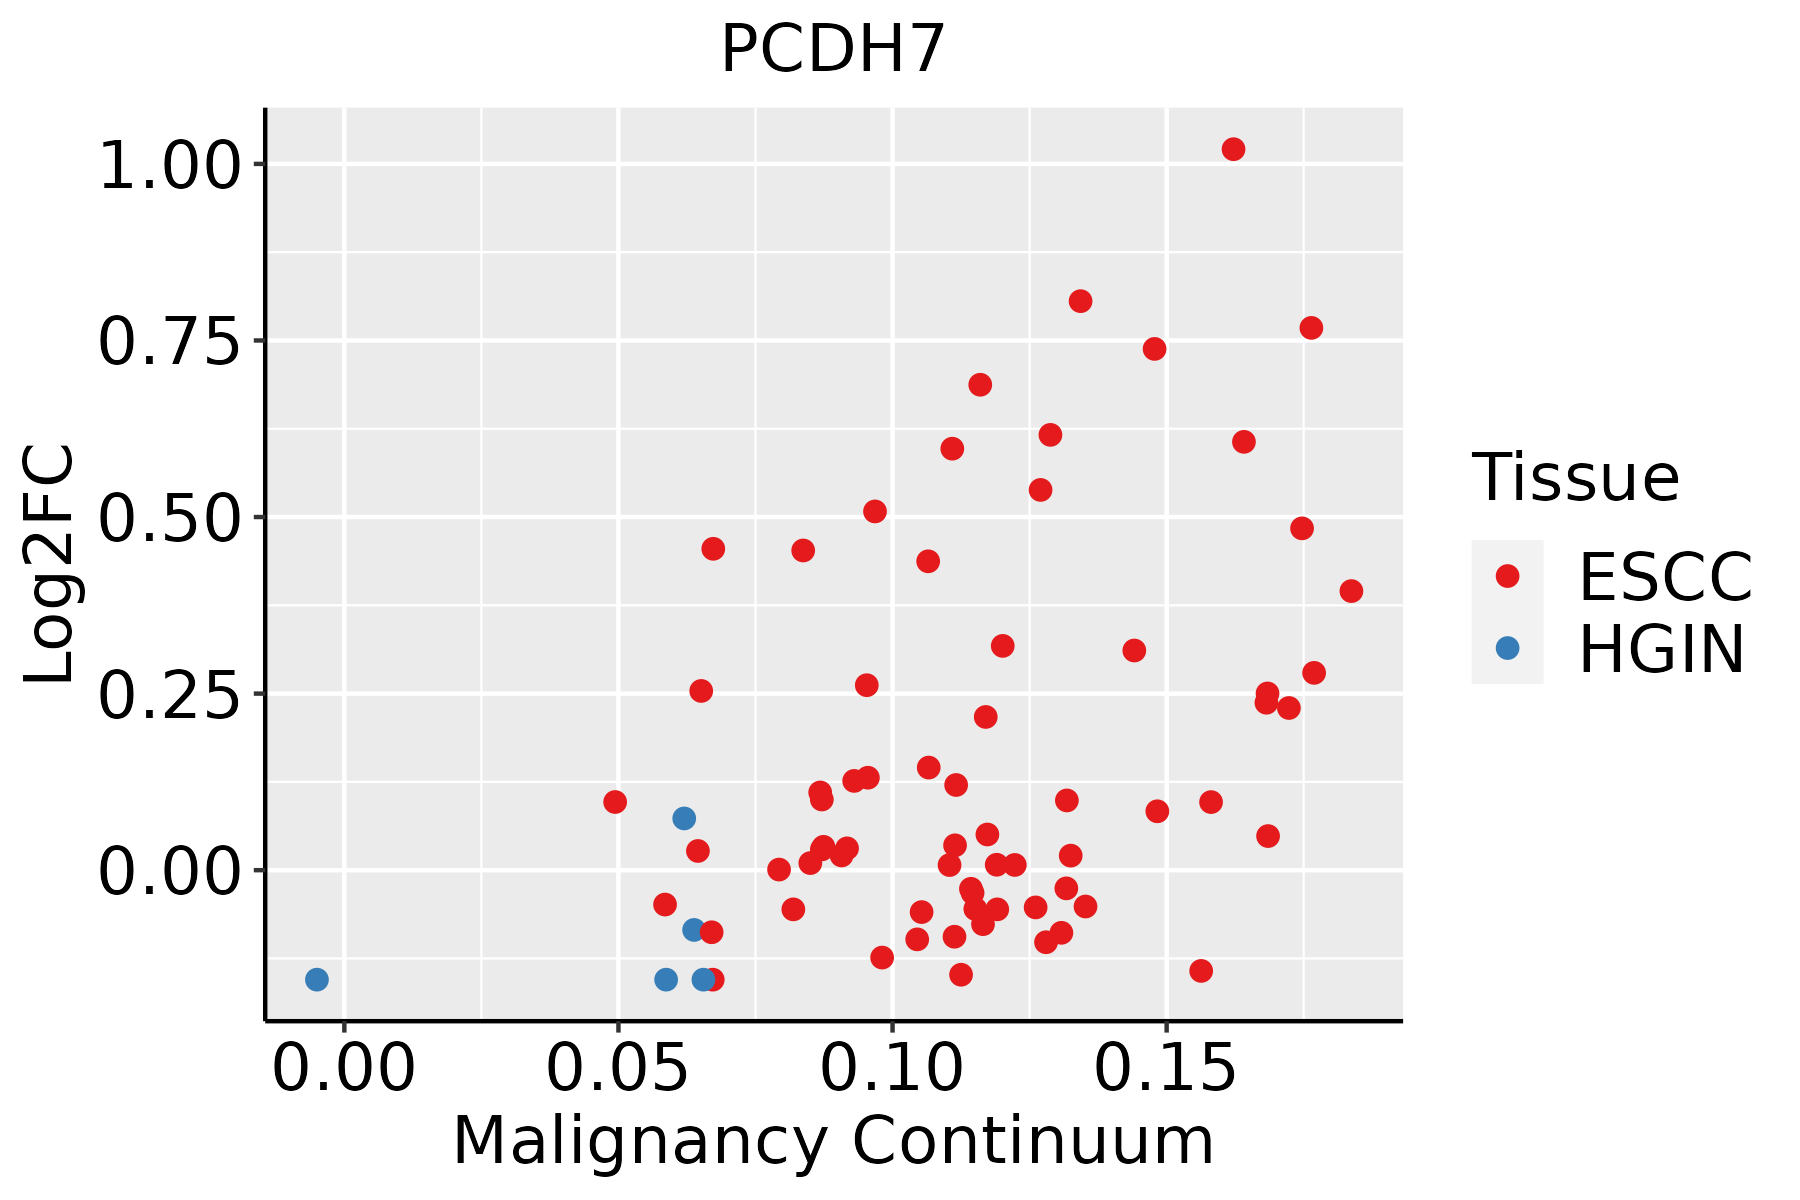 | ESCC: Esophageal squamous cell carcinoma |
| HGIN: High-grade intraepithelial neoplasias | ||
| LGIN: Low-grade intraepithelial neoplasias | ||
| Lung | 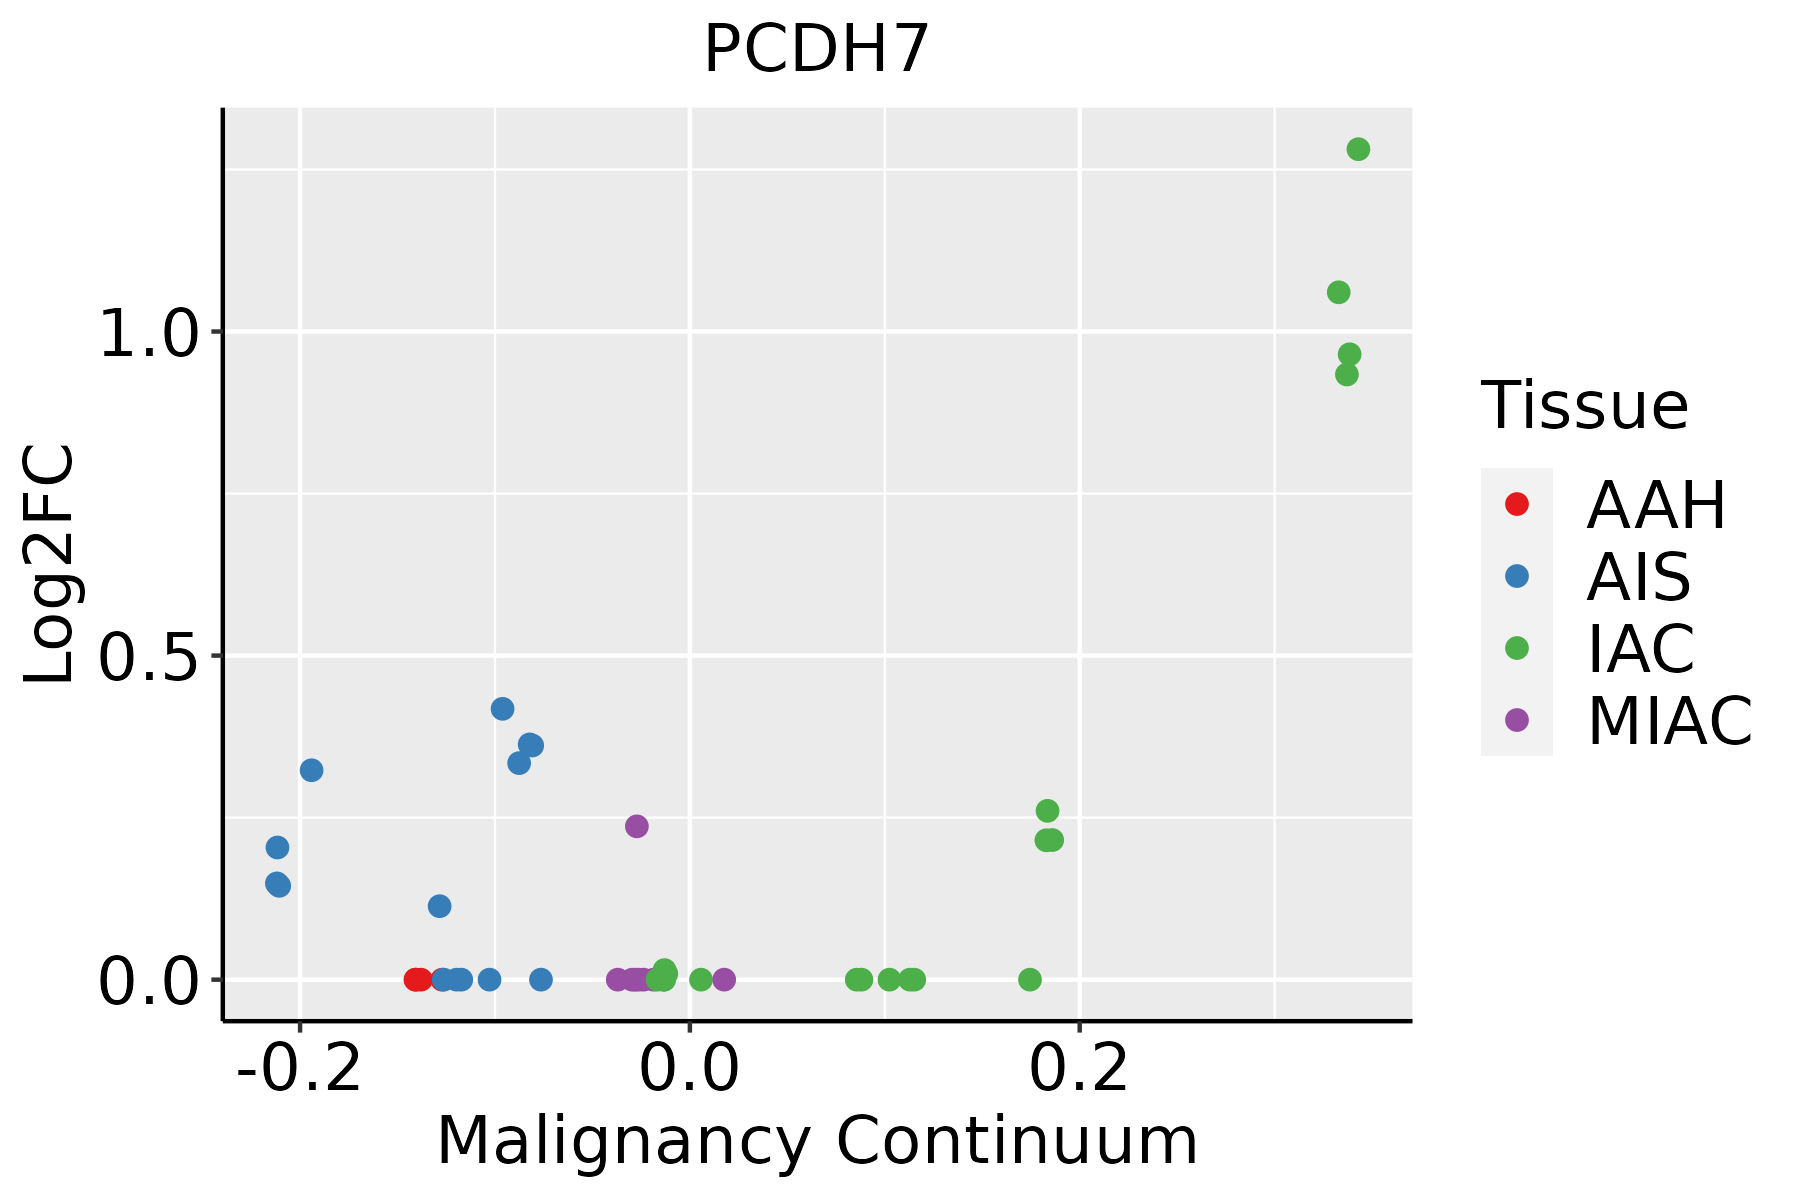 | AAH: Atypical adenomatous hyperplasia |
| AIS: Adenocarcinoma in situ | ||
| IAC: Invasive lung adenocarcinoma | ||
| MIA: Minimally invasive adenocarcinoma | ||
| Oral Cavity | 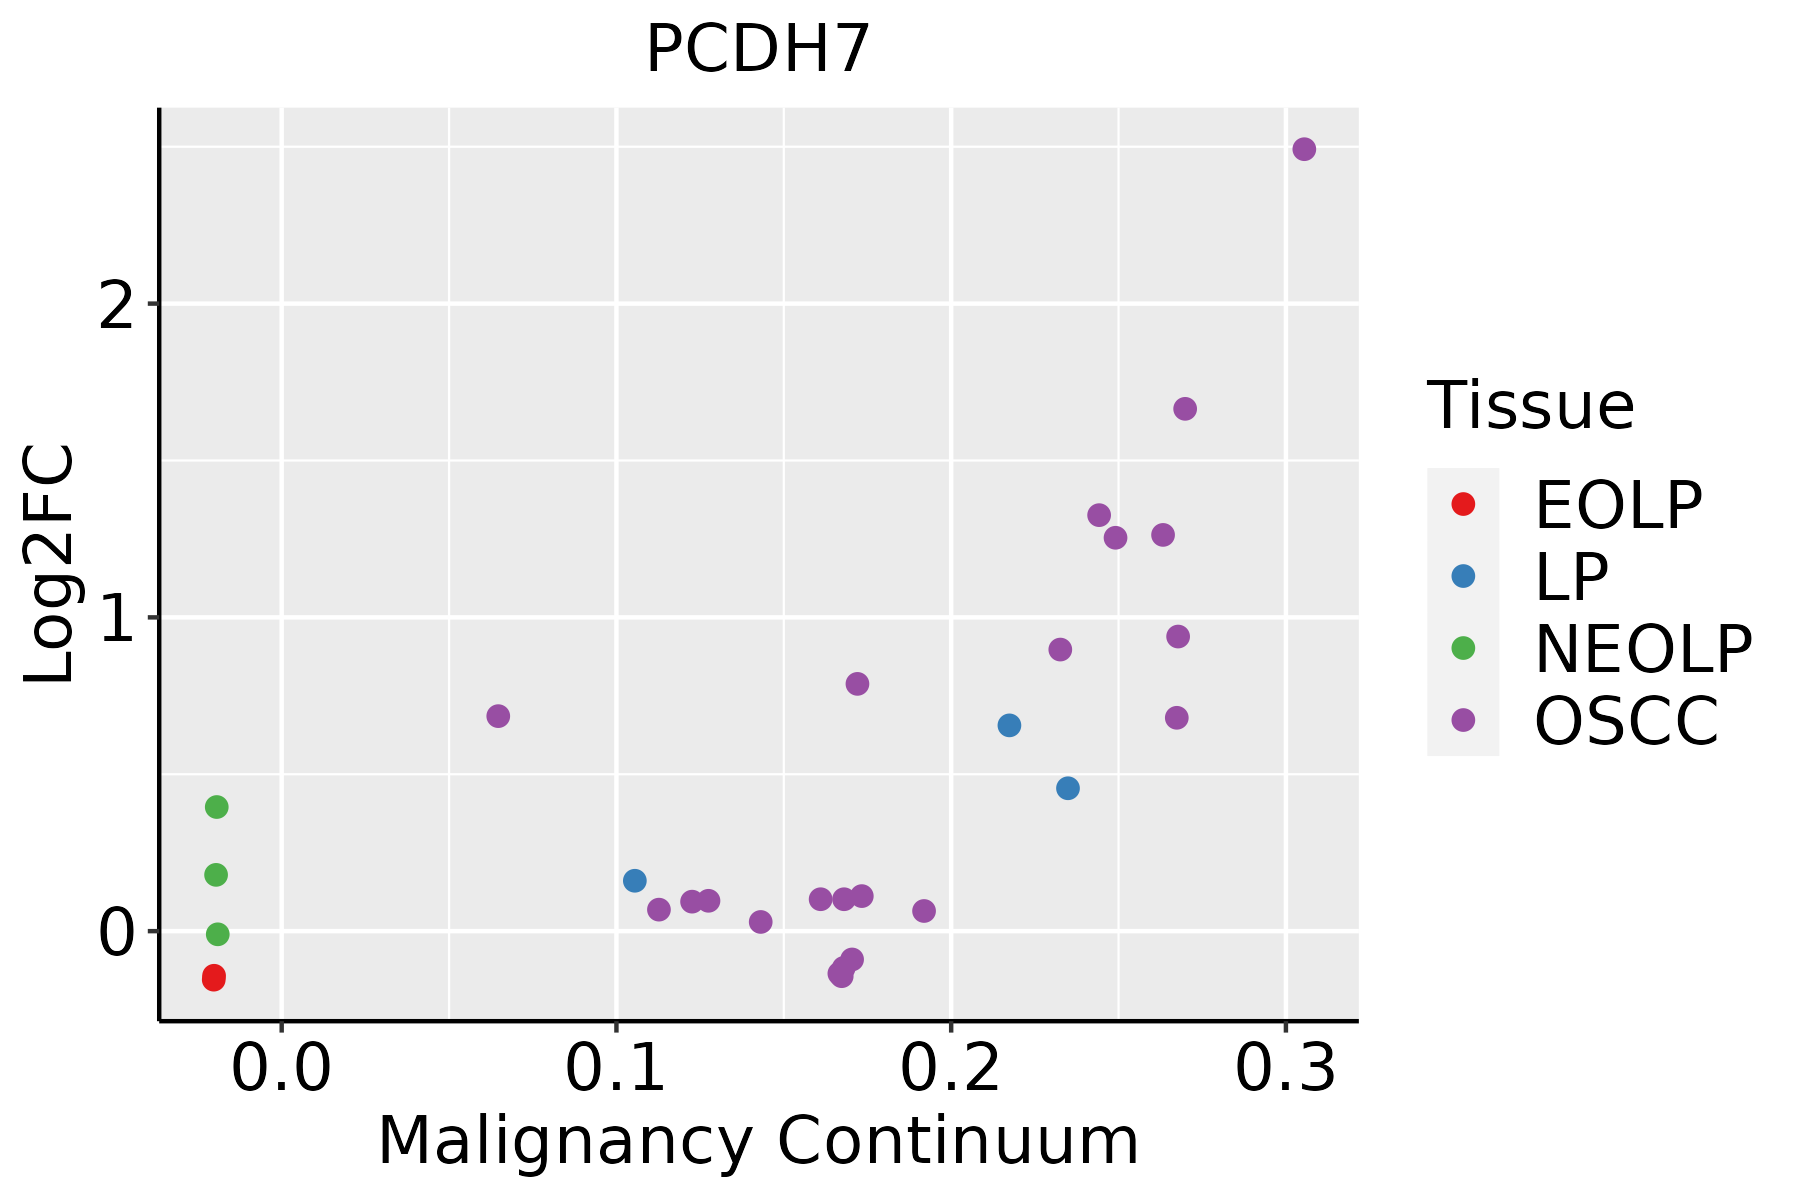 | EOLP: Erosive Oral lichen planus |
| LP: leukoplakia | ||
| NEOLP: Non-erosive oral lichen planus | ||
| OSCC: Oral squamous cell carcinoma | ||
| Prostate | 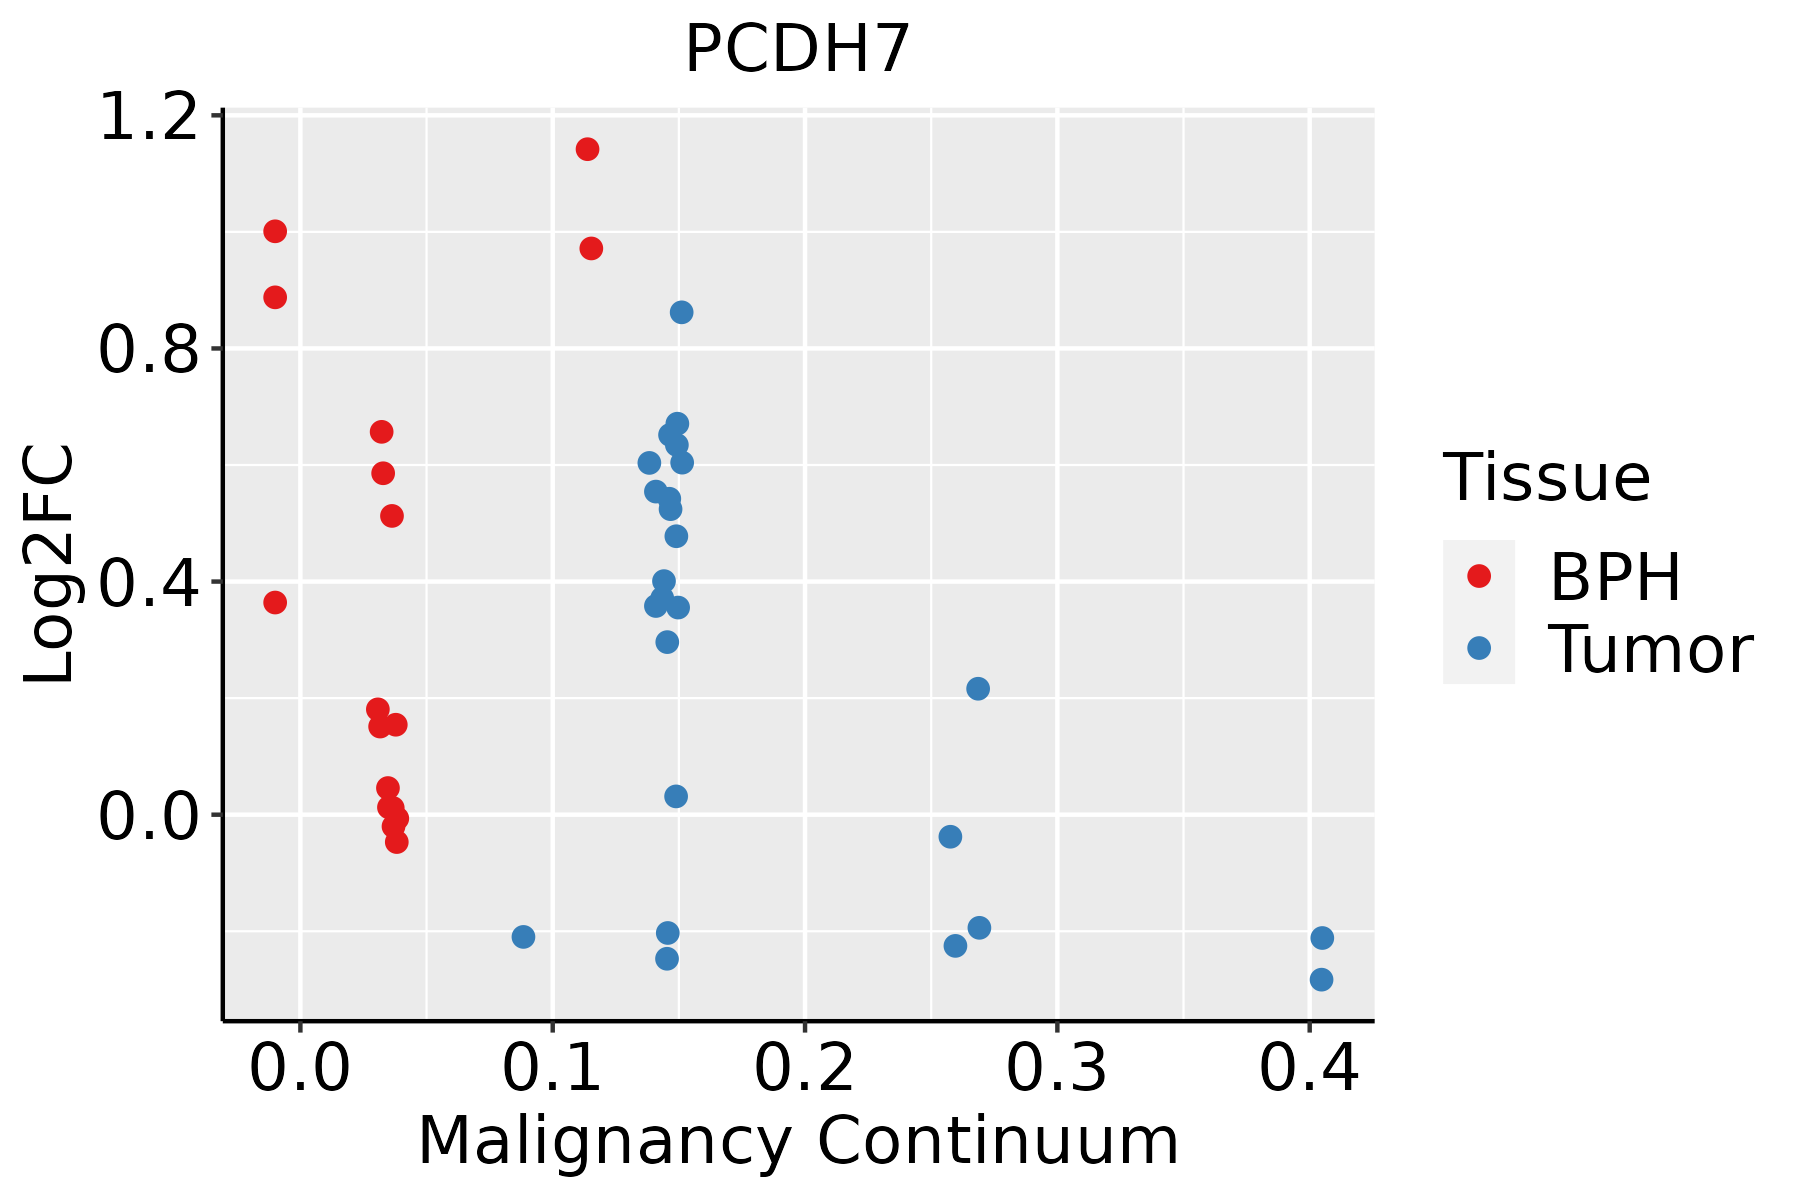 | BPH: Benign Prostatic Hyperplasia |
| Skin |  | AK: Actinic keratosis |
| cSCC: Cutaneous squamous cell carcinoma | ||
| SCCIS:squamous cell carcinoma in situ | ||
| Thyroid | 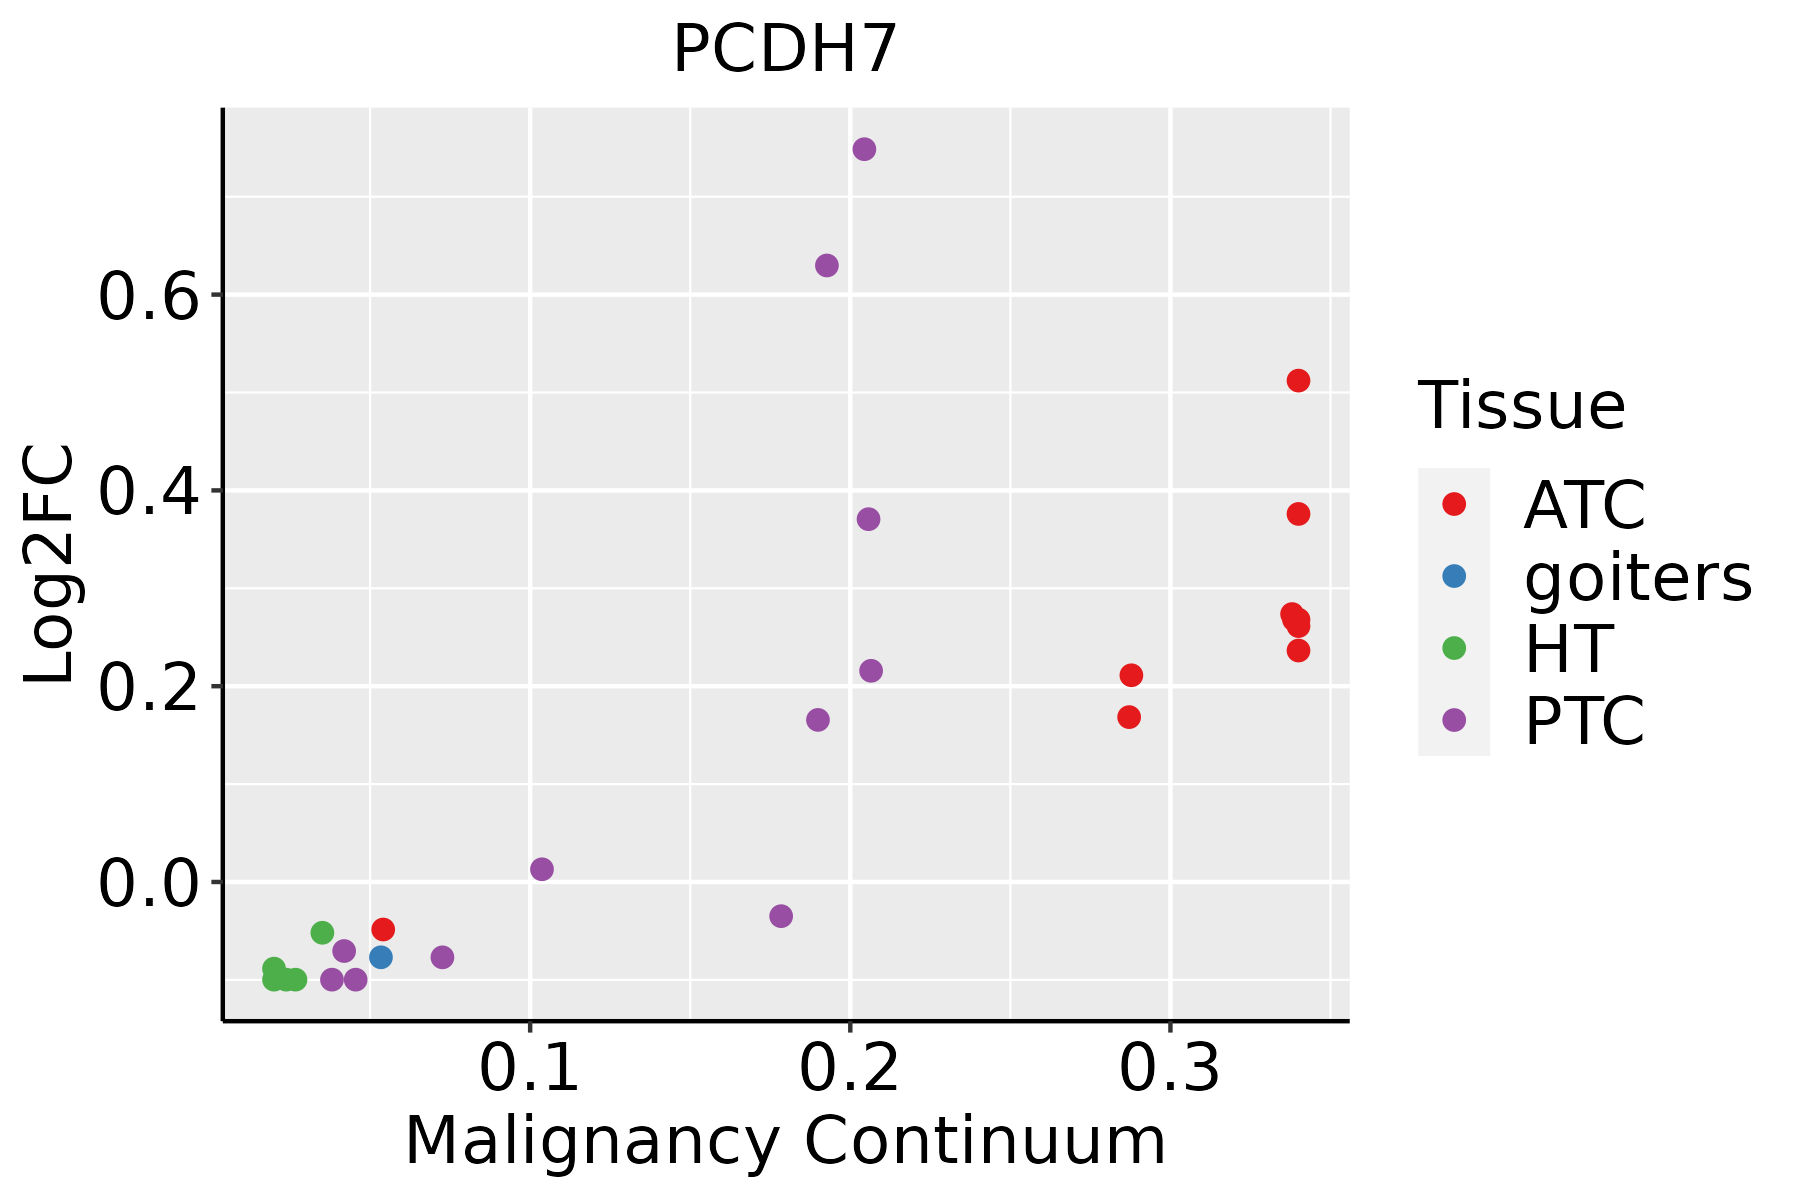 | ATC: Anaplastic thyroid cancer |
| HT: Hashimoto's thyroiditis | ||
| PTC: Papillary thyroid cancer |
| ∗log2FC in expression of this searched gene in stem-like cells from each diseased tissue sample relative to stem-like cells in normal samples in each tissue plotted against the malignancy continuum. Samples are colored based on if they are from different disease stage. |
Top |
Malignant transformation related pathway analysis |
| Find out the enriched GO biological processes and KEGG pathways involved in transition from healthy to precancer to cancer |
| Tissue | Disease Stage | Enriched GO biological Processes |
| Colorectum | AD |  |
| Colorectum | SER |  |
| Colorectum | MSS |  |
| Colorectum | MSI-H |  |
| Colorectum | FAP |  |
| ∗Top 15 enriched GO BP terms are showed in the bar plot of each disease state in each tissue. Each row represents a significant GO biological process which is colored according to the -log10(p.adjust). |
| Page: 1 2 3 4 5 6 7 8 9 |
| GO ID | Tissue | Disease Stage | Description | Gene Ratio | Bg Ratio | pvalue | p.adjust | Count |
| GO:0098742 | Cervix | N_HPV | cell-cell adhesion via plasma-membrane adhesion molecules | 17/534 | 273/18723 | 2.26e-03 | 2.11e-02 | 17 |
| GO:00987421 | Skin | SCCIS | cell-cell adhesion via plasma-membrane adhesion molecules | 26/919 | 273/18723 | 9.83e-04 | 1.23e-02 | 26 |
| Page: 1 |
| Pathway ID | Tissue | Disease Stage | Description | Gene Ratio | Bg Ratio | pvalue | p.adjust | qvalue | Count |
| Page: 1 |
Top |
Cell-cell communication analysis |
| Identification of potential cell-cell interactions between two cell types and their ligand-receptor pairs for different disease states |
| Ligand | Receptor | LRpair | Pathway | Tissue | Disease Stage |
| Page: 1 |
Top |
Single-cell gene regulatory network inference analysis |
| Find out the significant the regulons (TFs) and the target genes of each regulon across cell types for different disease states |
| TF | Cell Type | Tissue | Disease Stage | Target Gene | RSS | Regulon Activity |
| ∗The dot plots of a searched regulon are shown for all cell subpopulations in each disease state of each tissue based on the regulon specific score inferred using pySCENIC and by calculating the average expression. |
| Page: 1 |
Top |
Somatic mutation of malignant transformation related genes |
| Annotation of somatic variants for genes involved in malignant transformation |
| Hugo Symbol | Variant Class | Variant Classification | dbSNP RS | HGVSc | HGVSp | HGVSp Short | SWISSPROT | BIOTYPE | SIFT | PolyPhen | Tumor Sample Barcode | Tissue | Histology | Sex | Age | Stage | Therapy Types | Drugs | Outcome |
| PCDH7 | SNV | Missense_Mutation | novel | c.2845N>T | p.Ser949Cys | p.S949C | O60245 | protein_coding | tolerated(0.05) | probably_damaging(0.997) | TCGA-A8-A08G-01 | Breast | breast invasive carcinoma | Female | <65 | I/II | Chemotherapy | 5-fluorouracil | CR |
| PCDH7 | SNV | Missense_Mutation | c.1547C>T | p.Ser516Leu | p.S516L | O60245 | protein_coding | deleterious(0.01) | possibly_damaging(0.59) | TCGA-AN-A046-01 | Breast | breast invasive carcinoma | Female | >=65 | I/II | Unknown | Unknown | SD | |
| PCDH7 | SNV | Missense_Mutation | novel | c.1753G>A | p.Asp585Asn | p.D585N | O60245 | protein_coding | tolerated(0.08) | benign(0.039) | TCGA-AN-A046-01 | Breast | breast invasive carcinoma | Female | >=65 | I/II | Unknown | Unknown | SD |
| PCDH7 | SNV | Missense_Mutation | novel | c.2752G>T | p.Asp918Tyr | p.D918Y | O60245 | protein_coding | deleterious(0) | possibly_damaging(0.891) | TCGA-AN-A046-01 | Breast | breast invasive carcinoma | Female | >=65 | I/II | Unknown | Unknown | SD |
| PCDH7 | SNV | Missense_Mutation | c.2317N>A | p.Asp773Asn | p.D773N | O60245 | protein_coding | deleterious(0.03) | benign(0.001) | TCGA-BH-A0BC-01 | Breast | breast invasive carcinoma | Female | <65 | III/IV | Chemotherapy | doxorubicin | SD | |
| PCDH7 | insertion | In_Frame_Ins | novel | c.2702_2703insTGCCTGTTGATGAACGAGGAAGCCAGGAAA | p.Ala901_Ser902insCysLeuLeuMetAsnGluGluAlaArgLys | p.A901_S902insCLLMNEEARK | protein_coding | TCGA-A2-A0D1-01 | Breast | breast invasive carcinoma | Female | >=65 | I/II | Chemotherapy | taxotere | SD | |||
| PCDH7 | insertion | Nonsense_Mutation | novel | c.2770_2771insCAGAAAATTGTCTATTTGGATTTAATAATTTTTCTTATGG | p.Ser925ArgfsTer8 | p.S925Rfs*8 | protein_coding | TCGA-A7-A0CJ-01 | Breast | breast invasive carcinoma | Female | <65 | I/II | Chemotherapy | cytoxan | SD | |||
| PCDH7 | insertion | Nonsense_Mutation | novel | c.2843_2844insAG | p.Tyr948Ter | p.Y948* | O60245 | protein_coding | TCGA-A8-A08G-01 | Breast | breast invasive carcinoma | Female | <65 | I/II | Chemotherapy | 5-fluorouracil | CR | ||
| PCDH7 | deletion | Frame_Shift_Del | c.2051delN | p.Ser686LeufsTer47 | p.S686Lfs*47 | O60245 | protein_coding | TCGA-D8-A1J8-01 | Breast | breast invasive carcinoma | Female | >=65 | I/II | Hormone Therapy | nolvadex | SD | |||
| PCDH7 | deletion | Frame_Shift_Del | novel | c.1426delN | p.Thr476ProfsTer46 | p.T476Pfs*46 | O60245 | protein_coding | TCGA-EW-A2FV-01 | Breast | breast invasive carcinoma | Female | <65 | III/IV | Chemotherapy | docetaxel | SD |
| Page: 1 2 3 4 5 6 7 8 9 10 11 12 13 14 15 16 17 |
Top |
Related drugs of malignant transformation related genes |
| Identification of chemicals and drugs interact with genes involved in malignant transfromation |
| (DGIdb 4.0) |
| Entrez ID | Symbol | Category | Interaction Types | Drug Claim Name | Drug Name | PMIDs |
| Page: 1 |

Copyright 2023-Present -The University of Texas Health Science Center at Houston |