
|
|||||
|
 | |
| |
| |
| |
| |
| |
|
Gene: OSER1 |
Gene summary for OSER1 |
| Gene information | Species | Human | Gene symbol | OSER1 | Gene ID | 51526 |
| Gene name | oxidative stress responsive serine rich 1 | |
| Gene Alias | C20orf111 | |
| Cytomap | 20q13.12 | |
| Gene Type | protein-coding | GO ID | GO:0000302 | UniProtAcc | Q9NX31 |
Top |
Malignant transformation analysis |
| Identification of the aberrant gene expression in precancerous and cancerous lesions by comparing the gene expression of stem-like cells in diseased tissues with normal stem cells |
| Entrez ID | Symbol | Replicates | Species | Organ | Tissue | Adj P-value | Log2FC | Malignancy |
| 51526 | OSER1 | C57 | Human | Oral cavity | OSCC | 1.07e-05 | 5.09e-01 | 0.1679 |
| 51526 | OSER1 | C08 | Human | Oral cavity | OSCC | 2.89e-24 | 7.24e-01 | 0.1919 |
| 51526 | OSER1 | C09 | Human | Oral cavity | OSCC | 1.21e-16 | 6.22e-01 | 0.1431 |
| 51526 | OSER1 | LN22 | Human | Oral cavity | OSCC | 2.15e-03 | 8.77e-01 | 0.1733 |
| 51526 | OSER1 | LN46 | Human | Oral cavity | OSCC | 1.00e-15 | 1.06e+00 | 0.1666 |
| 51526 | OSER1 | LP15 | Human | Oral cavity | LP | 5.24e-06 | 1.13e+00 | 0.2174 |
| 51526 | OSER1 | LP17 | Human | Oral cavity | LP | 1.88e-02 | 7.44e-01 | 0.2349 |
| 51526 | OSER1 | SYSMH1 | Human | Oral cavity | OSCC | 9.81e-17 | 6.67e-01 | 0.1127 |
| 51526 | OSER1 | SYSMH2 | Human | Oral cavity | OSCC | 2.02e-22 | 8.27e-01 | 0.2326 |
| 51526 | OSER1 | SYSMH3 | Human | Oral cavity | OSCC | 1.18e-10 | 5.60e-01 | 0.2442 |
| 51526 | OSER1 | SYSMH6 | Human | Oral cavity | OSCC | 6.79e-11 | 4.41e-01 | 0.1275 |
| Page: 1 2 3 4 5 |
| Tissue | Expression Dynamics | Abbreviation |
| Esophagus | 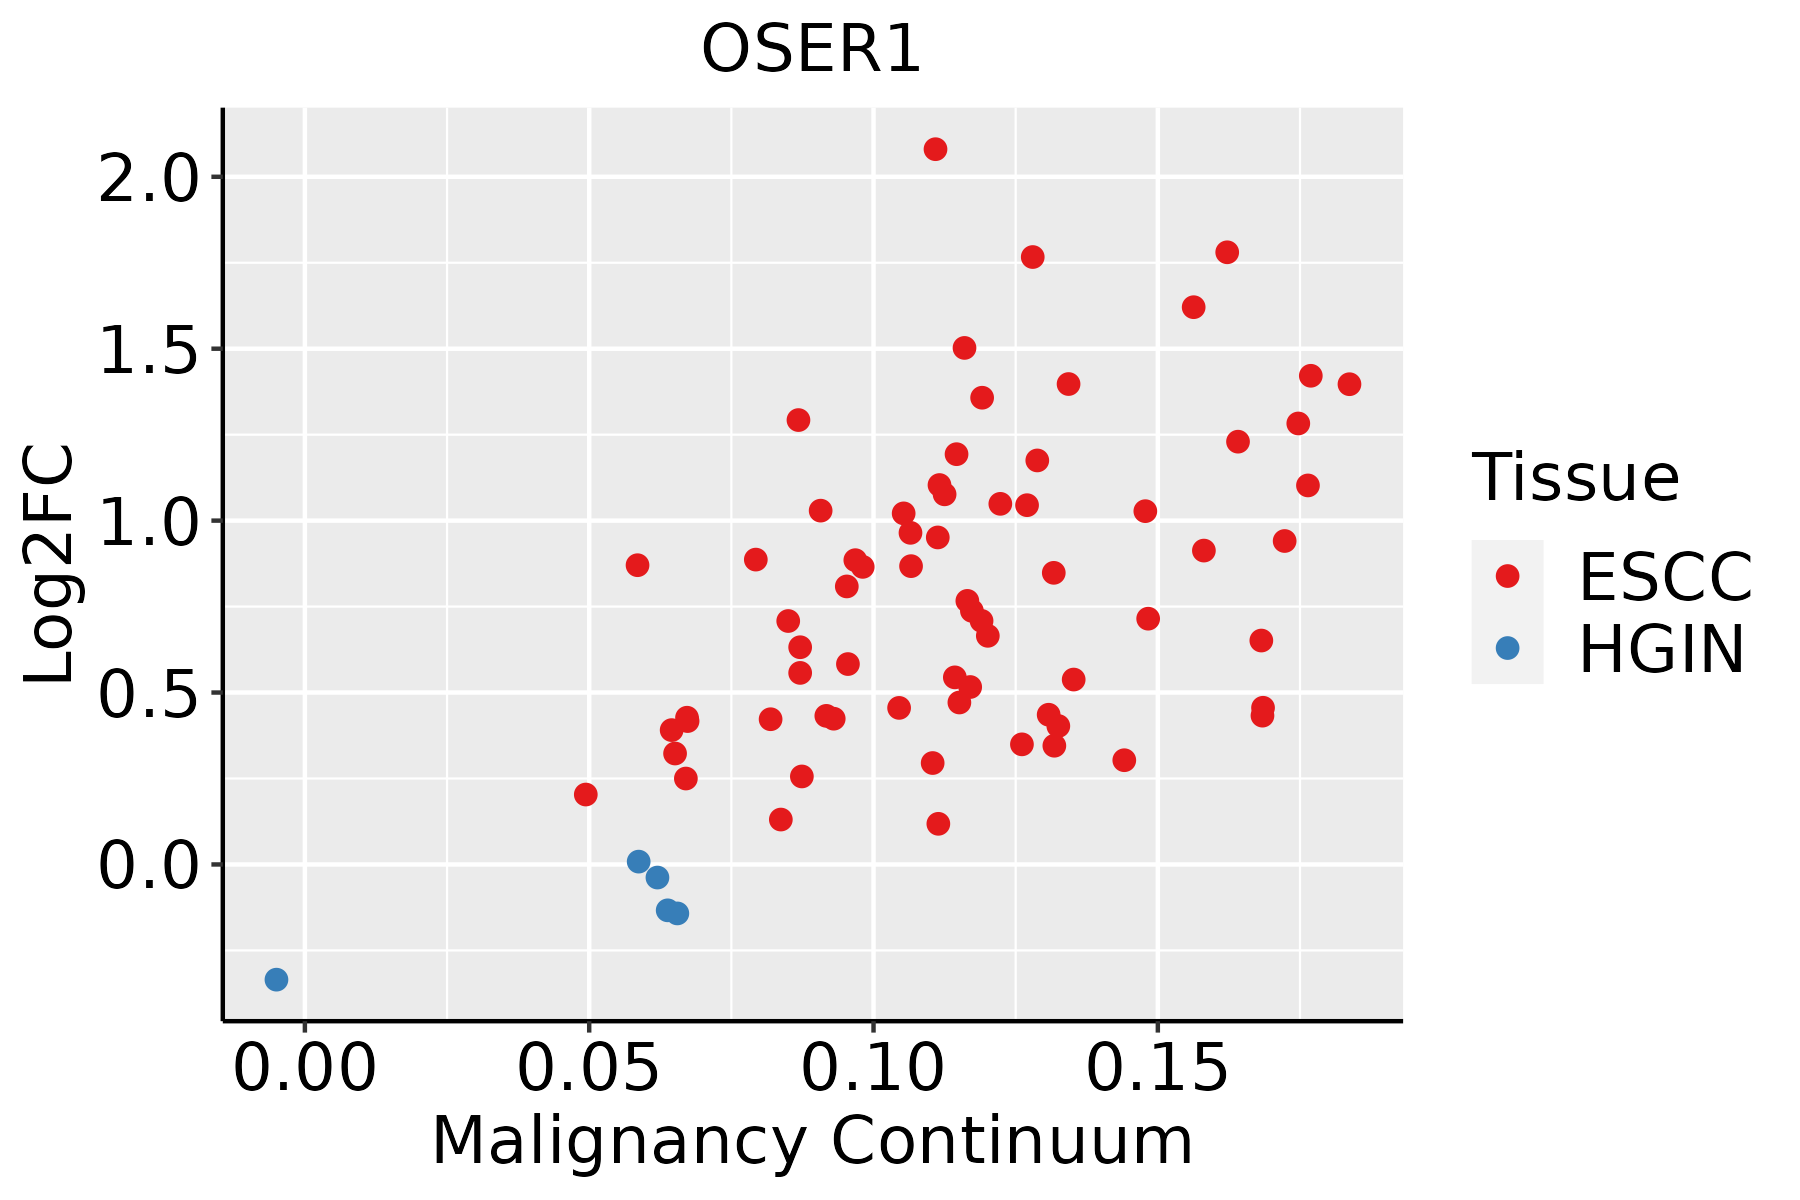 | ESCC: Esophageal squamous cell carcinoma |
| HGIN: High-grade intraepithelial neoplasias | ||
| LGIN: Low-grade intraepithelial neoplasias | ||
| Liver | 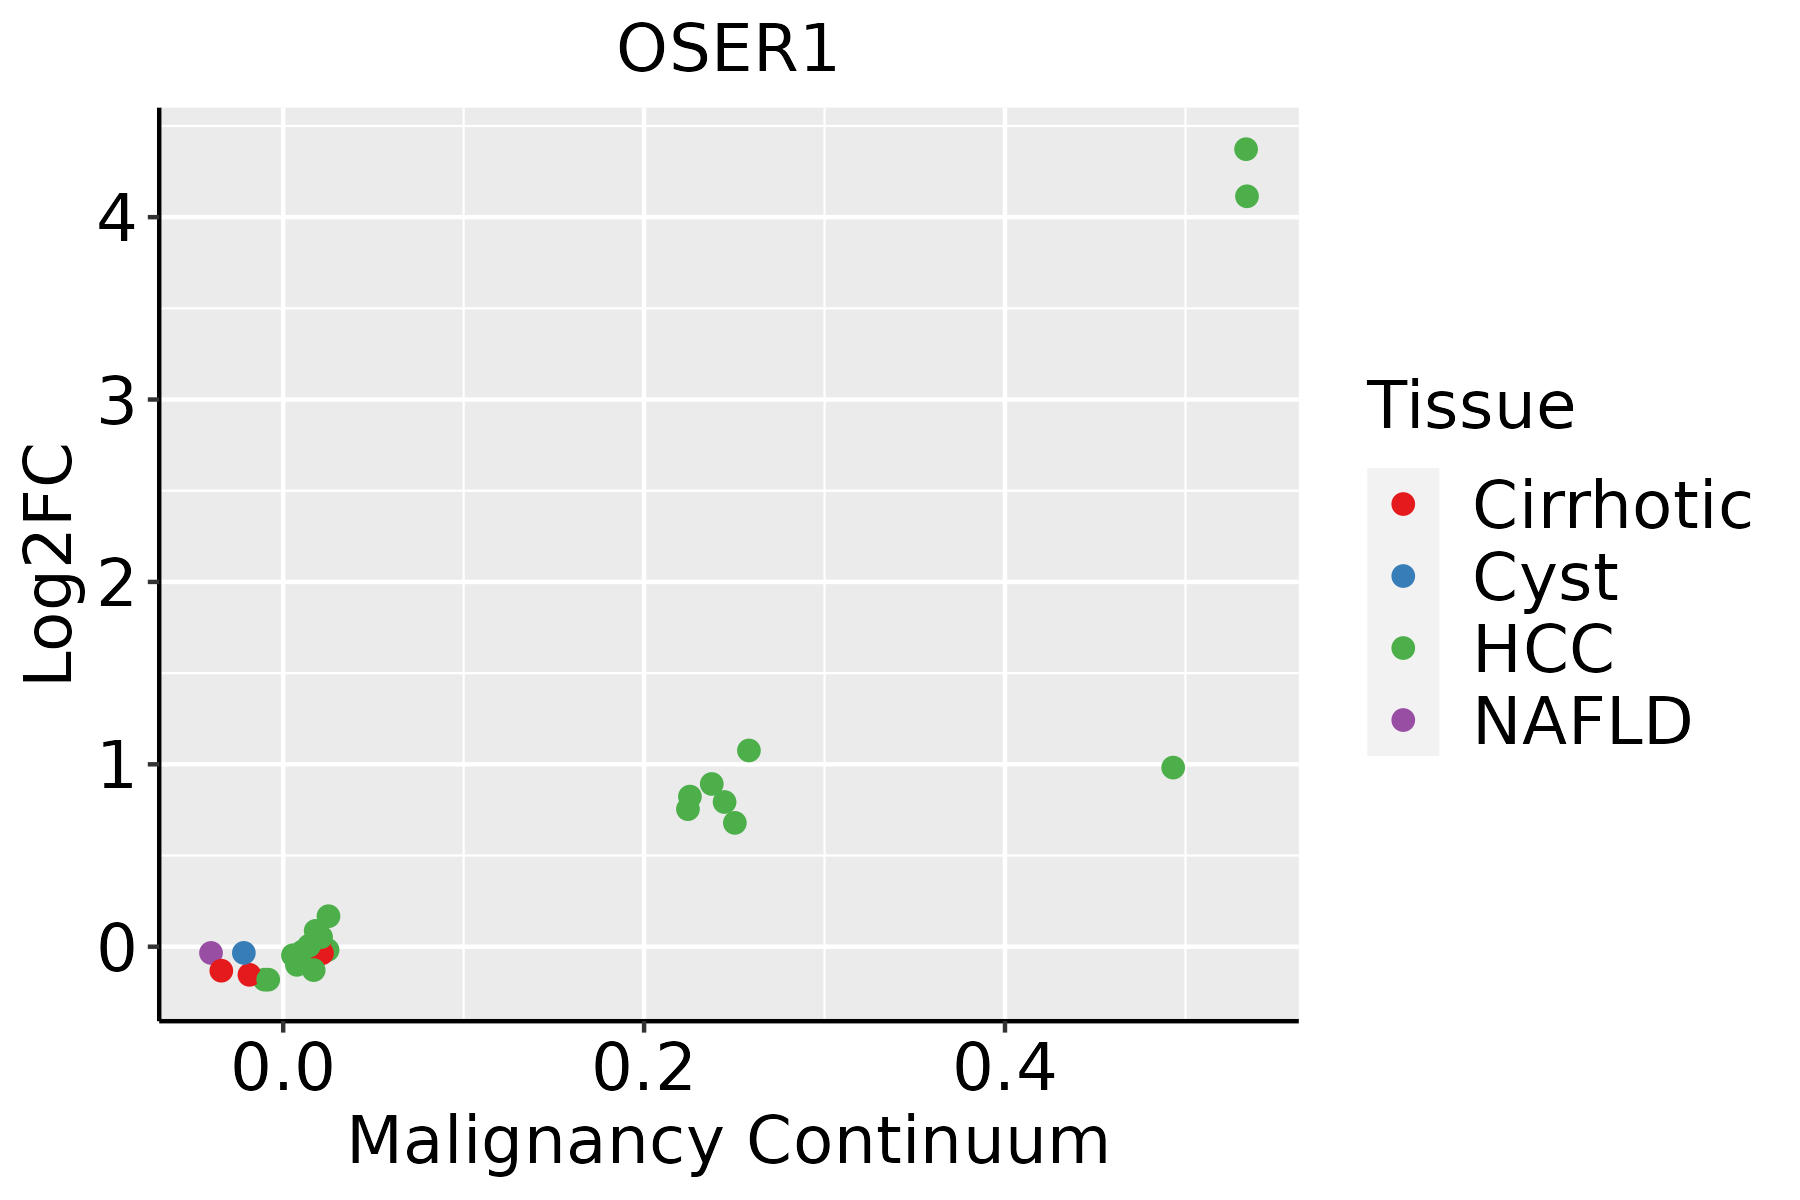 | HCC: Hepatocellular carcinoma |
| NAFLD: Non-alcoholic fatty liver disease | ||
| Oral Cavity | 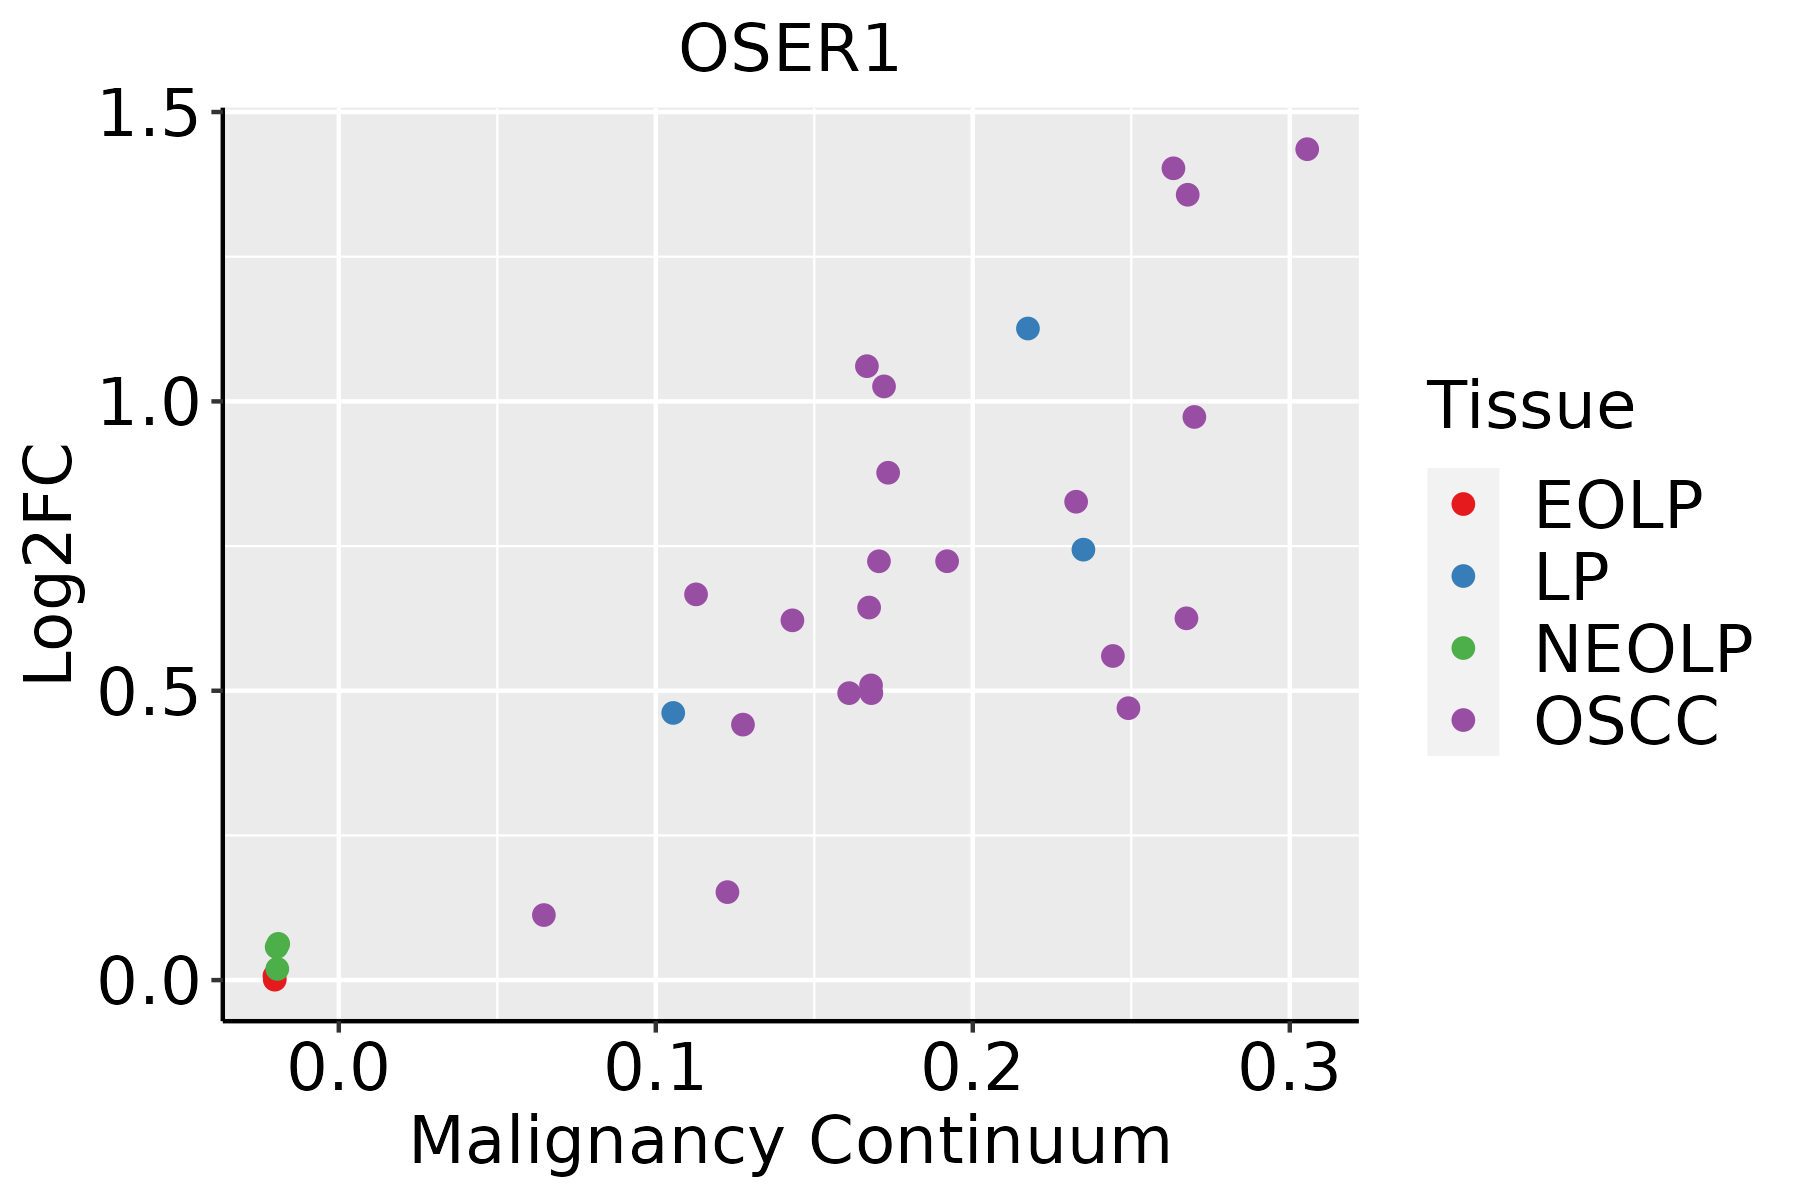 | EOLP: Erosive Oral lichen planus |
| LP: leukoplakia | ||
| NEOLP: Non-erosive oral lichen planus | ||
| OSCC: Oral squamous cell carcinoma | ||
| Prostate | 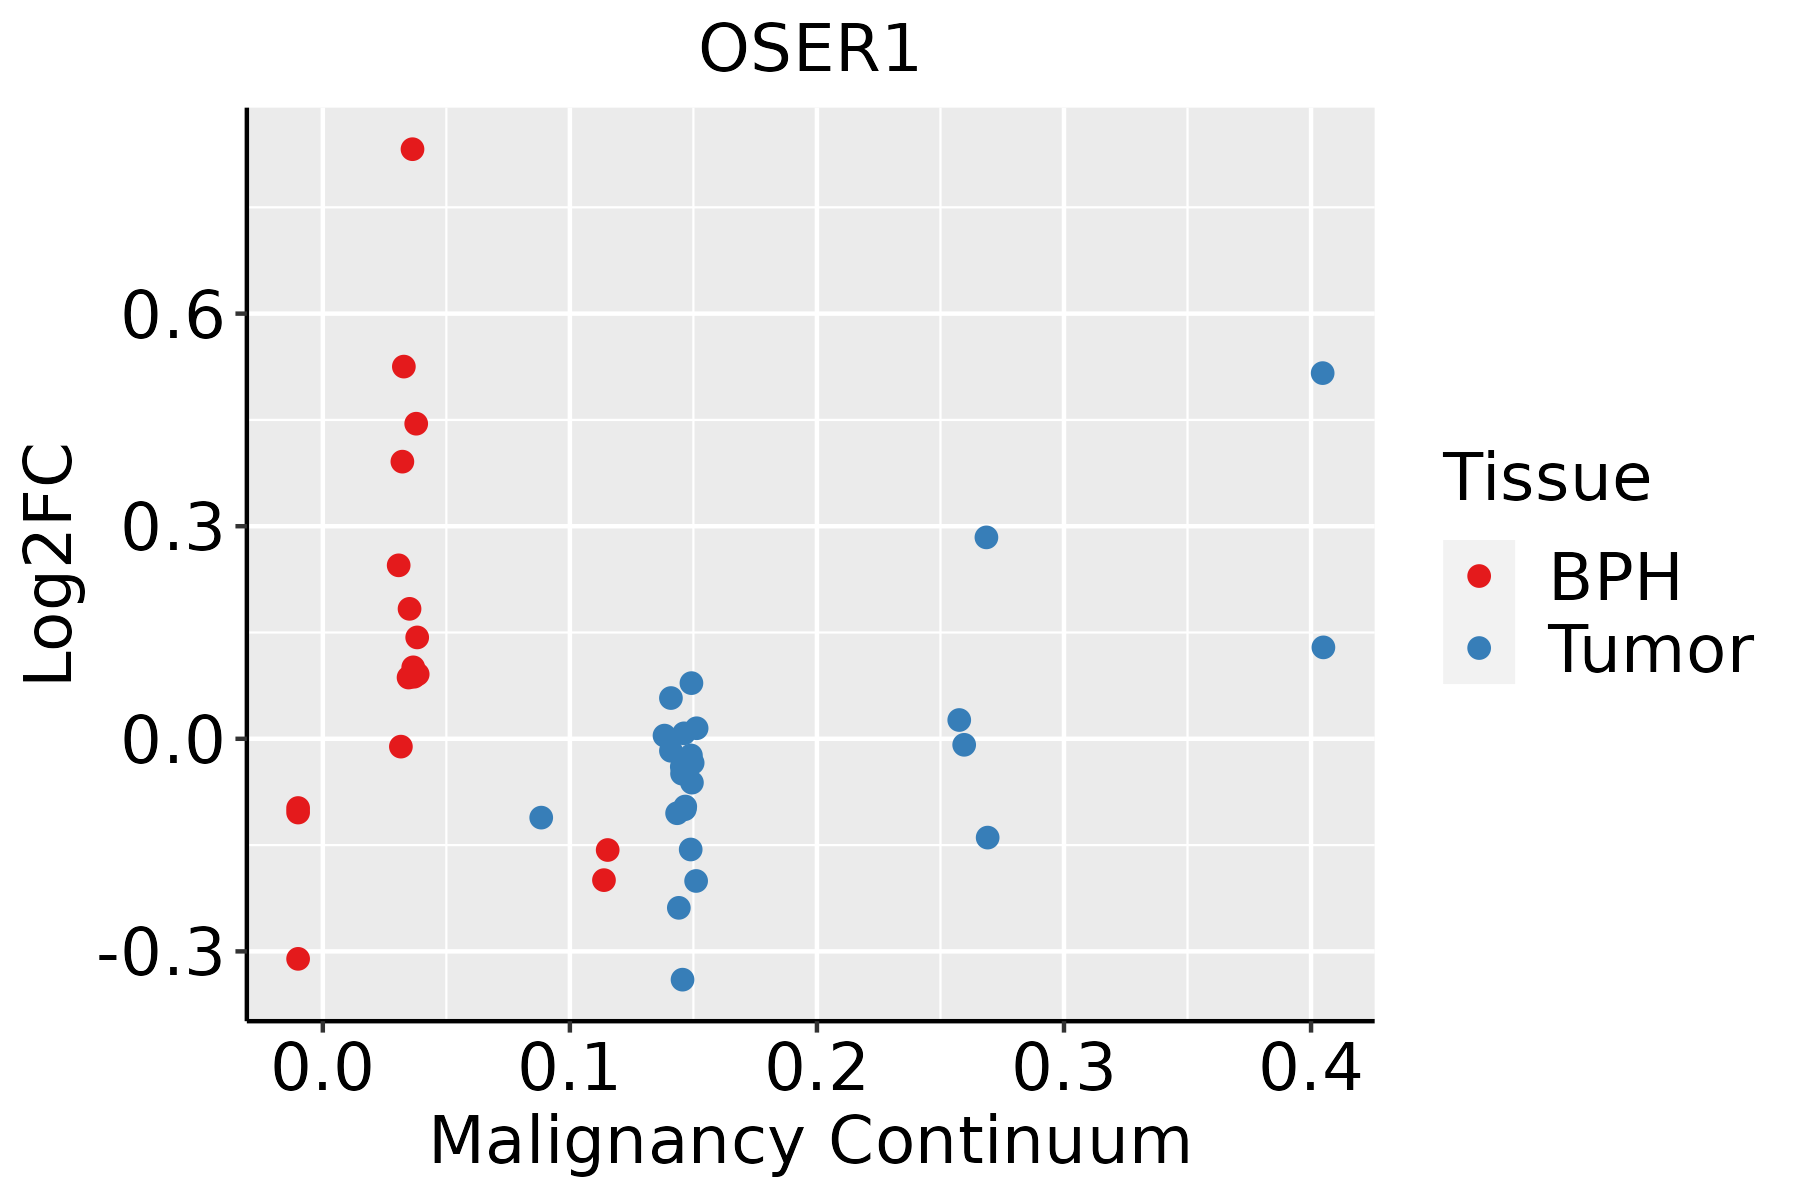 | BPH: Benign Prostatic Hyperplasia |
| ∗log2FC in expression of this searched gene in stem-like cells from each diseased tissue sample relative to stem-like cells in normal samples in each tissue plotted against the malignancy continuum. Samples are colored based on if they are from different disease stage. |
Top |
Malignant transformation related pathway analysis |
| Find out the enriched GO biological processes and KEGG pathways involved in transition from healthy to precancer to cancer |
| Tissue | Disease Stage | Enriched GO biological Processes |
| Colorectum | AD |  |
| Colorectum | SER |  |
| Colorectum | MSS |  |
| Colorectum | MSI-H |  |
| Colorectum | FAP |  |
| ∗Top 15 enriched GO BP terms are showed in the bar plot of each disease state in each tissue. Each row represents a significant GO biological process which is colored according to the -log10(p.adjust). |
| Page: 1 2 3 4 5 6 7 8 9 |
| GO ID | Tissue | Disease Stage | Description | Gene Ratio | Bg Ratio | pvalue | p.adjust | Count |
| GO:0006979111 | Esophagus | ESCC | response to oxidative stress | 303/8552 | 446/18723 | 7.15e-22 | 1.30e-19 | 303 |
| GO:0062197111 | Esophagus | ESCC | cellular response to chemical stress | 234/8552 | 337/18723 | 5.37e-19 | 5.97e-17 | 234 |
| GO:0034599111 | Esophagus | ESCC | cellular response to oxidative stress | 197/8552 | 288/18723 | 3.76e-15 | 2.15e-13 | 197 |
| GO:0000302111 | Esophagus | ESCC | response to reactive oxygen species | 150/8552 | 222/18723 | 3.06e-11 | 1.02e-09 | 150 |
| GO:0042542111 | Esophagus | ESCC | response to hydrogen peroxide | 102/8552 | 146/18723 | 2.64e-09 | 5.81e-08 | 102 |
| GO:003461420 | Esophagus | ESCC | cellular response to reactive oxygen species | 103/8552 | 155/18723 | 1.34e-07 | 2.17e-06 | 103 |
| GO:00703018 | Esophagus | ESCC | cellular response to hydrogen peroxide | 68/8552 | 98/18723 | 1.70e-06 | 2.03e-05 | 68 |
| GO:000697912 | Liver | Cirrhotic | response to oxidative stress | 196/4634 | 446/18723 | 2.80e-19 | 5.86e-17 | 196 |
| GO:006219712 | Liver | Cirrhotic | cellular response to chemical stress | 147/4634 | 337/18723 | 1.84e-14 | 1.72e-12 | 147 |
| GO:003459912 | Liver | Cirrhotic | cellular response to oxidative stress | 127/4634 | 288/18723 | 4.29e-13 | 3.32e-11 | 127 |
| GO:000030212 | Liver | Cirrhotic | response to reactive oxygen species | 100/4634 | 222/18723 | 2.92e-11 | 1.73e-09 | 100 |
| GO:004254212 | Liver | Cirrhotic | response to hydrogen peroxide | 71/4634 | 146/18723 | 3.40e-10 | 1.63e-08 | 71 |
| GO:00346147 | Liver | Cirrhotic | cellular response to reactive oxygen species | 70/4634 | 155/18723 | 2.27e-08 | 7.91e-07 | 70 |
| GO:00703012 | Liver | Cirrhotic | cellular response to hydrogen peroxide | 46/4634 | 98/18723 | 1.49e-06 | 2.93e-05 | 46 |
| GO:000697922 | Liver | HCC | response to oxidative stress | 281/7958 | 446/18723 | 9.75e-19 | 1.24e-16 | 281 |
| GO:006219722 | Liver | HCC | cellular response to chemical stress | 216/7958 | 337/18723 | 6.86e-16 | 5.44e-14 | 216 |
| GO:003459922 | Liver | HCC | cellular response to oxidative stress | 183/7958 | 288/18723 | 3.65e-13 | 1.93e-11 | 183 |
| GO:000030222 | Liver | HCC | response to reactive oxygen species | 144/7958 | 222/18723 | 1.24e-11 | 5.09e-10 | 144 |
| GO:004254222 | Liver | HCC | response to hydrogen peroxide | 100/7958 | 146/18723 | 1.79e-10 | 6.15e-09 | 100 |
| GO:003461412 | Liver | HCC | cellular response to reactive oxygen species | 102/7958 | 155/18723 | 3.70e-09 | 9.89e-08 | 102 |
| Page: 1 2 3 |
| Pathway ID | Tissue | Disease Stage | Description | Gene Ratio | Bg Ratio | pvalue | p.adjust | qvalue | Count |
| Page: 1 |
Top |
Cell-cell communication analysis |
| Identification of potential cell-cell interactions between two cell types and their ligand-receptor pairs for different disease states |
| Ligand | Receptor | LRpair | Pathway | Tissue | Disease Stage |
| Page: 1 |
Top |
Single-cell gene regulatory network inference analysis |
| Find out the significant the regulons (TFs) and the target genes of each regulon across cell types for different disease states |
| TF | Cell Type | Tissue | Disease Stage | Target Gene | RSS | Regulon Activity |
| ∗The dot plots of a searched regulon are shown for all cell subpopulations in each disease state of each tissue based on the regulon specific score inferred using pySCENIC and by calculating the average expression. |
| Page: 1 |
Top |
Somatic mutation of malignant transformation related genes |
| Annotation of somatic variants for genes involved in malignant transformation |
| Hugo Symbol | Variant Class | Variant Classification | dbSNP RS | HGVSc | HGVSp | HGVSp Short | SWISSPROT | BIOTYPE | SIFT | PolyPhen | Tumor Sample Barcode | Tissue | Histology | Sex | Age | Stage | Therapy Types | Drugs | Outcome |
| OSER1 | SNV | Missense_Mutation | c.180N>A | p.Asp60Glu | p.D60E | Q9NX31 | protein_coding | tolerated(1) | benign(0.068) | TCGA-A2-A25A-01 | Breast | breast invasive carcinoma | Female | <65 | I/II | Unspecific | Cytoxan | SD | |
| OSER1 | SNV | Missense_Mutation | rs781381485 | c.719N>T | p.Ser240Leu | p.S240L | Q9NX31 | protein_coding | tolerated(0.08) | benign(0.062) | TCGA-FU-A3HZ-01 | Cervix | cervical & endocervical cancer | Female | <65 | I/II | Chemotherapy | cisplatin | CR |
| OSER1 | SNV | Missense_Mutation | rs373020907 | c.235N>T | p.Arg79Cys | p.R79C | Q9NX31 | protein_coding | tolerated(0.07) | probably_damaging(0.968) | TCGA-AA-3811-01 | Colorectum | colon adenocarcinoma | Female | >=65 | III/IV | Unknown | Unknown | PD |
| OSER1 | SNV | Missense_Mutation | c.145N>T | p.Asp49Tyr | p.D49Y | Q9NX31 | protein_coding | deleterious(0.03) | probably_damaging(0.916) | TCGA-AA-3977-01 | Colorectum | colon adenocarcinoma | Male | >=65 | I/II | Unknown | Unknown | SD | |
| OSER1 | SNV | Missense_Mutation | rs777251819 | c.415G>A | p.Asp139Asn | p.D139N | Q9NX31 | protein_coding | tolerated(0.12) | benign(0.027) | TCGA-AA-3984-01 | Colorectum | colon adenocarcinoma | Female | <65 | I/II | Unknown | Unknown | SD |
| OSER1 | SNV | Missense_Mutation | c.226N>G | p.Thr76Ala | p.T76A | Q9NX31 | protein_coding | deleterious(0.02) | possibly_damaging(0.492) | TCGA-AG-3728-01 | Colorectum | rectum adenocarcinoma | Male | >=65 | III/IV | Chemotherapy | folinic | CR | |
| OSER1 | SNV | Missense_Mutation | novel | c.633N>A | p.Asp211Glu | p.D211E | Q9NX31 | protein_coding | tolerated(0.16) | benign(0.003) | TCGA-AG-A014-01 | Colorectum | rectum adenocarcinoma | Male | >=65 | I/II | Unknown | Unknown | SD |
| OSER1 | SNV | Missense_Mutation | novel | c.773G>A | p.Arg258Gln | p.R258Q | Q9NX31 | protein_coding | deleterious(0.03) | benign(0.116) | TCGA-F5-6814-01 | Colorectum | rectum adenocarcinoma | Male | <65 | I/II | Unknown | Unknown | SD |
| OSER1 | SNV | Missense_Mutation | c.639N>C | p.Glu213Asp | p.E213D | Q9NX31 | protein_coding | deleterious(0.01) | probably_damaging(0.912) | TCGA-AP-A056-01 | Endometrium | uterine corpus endometrioid carcinoma | Female | <65 | I/II | Unknown | Unknown | SD | |
| OSER1 | SNV | Missense_Mutation | c.217G>A | p.Ala73Thr | p.A73T | Q9NX31 | protein_coding | tolerated(0.35) | benign(0.01) | TCGA-AP-A0LD-01 | Endometrium | uterine corpus endometrioid carcinoma | Female | <65 | I/II | Unknown | Unknown | SD |
| Page: 1 2 3 |
Top |
Related drugs of malignant transformation related genes |
| Identification of chemicals and drugs interact with genes involved in malignant transfromation |
| (DGIdb 4.0) |
| Entrez ID | Symbol | Category | Interaction Types | Drug Claim Name | Drug Name | PMIDs |
| Page: 1 |

Copyright 2023-Present -The University of Texas Health Science Center at Houston |