
|
|||||
|
 | |
| |
| |
| |
| |
| |
|
Gene: OLA1 |
Gene summary for OLA1 |
| Gene information | Species | Human | Gene symbol | OLA1 | Gene ID | 29789 |
| Gene name | Obg like ATPase 1 | |
| Gene Alias | DOC45 | |
| Cytomap | 2q31.1 | |
| Gene Type | protein-coding | GO ID | GO:0008150 | UniProtAcc | Q9NTK5 |
Top |
Malignant transformation analysis |
| Identification of the aberrant gene expression in precancerous and cancerous lesions by comparing the gene expression of stem-like cells in diseased tissues with normal stem cells |
| Entrez ID | Symbol | Replicates | Species | Organ | Tissue | Adj P-value | Log2FC | Malignancy |
| 29789 | OLA1 | P47T-E | Human | Esophagus | ESCC | 4.69e-44 | 1.00e+00 | 0.1067 |
| 29789 | OLA1 | P48T-E | Human | Esophagus | ESCC | 1.39e-35 | 9.08e-01 | 0.0959 |
| 29789 | OLA1 | P49T-E | Human | Esophagus | ESCC | 2.40e-20 | 2.78e+00 | 0.1768 |
| 29789 | OLA1 | P52T-E | Human | Esophagus | ESCC | 2.52e-57 | 1.89e+00 | 0.1555 |
| 29789 | OLA1 | P54T-E | Human | Esophagus | ESCC | 1.06e-27 | 8.88e-01 | 0.0975 |
| 29789 | OLA1 | P56T-E | Human | Esophagus | ESCC | 3.90e-15 | 2.64e+00 | 0.1613 |
| 29789 | OLA1 | P57T-E | Human | Esophagus | ESCC | 1.77e-40 | 9.06e-01 | 0.0926 |
| 29789 | OLA1 | P61T-E | Human | Esophagus | ESCC | 9.27e-25 | 9.56e-01 | 0.099 |
| 29789 | OLA1 | P62T-E | Human | Esophagus | ESCC | 1.36e-79 | 1.73e+00 | 0.1302 |
| 29789 | OLA1 | P65T-E | Human | Esophagus | ESCC | 1.91e-34 | 7.83e-01 | 0.0978 |
| 29789 | OLA1 | P74T-E | Human | Esophagus | ESCC | 7.40e-66 | 2.70e+00 | 0.1479 |
| 29789 | OLA1 | P75T-E | Human | Esophagus | ESCC | 5.51e-86 | 1.94e+00 | 0.1125 |
| 29789 | OLA1 | P76T-E | Human | Esophagus | ESCC | 9.40e-68 | 1.52e+00 | 0.1207 |
| 29789 | OLA1 | P79T-E | Human | Esophagus | ESCC | 1.41e-65 | 1.30e+00 | 0.1154 |
| 29789 | OLA1 | P80T-E | Human | Esophagus | ESCC | 3.59e-51 | 1.88e+00 | 0.155 |
| 29789 | OLA1 | P82T-E | Human | Esophagus | ESCC | 4.24e-24 | 1.70e+00 | 0.1072 |
| 29789 | OLA1 | P83T-E | Human | Esophagus | ESCC | 6.83e-53 | 1.81e+00 | 0.1738 |
| 29789 | OLA1 | P84T-E | Human | Esophagus | ESCC | 5.84e-10 | 9.82e-01 | 0.0933 |
| 29789 | OLA1 | P89T-E | Human | Esophagus | ESCC | 1.48e-38 | 2.97e+00 | 0.1752 |
| 29789 | OLA1 | P91T-E | Human | Esophagus | ESCC | 1.50e-20 | 2.47e+00 | 0.1828 |
| Page: 1 2 3 4 5 6 7 8 9 10 |
| Tissue | Expression Dynamics | Abbreviation |
| Cervix | 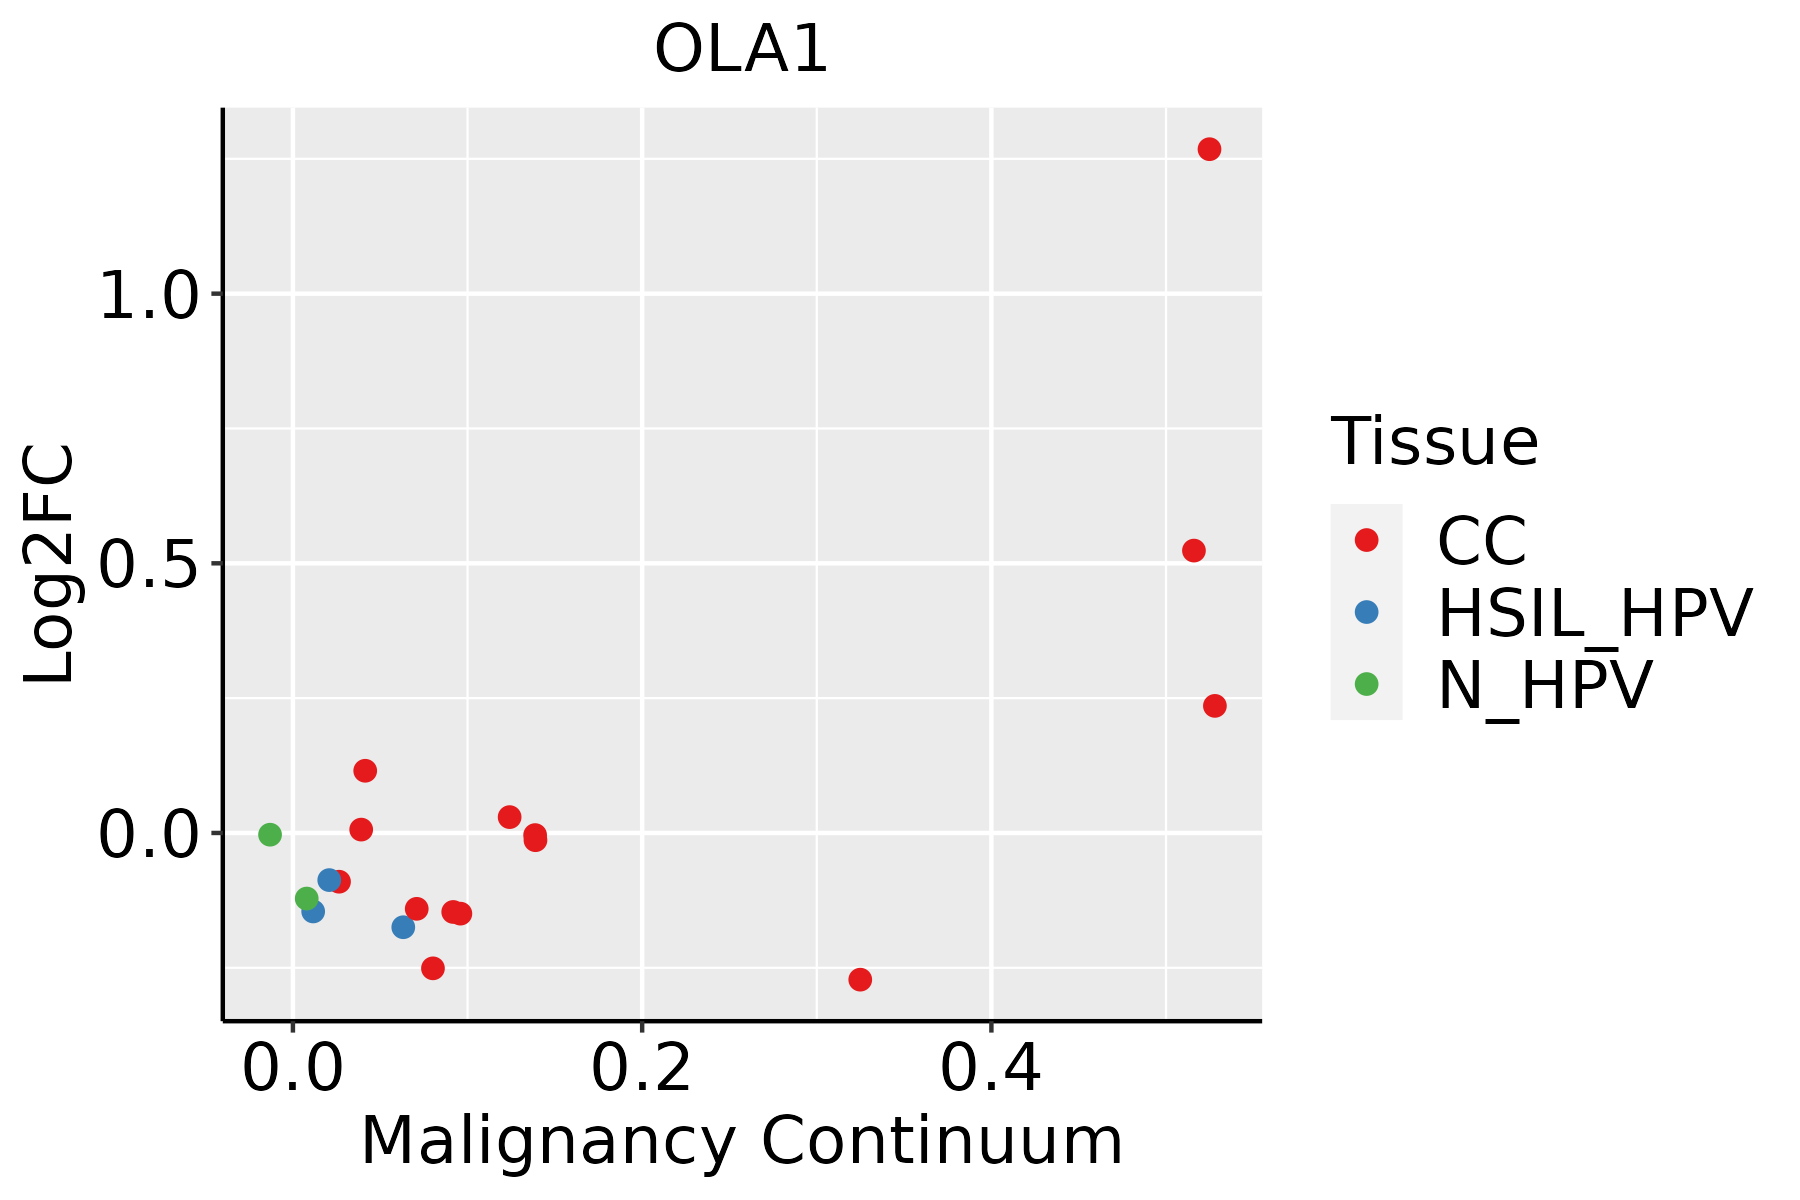 | CC: Cervix cancer |
| HSIL_HPV: HPV-infected high-grade squamous intraepithelial lesions | ||
| N_HPV: HPV-infected normal cervix | ||
| Colorectum (GSE201348) |  | FAP: Familial adenomatous polyposis |
| CRC: Colorectal cancer | ||
| Colorectum (HTA11) |  | AD: Adenomas |
| SER: Sessile serrated lesions | ||
| MSI-H: Microsatellite-high colorectal cancer | ||
| MSS: Microsatellite stable colorectal cancer | ||
| Esophagus | 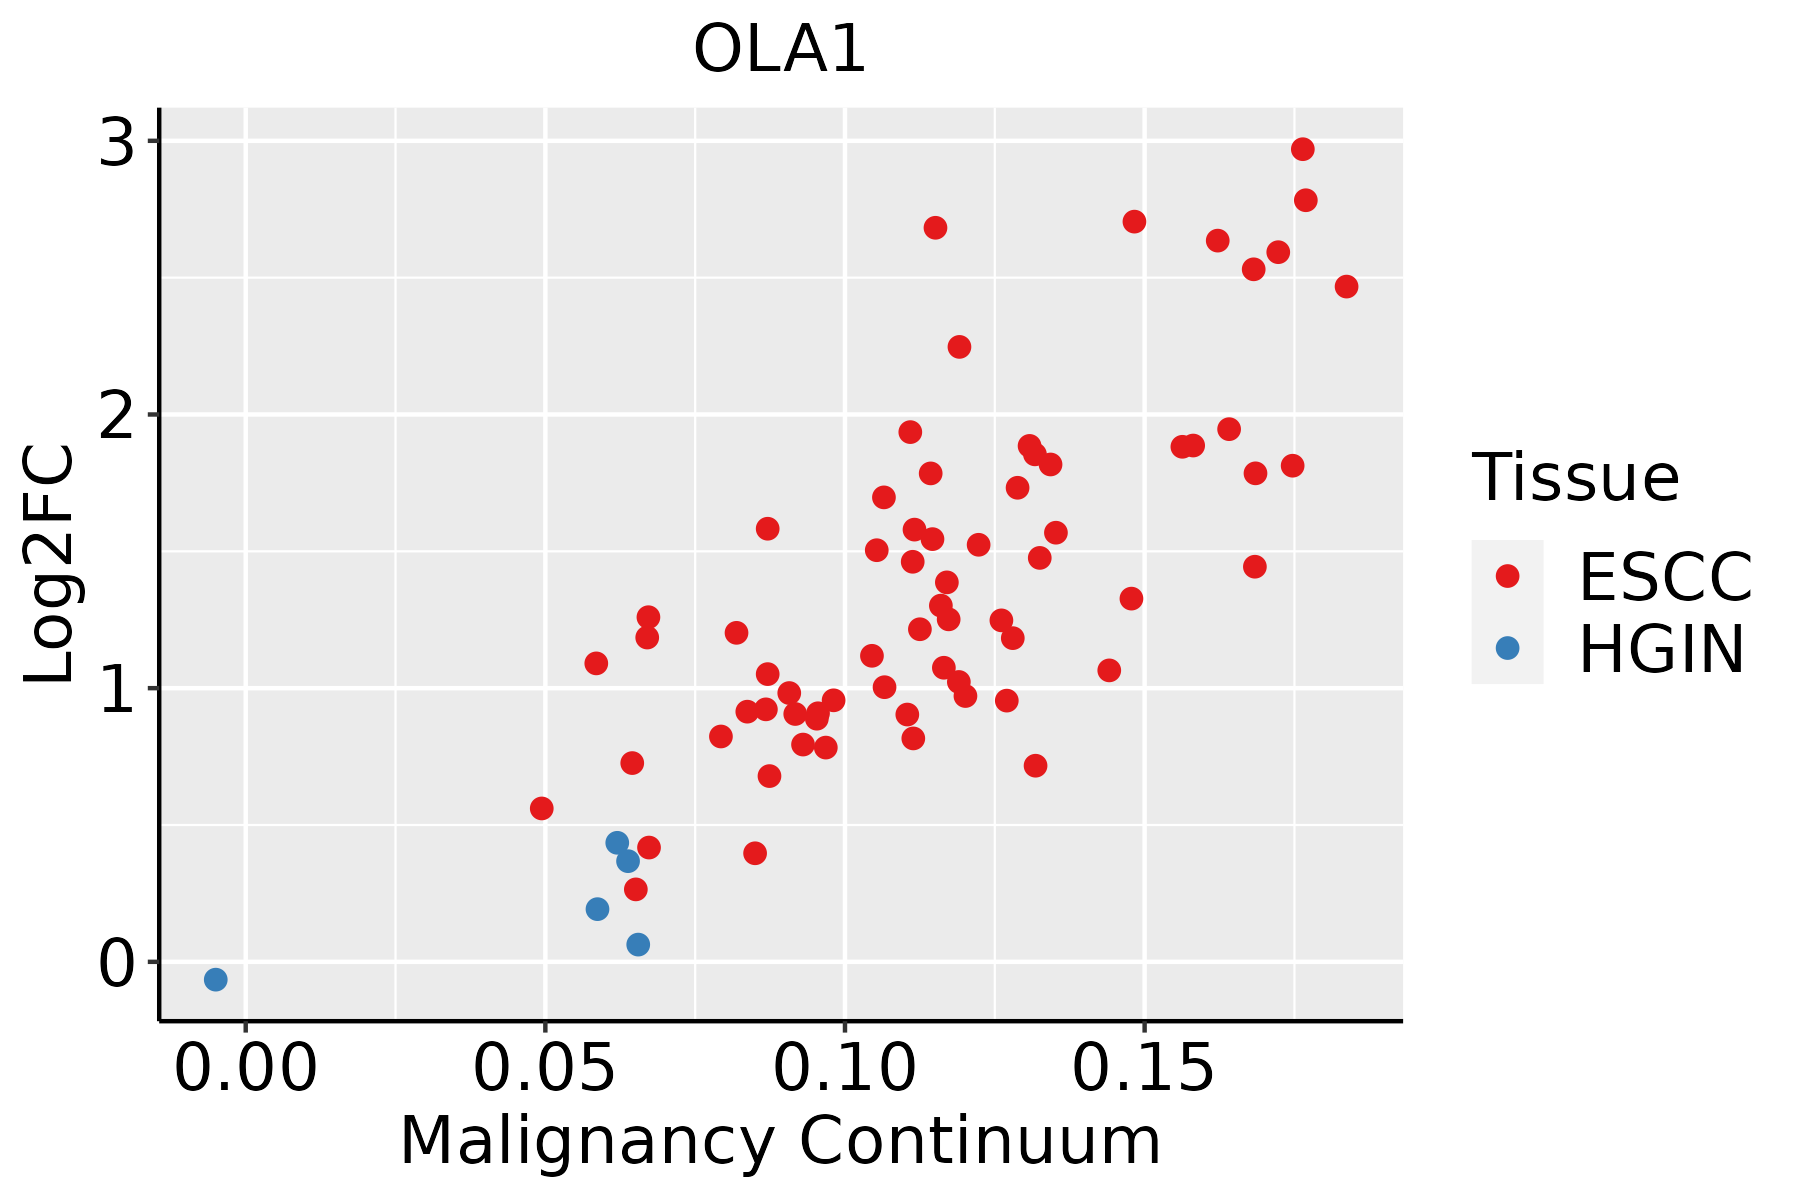 | ESCC: Esophageal squamous cell carcinoma |
| HGIN: High-grade intraepithelial neoplasias | ||
| LGIN: Low-grade intraepithelial neoplasias | ||
| Liver | 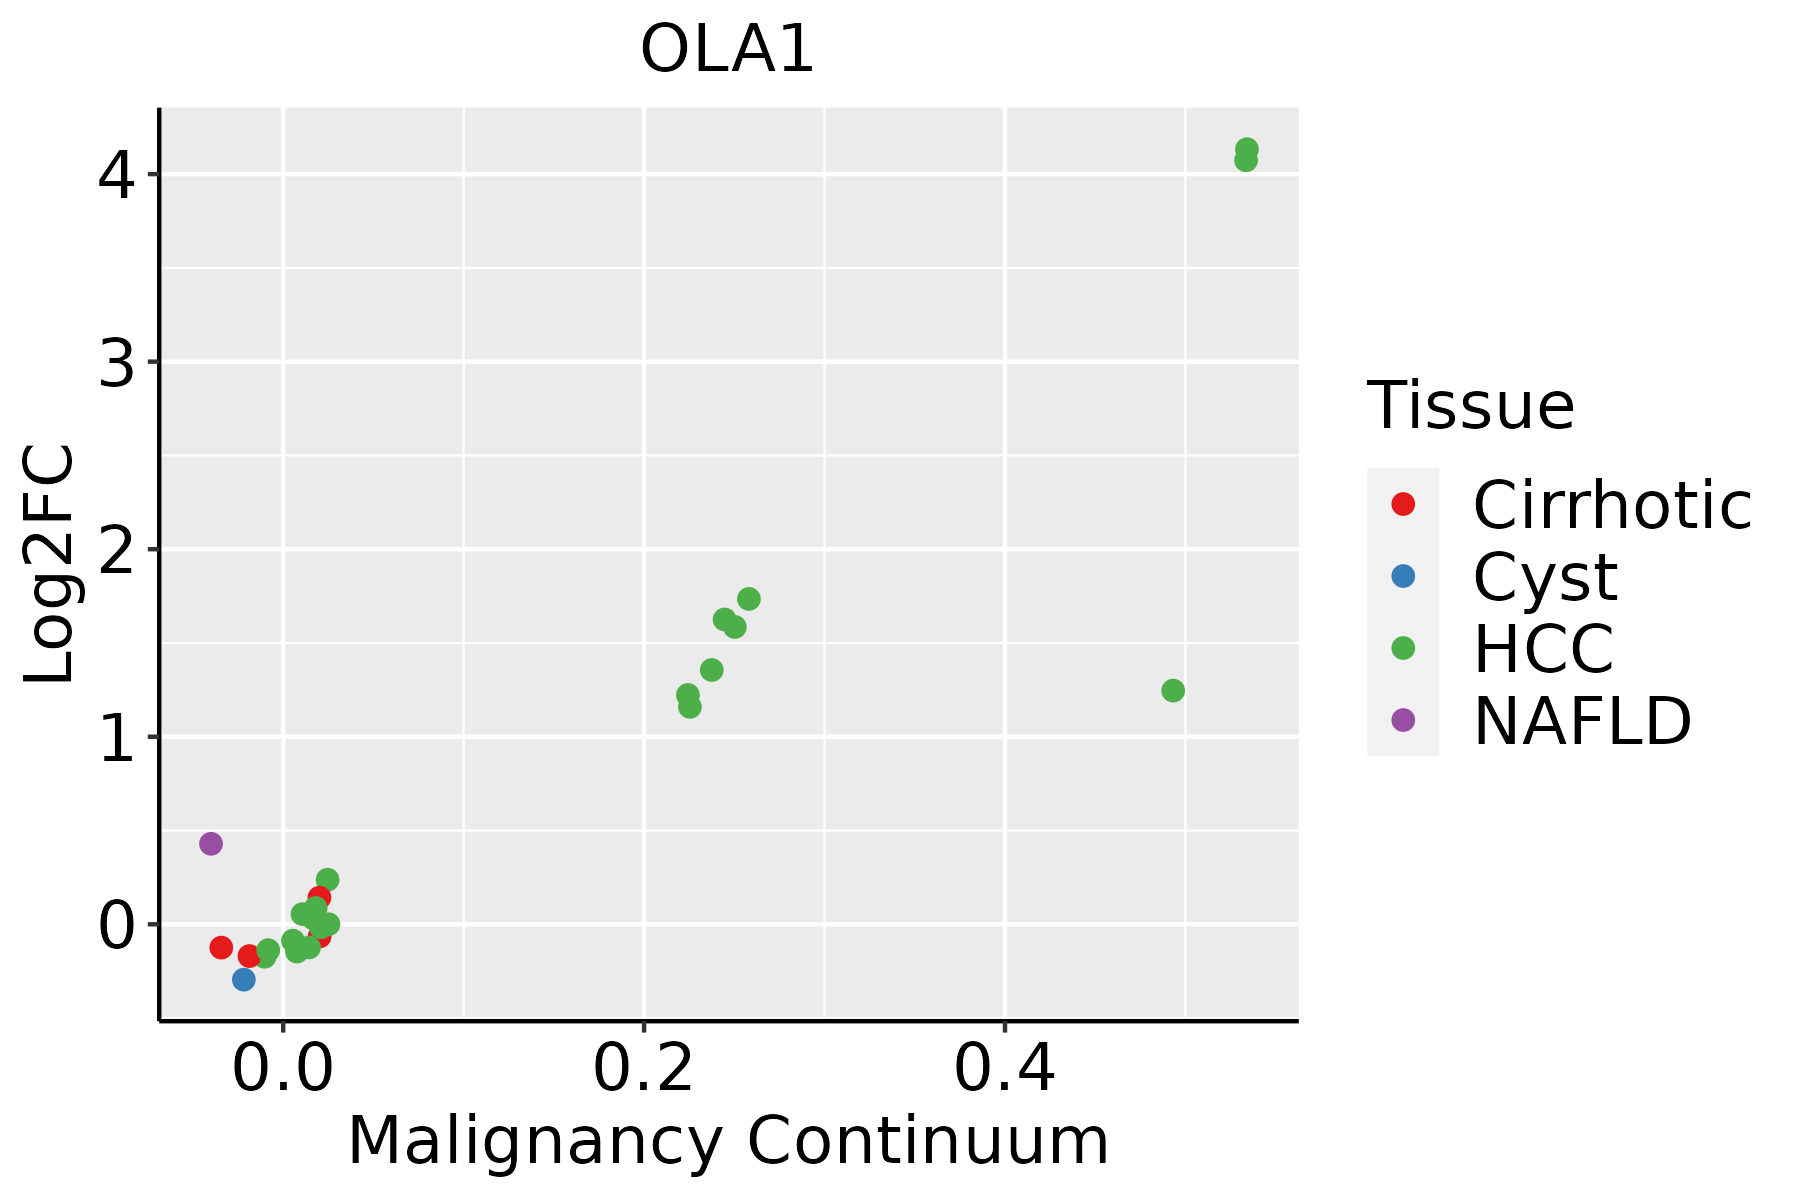 | HCC: Hepatocellular carcinoma |
| NAFLD: Non-alcoholic fatty liver disease | ||
| Lung | 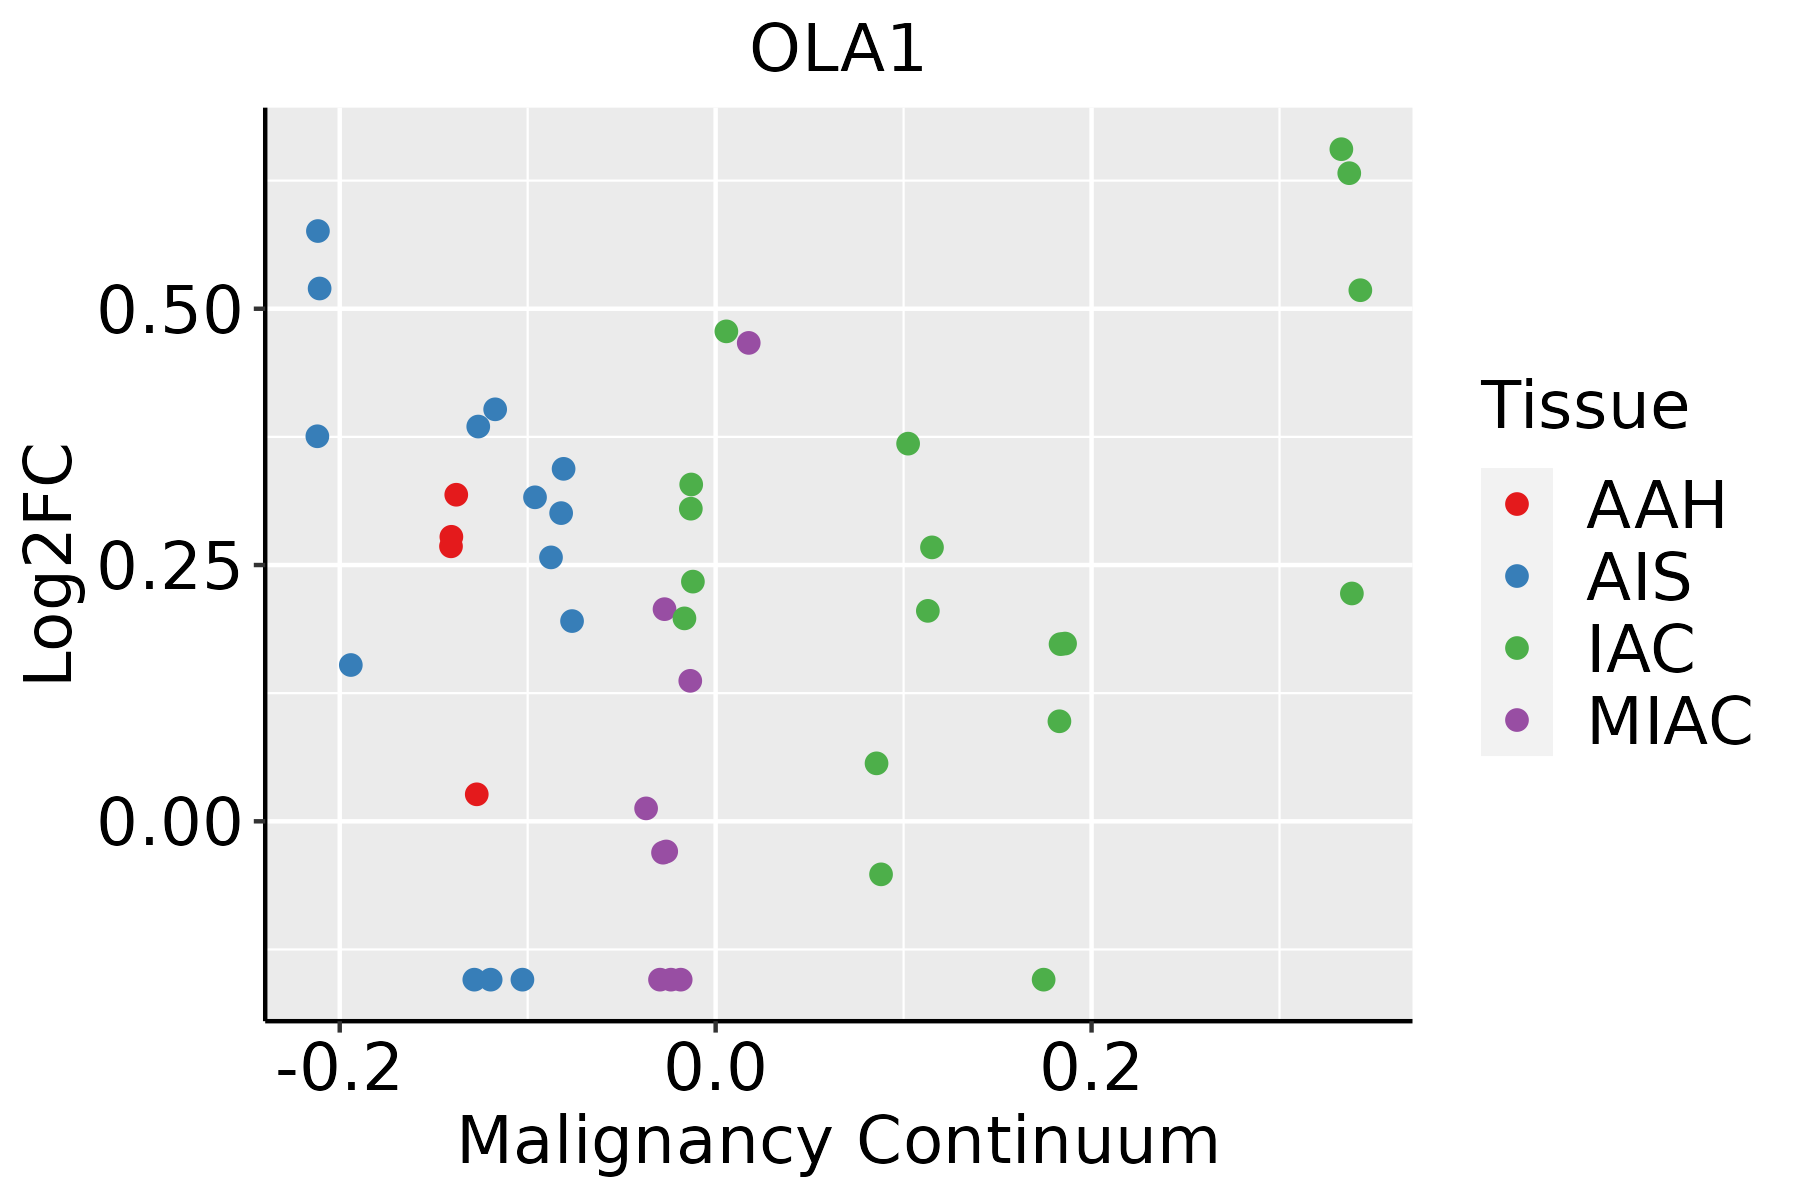 | AAH: Atypical adenomatous hyperplasia |
| AIS: Adenocarcinoma in situ | ||
| IAC: Invasive lung adenocarcinoma | ||
| MIA: Minimally invasive adenocarcinoma | ||
| Oral Cavity | 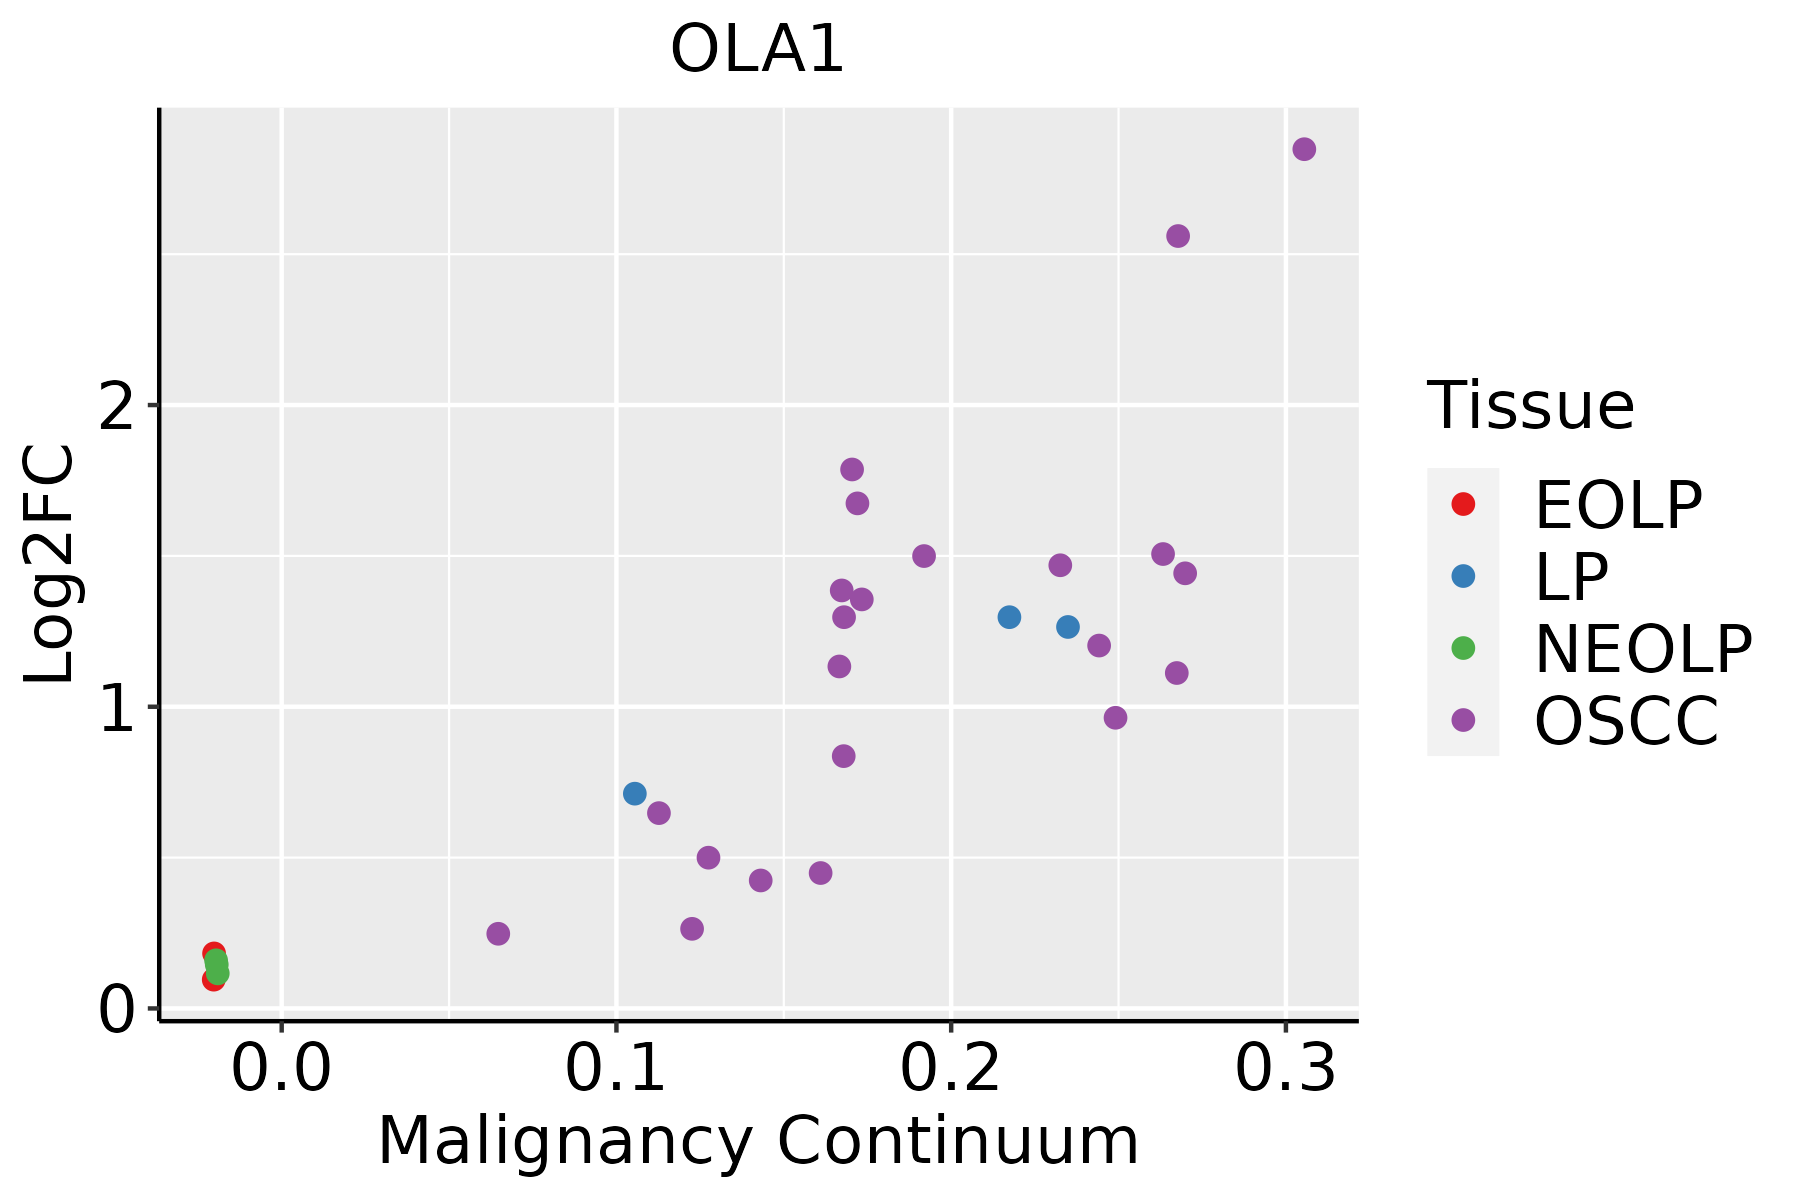 | EOLP: Erosive Oral lichen planus |
| LP: leukoplakia | ||
| NEOLP: Non-erosive oral lichen planus | ||
| OSCC: Oral squamous cell carcinoma | ||
| Skin |  | AK: Actinic keratosis |
| cSCC: Cutaneous squamous cell carcinoma | ||
| SCCIS:squamous cell carcinoma in situ | ||
| Thyroid | 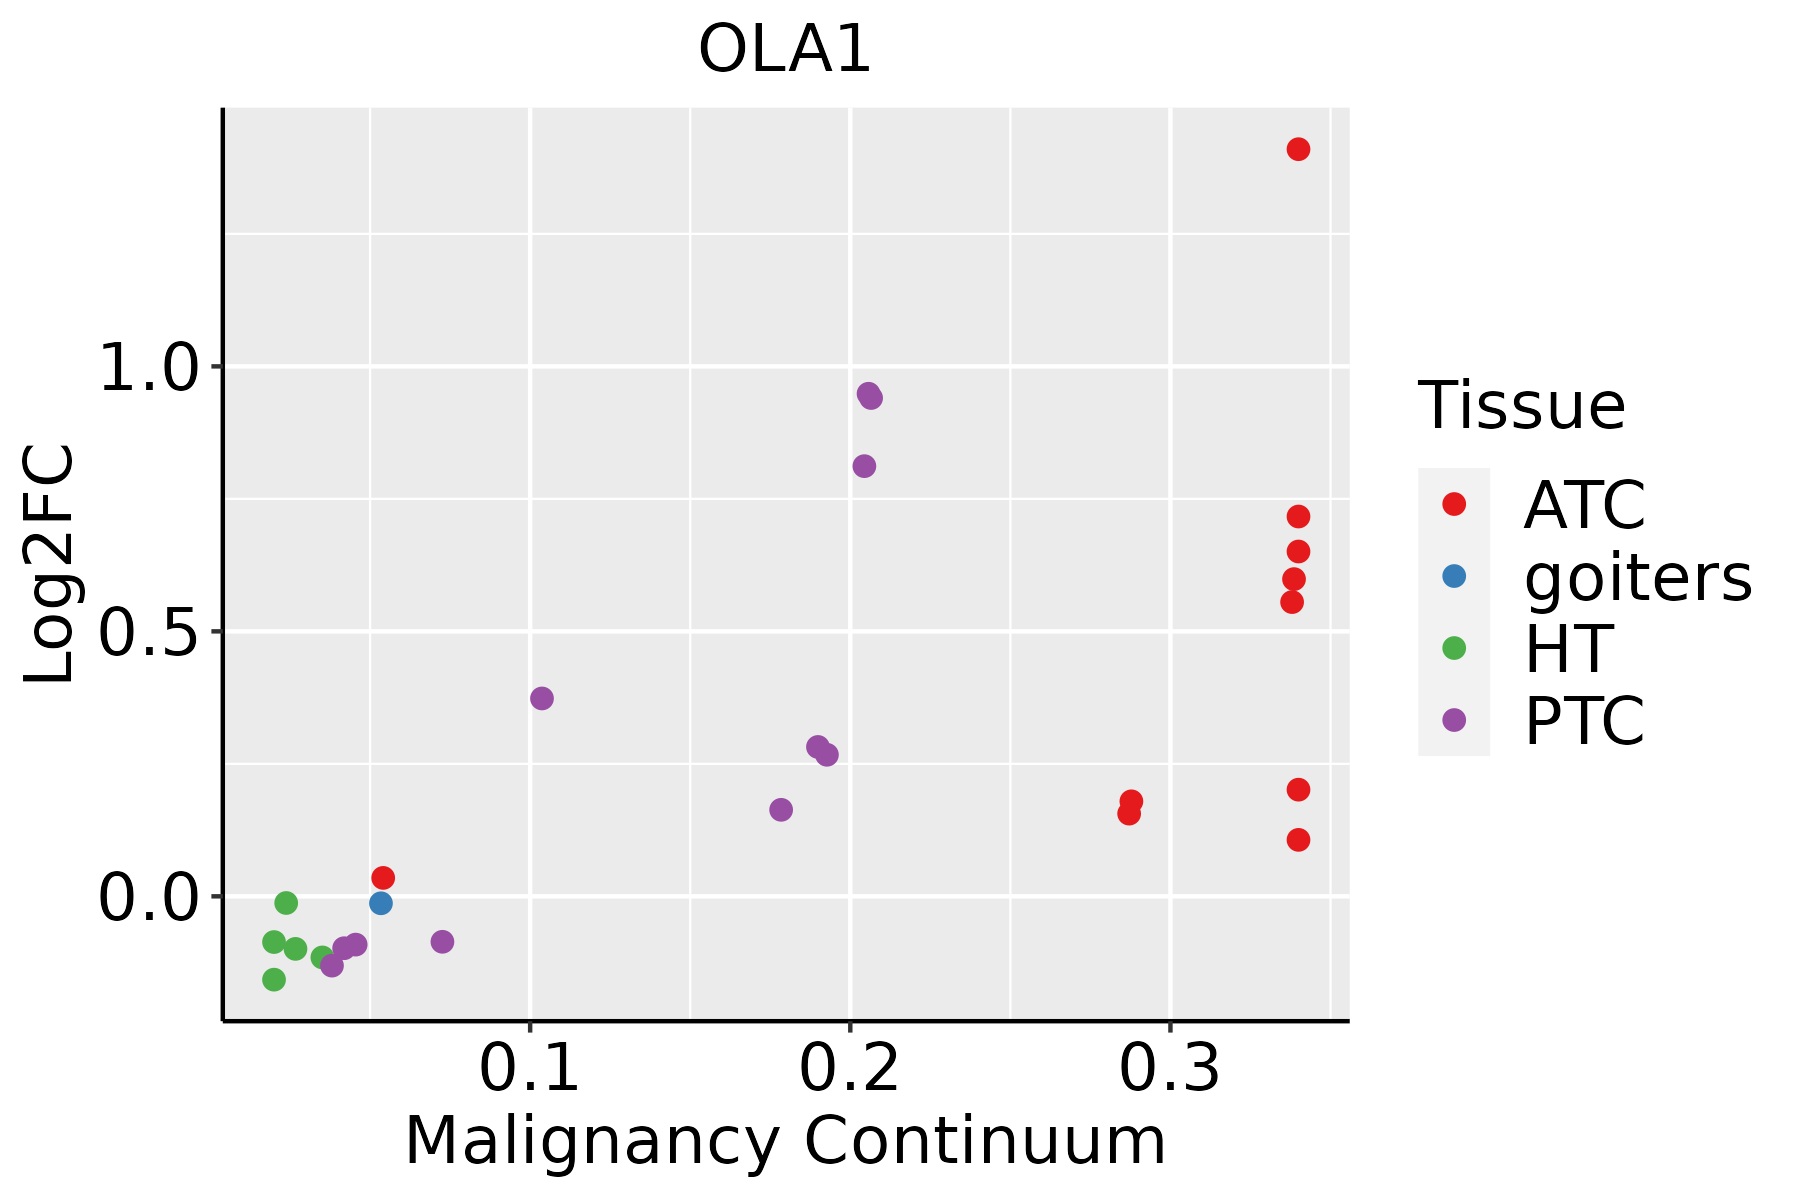 | ATC: Anaplastic thyroid cancer |
| HT: Hashimoto's thyroiditis | ||
| PTC: Papillary thyroid cancer |
| ∗log2FC in expression of this searched gene in stem-like cells from each diseased tissue sample relative to stem-like cells in normal samples in each tissue plotted against the malignancy continuum. Samples are colored based on if they are from different disease stage. |
Top |
Malignant transformation related pathway analysis |
| Find out the enriched GO biological processes and KEGG pathways involved in transition from healthy to precancer to cancer |
| Tissue | Disease Stage | Enriched GO biological Processes |
| Colorectum | AD |  |
| Colorectum | SER |  |
| Colorectum | MSS |  |
| Colorectum | MSI-H |  |
| Colorectum | FAP |  |
| ∗Top 15 enriched GO BP terms are showed in the bar plot of each disease state in each tissue. Each row represents a significant GO biological process which is colored according to the -log10(p.adjust). |
| Page: 1 2 3 4 5 6 7 8 9 |
| GO ID | Tissue | Disease Stage | Description | Gene Ratio | Bg Ratio | pvalue | p.adjust | Count |
| GO:004603410 | Cervix | CC | ATP metabolic process | 90/2311 | 277/18723 | 7.90e-19 | 2.36e-15 | 90 |
| GO:00062602 | Cervix | CC | DNA replication | 48/2311 | 260/18723 | 2.70e-03 | 1.85e-02 | 48 |
| GO:00324791 | Cervix | CC | regulation of type I interferon production | 21/2311 | 95/18723 | 5.32e-03 | 3.10e-02 | 21 |
| GO:00326061 | Cervix | CC | type I interferon production | 21/2311 | 95/18723 | 5.32e-03 | 3.10e-02 | 21 |
| GO:0046034 | Colorectum | AD | ATP metabolic process | 142/3918 | 277/18723 | 2.64e-29 | 8.26e-26 | 142 |
| GO:00460341 | Colorectum | SER | ATP metabolic process | 117/2897 | 277/18723 | 5.54e-27 | 1.13e-23 | 117 |
| GO:00460343 | Colorectum | MSI-H | ATP metabolic process | 71/1319 | 277/18723 | 3.18e-22 | 8.32e-19 | 71 |
| GO:00460344 | Colorectum | FAP | ATP metabolic process | 87/2622 | 277/18723 | 6.50e-14 | 6.63e-11 | 87 |
| GO:00460345 | Colorectum | CRC | ATP metabolic process | 51/2078 | 277/18723 | 1.92e-04 | 3.30e-03 | 51 |
| GO:00718977 | Endometrium | AEH | DNA biosynthetic process | 37/2100 | 180/18723 | 1.87e-04 | 2.39e-03 | 37 |
| GO:004603427 | Esophagus | HGIN | ATP metabolic process | 101/2587 | 277/18723 | 1.53e-21 | 1.02e-18 | 101 |
| GO:0046034111 | Esophagus | ESCC | ATP metabolic process | 189/8552 | 277/18723 | 1.99e-14 | 1.04e-12 | 189 |
| GO:004603412 | Liver | Cirrhotic | ATP metabolic process | 144/4634 | 277/18723 | 1.04e-22 | 5.02e-20 | 144 |
| GO:004603422 | Liver | HCC | ATP metabolic process | 198/7958 | 277/18723 | 8.30e-23 | 1.55e-20 | 198 |
| GO:00460348 | Lung | IAC | ATP metabolic process | 49/2061 | 277/18723 | 5.44e-04 | 7.59e-03 | 49 |
| GO:004603413 | Lung | AIS | ATP metabolic process | 42/1849 | 277/18723 | 3.31e-03 | 3.16e-02 | 42 |
| GO:004603420 | Oral cavity | OSCC | ATP metabolic process | 166/7305 | 277/18723 | 1.16e-12 | 5.12e-11 | 166 |
| GO:0046034110 | Oral cavity | LP | ATP metabolic process | 128/4623 | 277/18723 | 3.95e-15 | 5.38e-13 | 128 |
| GO:004603426 | Oral cavity | EOLP | ATP metabolic process | 68/2218 | 277/18723 | 2.72e-09 | 1.71e-07 | 68 |
| GO:004603433 | Oral cavity | NEOLP | ATP metabolic process | 71/2005 | 277/18723 | 1.44e-12 | 3.17e-10 | 71 |
| Page: 1 2 |
| Pathway ID | Tissue | Disease Stage | Description | Gene Ratio | Bg Ratio | pvalue | p.adjust | qvalue | Count |
| Page: 1 |
Top |
Cell-cell communication analysis |
| Identification of potential cell-cell interactions between two cell types and their ligand-receptor pairs for different disease states |
| Ligand | Receptor | LRpair | Pathway | Tissue | Disease Stage |
| Page: 1 |
Top |
Single-cell gene regulatory network inference analysis |
| Find out the significant the regulons (TFs) and the target genes of each regulon across cell types for different disease states |
| TF | Cell Type | Tissue | Disease Stage | Target Gene | RSS | Regulon Activity |
| ∗The dot plots of a searched regulon are shown for all cell subpopulations in each disease state of each tissue based on the regulon specific score inferred using pySCENIC and by calculating the average expression. |
| Page: 1 |
Top |
Somatic mutation of malignant transformation related genes |
| Annotation of somatic variants for genes involved in malignant transformation |
| Hugo Symbol | Variant Class | Variant Classification | dbSNP RS | HGVSc | HGVSp | HGVSp Short | SWISSPROT | BIOTYPE | SIFT | PolyPhen | Tumor Sample Barcode | Tissue | Histology | Sex | Age | Stage | Therapy Types | Drugs | Outcome |
| OLA1 | SNV | Missense_Mutation | c.799N>A | p.Leu267Met | p.L267M | Q9NTK5 | protein_coding | tolerated(0.06) | benign(0.103) | TCGA-A8-A07P-01 | Breast | breast invasive carcinoma | Female | >=65 | I/II | Chemotherapy | 5-fluorouracil | SD | |
| OLA1 | SNV | Missense_Mutation | c.301N>G | p.His101Asp | p.H101D | Q9NTK5 | protein_coding | tolerated(0.05) | benign(0.232) | TCGA-AC-A23H-01 | Breast | breast invasive carcinoma | Female | >=65 | I/II | Unknown | Unknown | PD | |
| OLA1 | SNV | Missense_Mutation | rs781608678 | c.1044N>A | p.Met348Ile | p.M348I | Q9NTK5 | protein_coding | tolerated(0.11) | benign(0.146) | TCGA-BH-A2L8-01 | Breast | breast invasive carcinoma | Female | <65 | I/II | Chemotherapy | cytoxan | CR |
| OLA1 | SNV | Missense_Mutation | rs375033952 | c.949N>T | p.Arg317Cys | p.R317C | Q9NTK5 | protein_coding | deleterious(0) | probably_damaging(0.975) | TCGA-D8-A1XK-01 | Breast | breast invasive carcinoma | Female | <65 | I/II | Chemotherapy | doxorubicine+cyclophosphamide | SD |
| OLA1 | SNV | Missense_Mutation | novel | c.205G>A | p.Glu69Lys | p.E69K | Q9NTK5 | protein_coding | tolerated(0.11) | benign(0.022) | TCGA-C5-A1MN-01 | Cervix | cervical & endocervical cancer | Female | <65 | III/IV | Chemotherapy | cisplatin | SD |
| OLA1 | SNV | Missense_Mutation | c.107N>G | p.Ser36Cys | p.S36C | Q9NTK5 | protein_coding | deleterious(0) | probably_damaging(1) | TCGA-DR-A0ZM-01 | Cervix | cervical & endocervical cancer | Female | <65 | III/IV | Unspecific | Cisplatin | SD | |
| OLA1 | SNV | Missense_Mutation | c.634G>A | p.Glu212Lys | p.E212K | Q9NTK5 | protein_coding | deleterious(0.01) | possibly_damaging(0.841) | TCGA-LP-A5U2-01 | Cervix | cervical & endocervical cancer | Female | <65 | III/IV | Unknown | Unknown | SD | |
| OLA1 | SNV | Missense_Mutation | rs748811959 | c.211N>G | p.Phe71Val | p.F71V | Q9NTK5 | protein_coding | deleterious(0) | probably_damaging(0.957) | TCGA-A6-2686-01 | Colorectum | colon adenocarcinoma | Female | >=65 | I/II | Unknown | Unknown | SD |
| OLA1 | SNV | Missense_Mutation | novel | c.1051G>A | p.Glu351Lys | p.E351K | Q9NTK5 | protein_coding | tolerated(0.15) | benign(0.025) | TCGA-AA-3877-01 | Colorectum | colon adenocarcinoma | Female | >=65 | I/II | Unknown | Unknown | SD |
| OLA1 | SNV | Missense_Mutation | c.724N>G | p.Lys242Glu | p.K242E | Q9NTK5 | protein_coding | deleterious(0.02) | possibly_damaging(0.612) | TCGA-CK-4951-01 | Colorectum | colon adenocarcinoma | Female | >=65 | I/II | Unknown | Unknown | PD |
| Page: 1 2 3 4 |
Top |
Related drugs of malignant transformation related genes |
| Identification of chemicals and drugs interact with genes involved in malignant transfromation |
| (DGIdb 4.0) |
| Entrez ID | Symbol | Category | Interaction Types | Drug Claim Name | Drug Name | PMIDs |
| Page: 1 |

Copyright 2023-Present -The University of Texas Health Science Center at Houston |