
|
|||||
|
 | |
| |
| |
| |
| |
| |
|
Gene: ODF3B |
Gene summary for ODF3B |
| Gene information | Species | Human | Gene symbol | ODF3B | Gene ID | 440836 |
| Gene name | outer dense fiber of sperm tails 3B | |
| Gene Alias | FAP123 | |
| Cytomap | 22q13.33 | |
| Gene Type | protein-coding | GO ID | GO:0005575 | UniProtAcc | A1L1A8 |
Top |
Malignant transformation analysis |
| Identification of the aberrant gene expression in precancerous and cancerous lesions by comparing the gene expression of stem-like cells in diseased tissues with normal stem cells |
| Entrez ID | Symbol | Replicates | Species | Organ | Tissue | Adj P-value | Log2FC | Malignancy |
| 440836 | ODF3B | C51 | Human | Oral cavity | OSCC | 5.30e-18 | 9.87e-01 | 0.2674 |
| 440836 | ODF3B | C57 | Human | Oral cavity | OSCC | 1.28e-22 | 8.21e-01 | 0.1679 |
| 440836 | ODF3B | C08 | Human | Oral cavity | OSCC | 5.56e-22 | 6.05e-01 | 0.1919 |
| 440836 | ODF3B | LN22 | Human | Oral cavity | OSCC | 2.48e-02 | 7.22e-01 | 0.1733 |
| 440836 | ODF3B | LN46 | Human | Oral cavity | OSCC | 4.41e-23 | 1.02e+00 | 0.1666 |
| 440836 | ODF3B | LP15 | Human | Oral cavity | LP | 6.93e-12 | 1.91e+00 | 0.2174 |
| 440836 | ODF3B | LP17 | Human | Oral cavity | LP | 1.25e-05 | 7.55e-01 | 0.2349 |
| 440836 | ODF3B | SYSMH1 | Human | Oral cavity | OSCC | 2.33e-16 | 4.56e-01 | 0.1127 |
| 440836 | ODF3B | SYSMH2 | Human | Oral cavity | OSCC | 2.70e-23 | 5.62e-01 | 0.2326 |
| 440836 | ODF3B | SYSMH3 | Human | Oral cavity | OSCC | 2.88e-16 | 4.09e-01 | 0.2442 |
| 440836 | ODF3B | SYSMH4 | Human | Oral cavity | OSCC | 2.77e-06 | 2.50e-01 | 0.1226 |
| 440836 | ODF3B | SYSMH6 | Human | Oral cavity | OSCC | 2.50e-02 | 2.17e-01 | 0.1275 |
| 440836 | ODF3B | P5_S10_cSCC | Human | Skin | cSCC | 2.41e-07 | 1.58e-01 | -0.299 |
| 440836 | ODF3B | P1_cSCC | Human | Skin | cSCC | 6.36e-09 | 6.57e-01 | 0.0292 |
| 440836 | ODF3B | P2_cSCC | Human | Skin | cSCC | 1.79e-02 | 2.94e-01 | -0.024 |
| 440836 | ODF3B | P4_cSCC | Human | Skin | cSCC | 3.47e-11 | 4.97e-01 | -0.00290000000000005 |
| 440836 | ODF3B | cSCC_p8 | Human | Skin | cSCC | 1.71e-19 | 4.63e-01 | -0.1971 |
| 440836 | ODF3B | cSCC_p9 | Human | Skin | cSCC | 5.67e-03 | 6.22e-02 | -0.1991 |
| 440836 | ODF3B | PTC01 | Human | Thyroid | PTC | 1.90e-02 | 1.07e-01 | 0.1899 |
| 440836 | ODF3B | PTC05 | Human | Thyroid | PTC | 1.22e-04 | 3.75e-01 | 0.2065 |
| Page: 1 2 3 4 5 6 |
| Tissue | Expression Dynamics | Abbreviation |
| Esophagus | 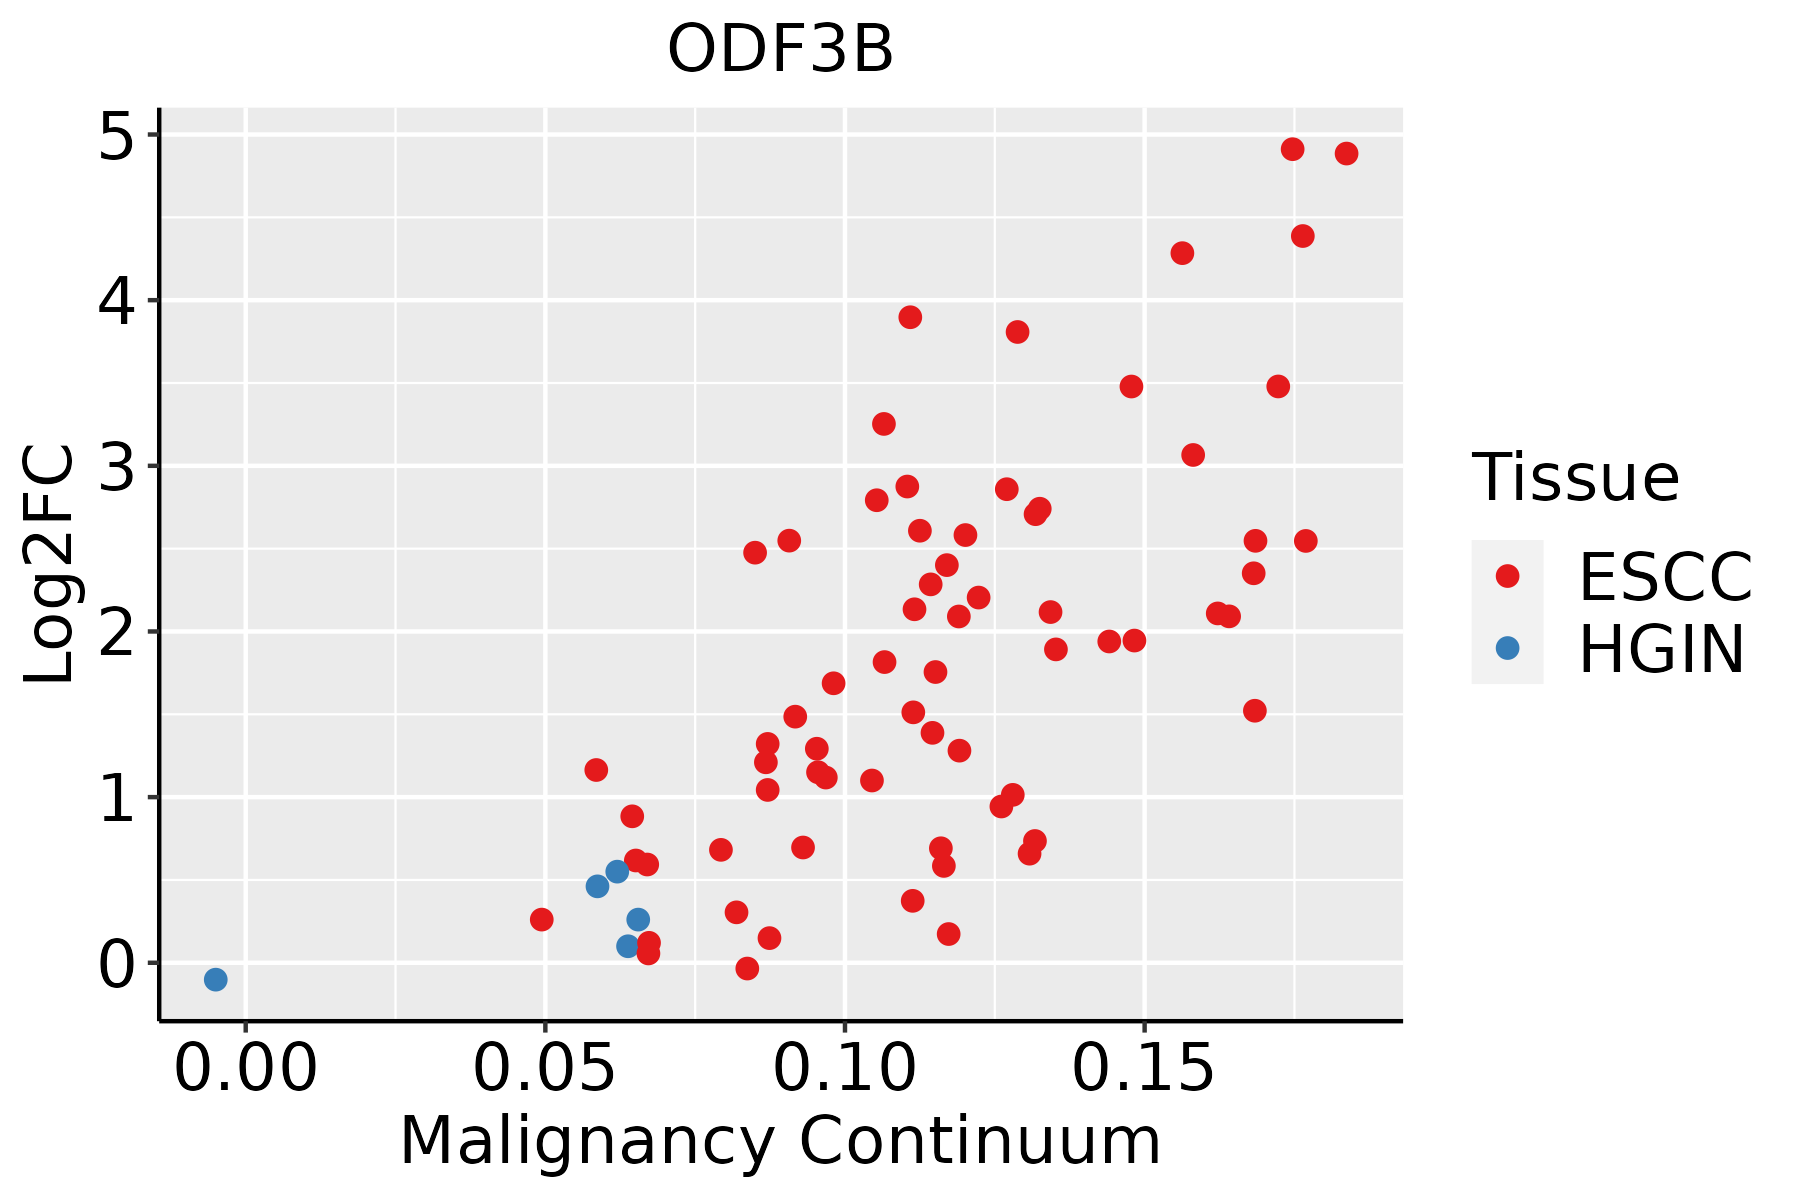 | ESCC: Esophageal squamous cell carcinoma |
| HGIN: High-grade intraepithelial neoplasias | ||
| LGIN: Low-grade intraepithelial neoplasias | ||
| Liver | 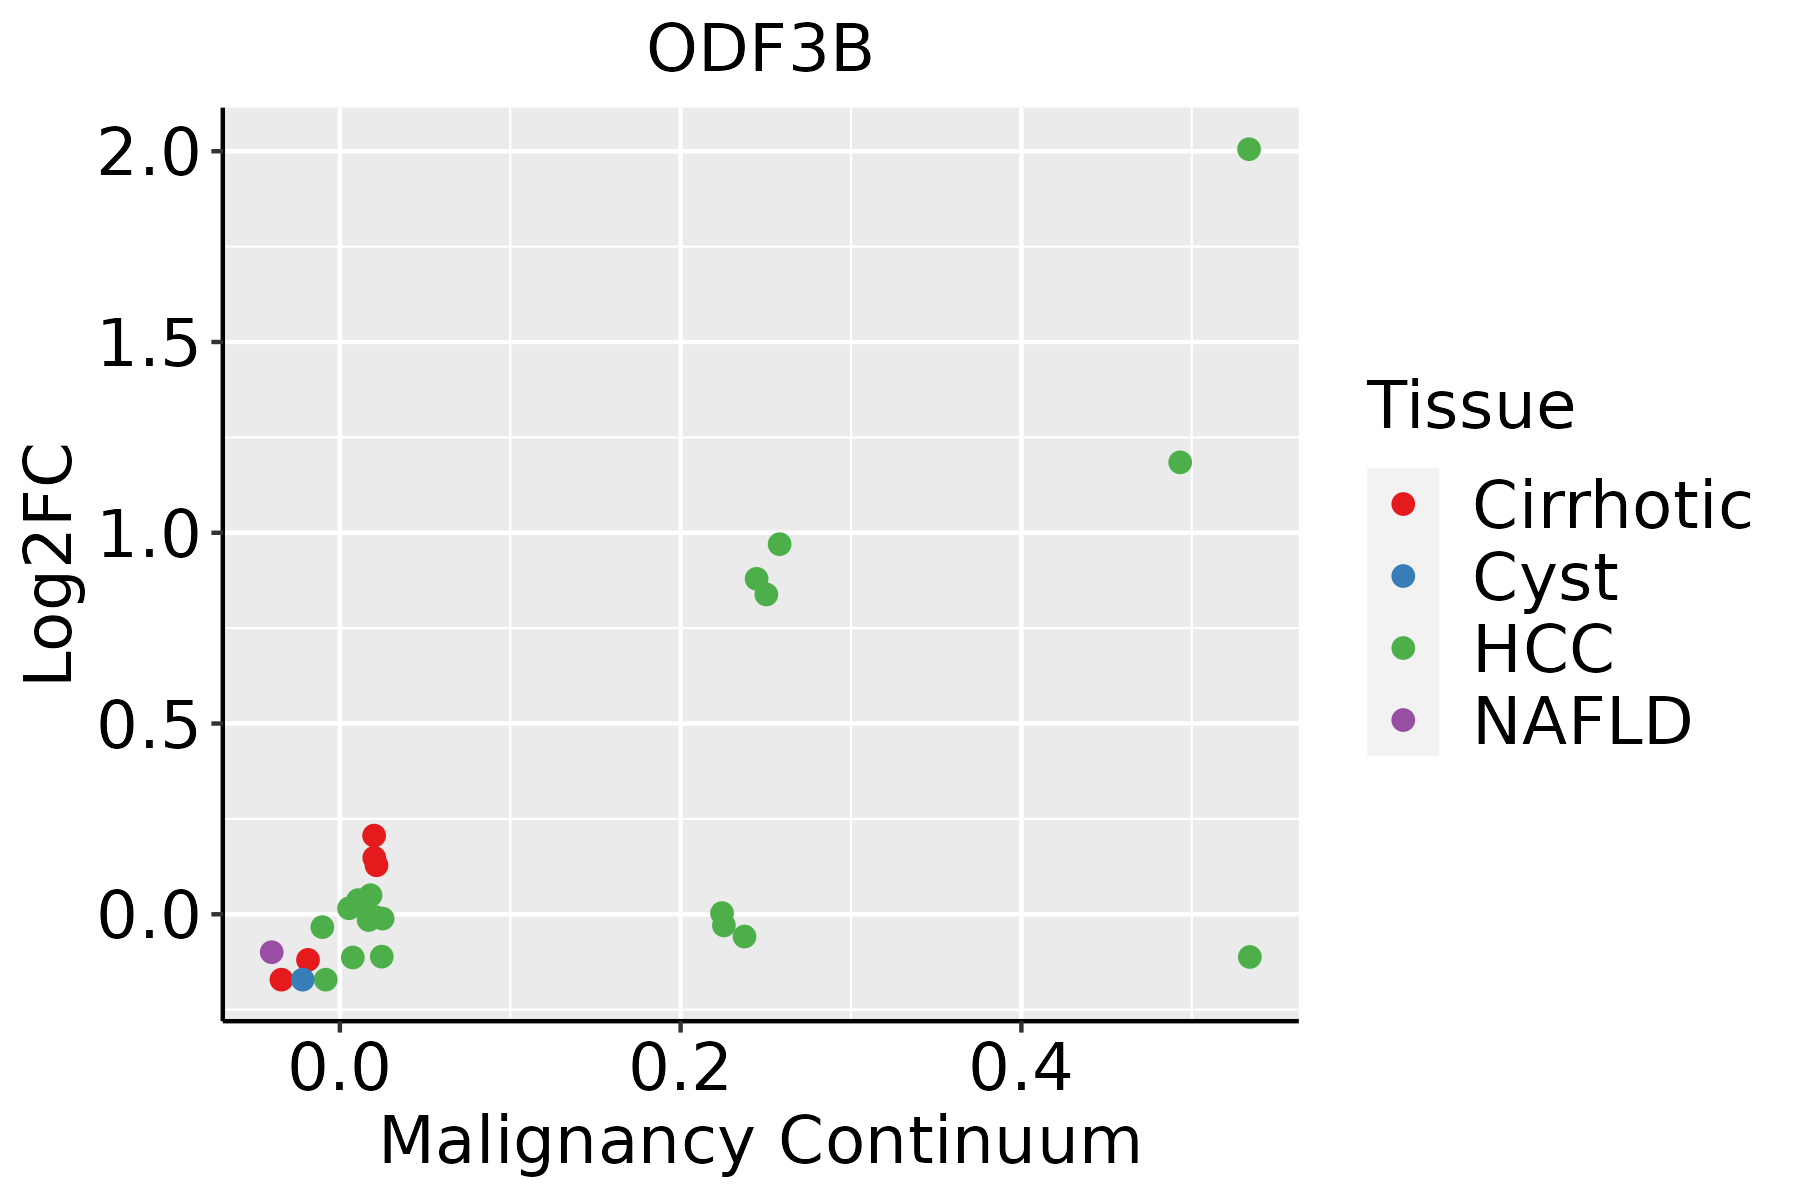 | HCC: Hepatocellular carcinoma |
| NAFLD: Non-alcoholic fatty liver disease | ||
| Oral Cavity |  | EOLP: Erosive Oral lichen planus |
| LP: leukoplakia | ||
| NEOLP: Non-erosive oral lichen planus | ||
| OSCC: Oral squamous cell carcinoma | ||
| Skin | 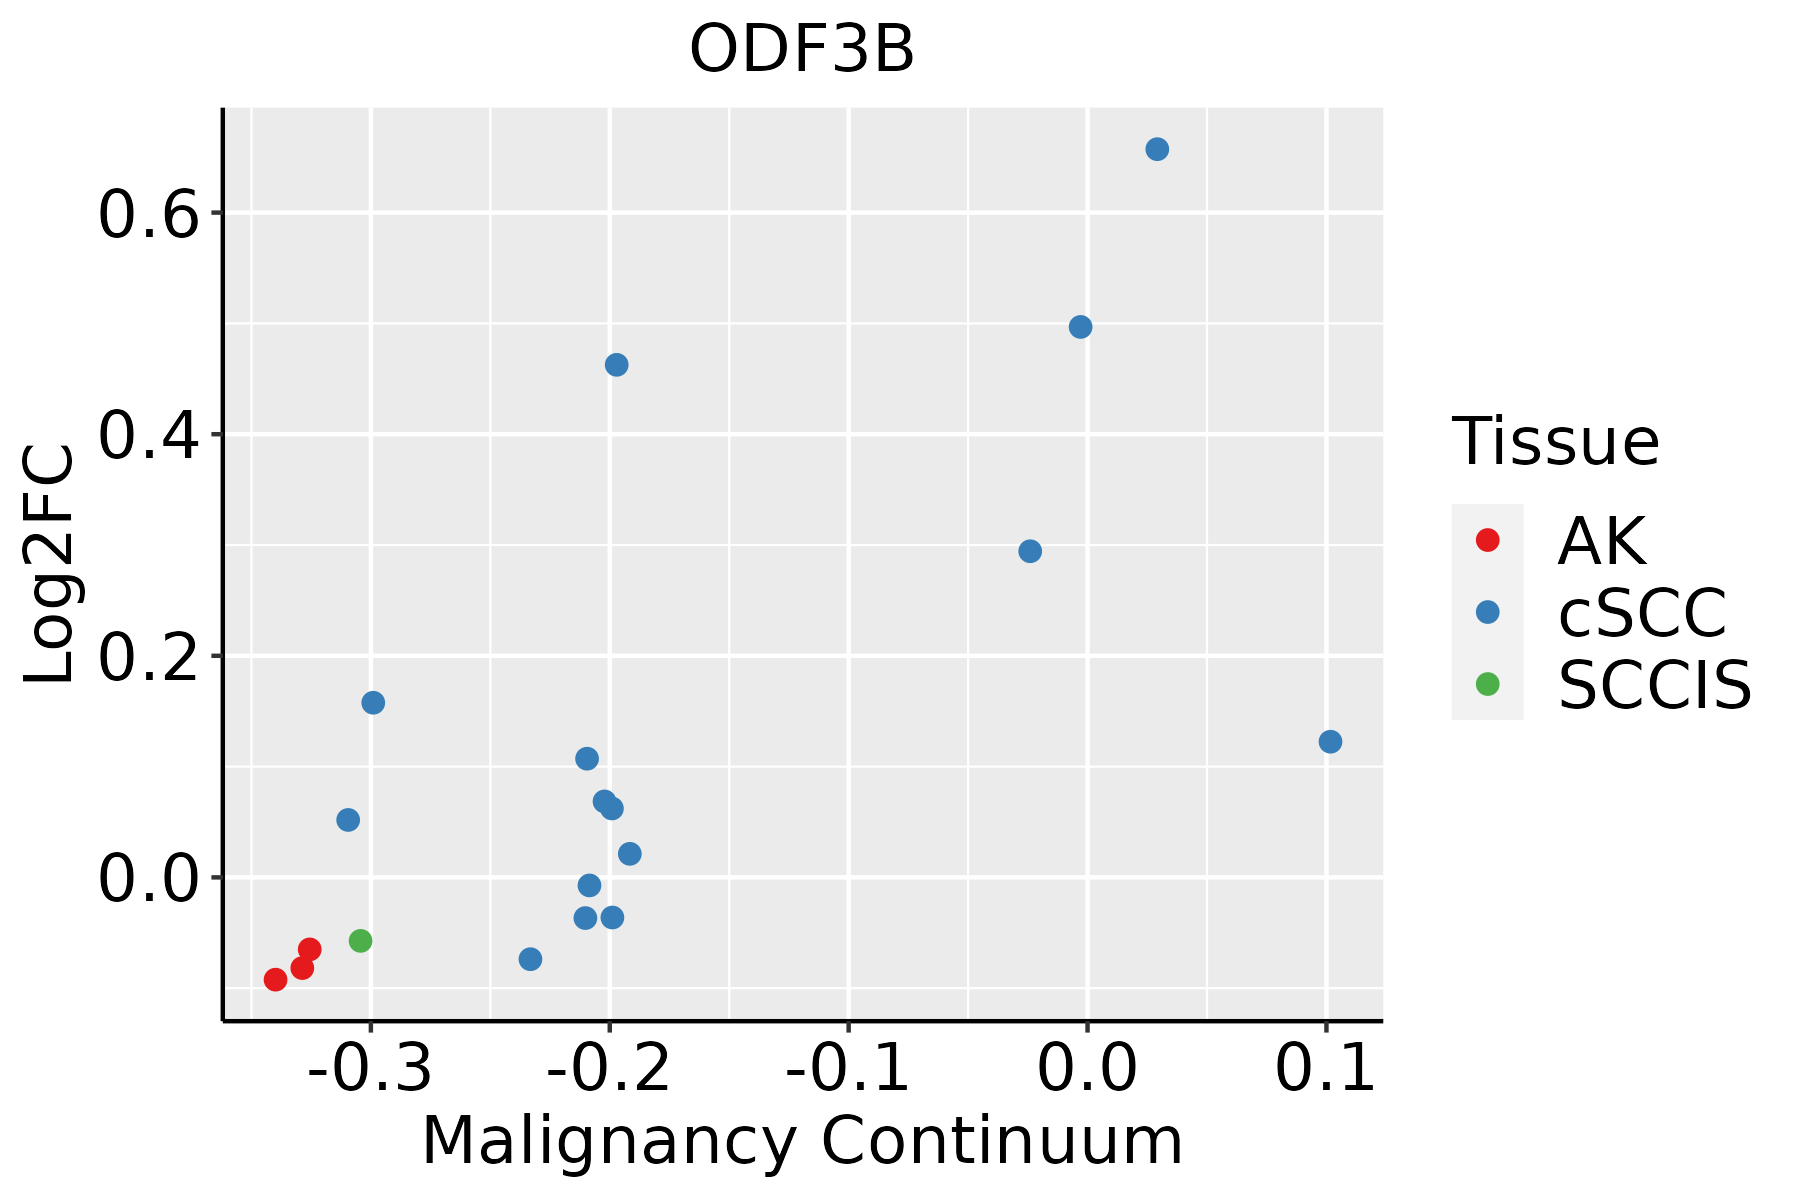 | AK: Actinic keratosis |
| cSCC: Cutaneous squamous cell carcinoma | ||
| SCCIS:squamous cell carcinoma in situ | ||
| Thyroid | 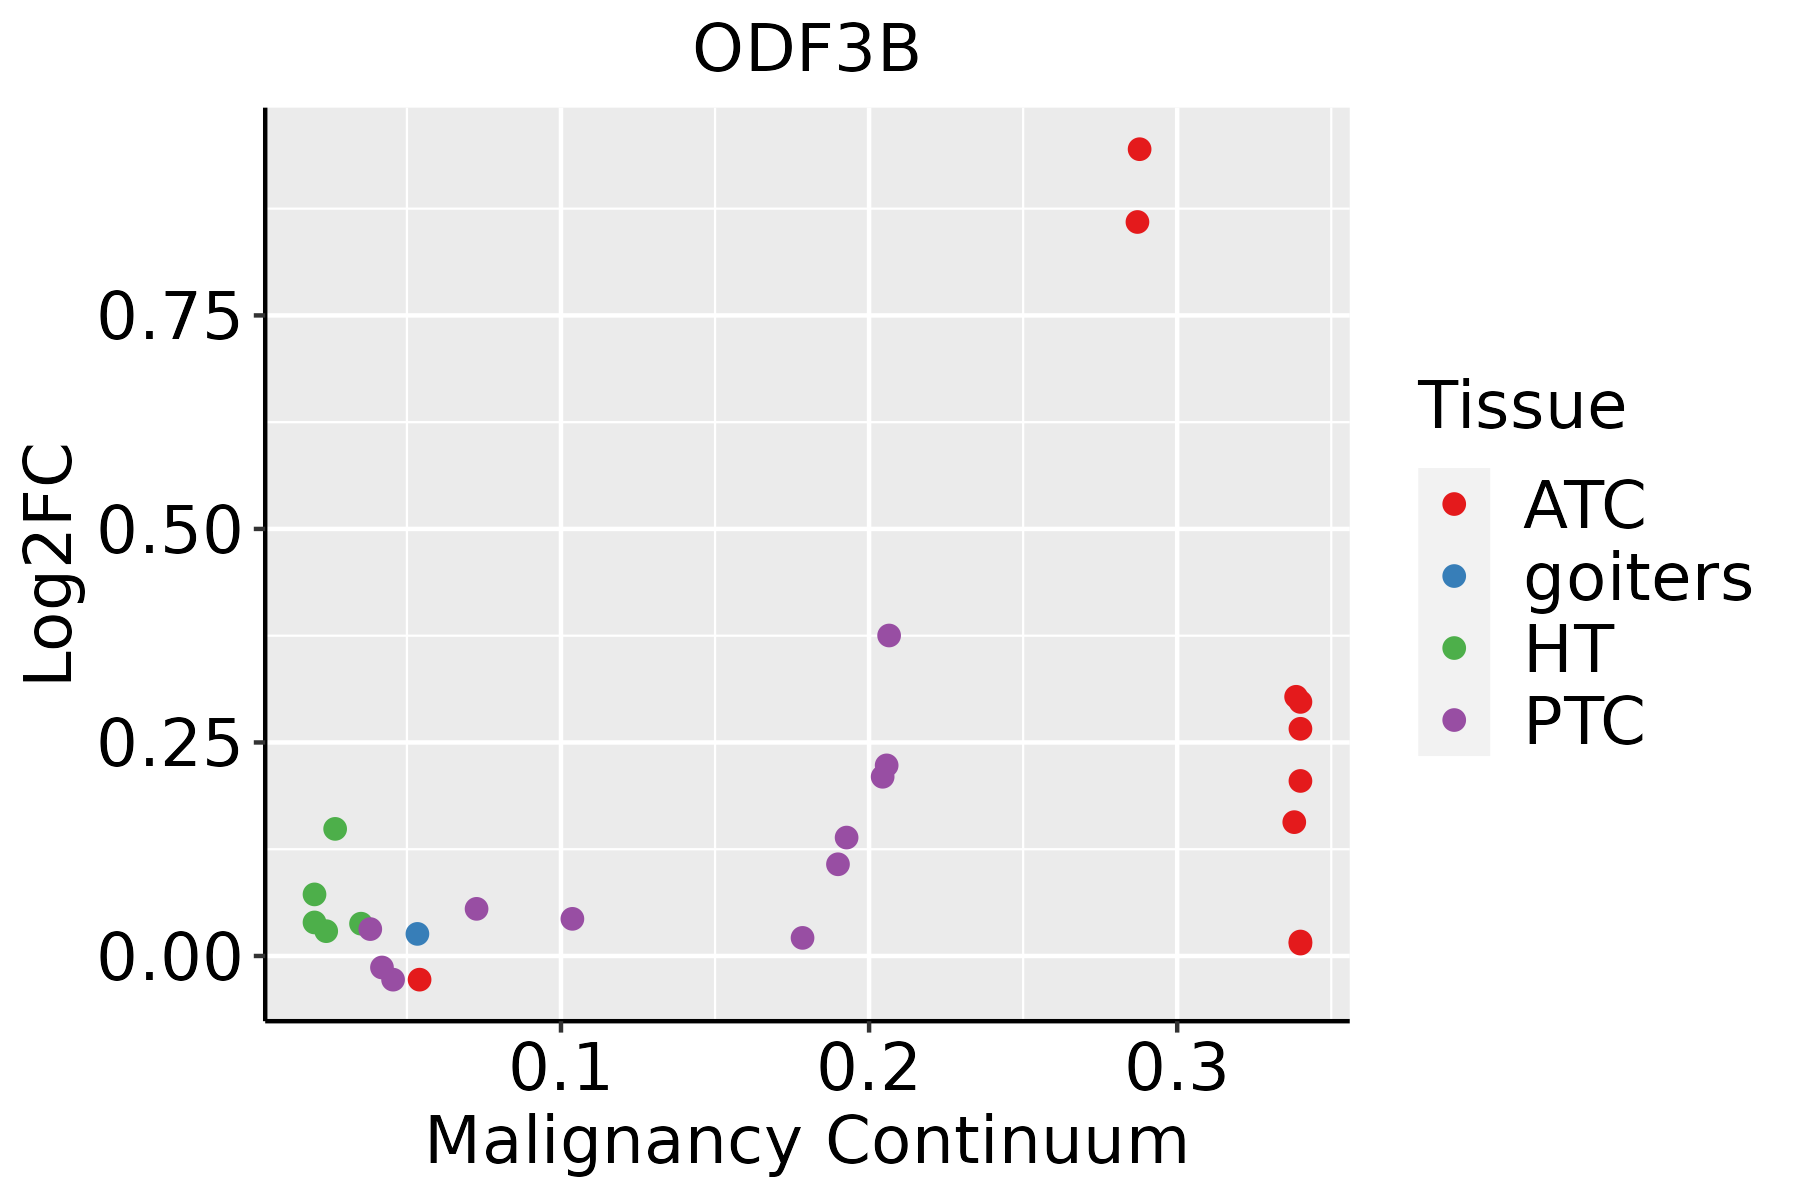 | ATC: Anaplastic thyroid cancer |
| HT: Hashimoto's thyroiditis | ||
| PTC: Papillary thyroid cancer |
| ∗log2FC in expression of this searched gene in stem-like cells from each diseased tissue sample relative to stem-like cells in normal samples in each tissue plotted against the malignancy continuum. Samples are colored based on if they are from different disease stage. |
Top |
Malignant transformation related pathway analysis |
| Find out the enriched GO biological processes and KEGG pathways involved in transition from healthy to precancer to cancer |
| Tissue | Disease Stage | Enriched GO biological Processes |
| Colorectum | AD |  |
| Colorectum | SER |  |
| Colorectum | MSS |  |
| Colorectum | MSI-H |  |
| Colorectum | FAP |  |
| ∗Top 15 enriched GO BP terms are showed in the bar plot of each disease state in each tissue. Each row represents a significant GO biological process which is colored according to the -log10(p.adjust). |
| Page: 1 2 3 4 5 6 7 8 9 |
| GO ID | Tissue | Disease Stage | Description | Gene Ratio | Bg Ratio | pvalue | p.adjust | Count |
| Page: 1 |
| Pathway ID | Tissue | Disease Stage | Description | Gene Ratio | Bg Ratio | pvalue | p.adjust | qvalue | Count |
| Page: 1 |
Top |
Cell-cell communication analysis |
| Identification of potential cell-cell interactions between two cell types and their ligand-receptor pairs for different disease states |
| Ligand | Receptor | LRpair | Pathway | Tissue | Disease Stage |
| Page: 1 |
Top |
Single-cell gene regulatory network inference analysis |
| Find out the significant the regulons (TFs) and the target genes of each regulon across cell types for different disease states |
| TF | Cell Type | Tissue | Disease Stage | Target Gene | RSS | Regulon Activity |
| ∗The dot plots of a searched regulon are shown for all cell subpopulations in each disease state of each tissue based on the regulon specific score inferred using pySCENIC and by calculating the average expression. |
| Page: 1 |
Top |
Somatic mutation of malignant transformation related genes |
| Annotation of somatic variants for genes involved in malignant transformation |
| Hugo Symbol | Variant Class | Variant Classification | dbSNP RS | HGVSc | HGVSp | HGVSp Short | SWISSPROT | BIOTYPE | SIFT | PolyPhen | Tumor Sample Barcode | Tissue | Histology | Sex | Age | Stage | Therapy Types | Drugs | Outcome |
| ODF3B | SNV | Missense_Mutation | rs754401271 | c.554G>A | p.Cys185Tyr | p.C185Y | A8MYP8 | protein_coding | deleterious(0.01) | possibly_damaging(0.694) | TCGA-AA-3984-01 | Colorectum | colon adenocarcinoma | Female | <65 | I/II | Unknown | Unknown | SD |
| ODF3B | SNV | Missense_Mutation | c.752N>A | p.Ala251Glu | p.A251E | A8MYP8 | protein_coding | tolerated(0.09) | benign(0.03) | TCGA-CM-5860-01 | Colorectum | colon adenocarcinoma | Male | <65 | I/II | Ancillary | leucovorin | SD | |
| ODF3B | SNV | Missense_Mutation | c.598N>T | p.Pro200Ser | p.P200S | A8MYP8 | protein_coding | deleterious(0) | probably_damaging(0.979) | TCGA-56-6545-01 | Lung | lung squamous cell carcinoma | Female | >=65 | I/II | Unknown | Unknown | SD | |
| ODF3B | SNV | Missense_Mutation | novel | c.364N>T | p.Arg122Trp | p.R122W | A8MYP8 | protein_coding | deleterious(0.02) | benign(0.003) | TCGA-P3-A5Q5-01 | Oral cavity | head & neck squamous cell carcinoma | Male | <65 | I/II | Unknown | Unknown | SD |
| ODF3B | SNV | Missense_Mutation | novel | c.349T>C | p.Tyr117His | p.Y117H | A8MYP8 | protein_coding | tolerated(0.08) | possibly_damaging(0.898) | TCGA-HF-A5NB-01 | Stomach | stomach adenocarcinoma | Female | >=65 | III/IV | Chemotherapy | fluorouracil | SD |
| Page: 1 |
Top |
Related drugs of malignant transformation related genes |
| Identification of chemicals and drugs interact with genes involved in malignant transfromation |
| (DGIdb 4.0) |
| Entrez ID | Symbol | Category | Interaction Types | Drug Claim Name | Drug Name | PMIDs |
| Page: 1 |

Copyright 2023-Present -The University of Texas Health Science Center at Houston |