
|
|||||
|
 | |
| |
| |
| |
| |
| |
|
Gene: OCEL1 |
Gene summary for OCEL1 |
| Gene information | Species | Human | Gene symbol | OCEL1 | Gene ID | 79629 |
| Gene name | occludin/ELL domain containing 1 | |
| Gene Alias | FWP009 | |
| Cytomap | 19p13.11 | |
| Gene Type | protein-coding | GO ID | NA | UniProtAcc | Q9H607 |
Top |
Malignant transformation analysis |
| Identification of the aberrant gene expression in precancerous and cancerous lesions by comparing the gene expression of stem-like cells in diseased tissues with normal stem cells |
| Entrez ID | Symbol | Replicates | Species | Organ | Tissue | Adj P-value | Log2FC | Malignancy |
| 79629 | OCEL1 | S027 | Human | Liver | HCC | 8.49e-03 | 4.18e-01 | 0.2446 |
| 79629 | OCEL1 | S028 | Human | Liver | HCC | 8.28e-10 | 3.80e-01 | 0.2503 |
| 79629 | OCEL1 | S029 | Human | Liver | HCC | 2.58e-12 | 5.50e-01 | 0.2581 |
| 79629 | OCEL1 | C04 | Human | Oral cavity | OSCC | 5.63e-08 | 5.51e-01 | 0.2633 |
| 79629 | OCEL1 | C21 | Human | Oral cavity | OSCC | 1.38e-04 | 3.13e-01 | 0.2678 |
| 79629 | OCEL1 | C30 | Human | Oral cavity | OSCC | 1.90e-10 | 6.61e-01 | 0.3055 |
| 79629 | OCEL1 | C43 | Human | Oral cavity | OSCC | 8.33e-11 | 1.42e-01 | 0.1704 |
| 79629 | OCEL1 | C46 | Human | Oral cavity | OSCC | 5.39e-06 | 1.89e-01 | 0.1673 |
| 79629 | OCEL1 | C57 | Human | Oral cavity | OSCC | 4.33e-05 | 2.68e-01 | 0.1679 |
| 79629 | OCEL1 | C07 | Human | Oral cavity | OSCC | 3.91e-02 | 6.00e-01 | 0.2491 |
| 79629 | OCEL1 | C08 | Human | Oral cavity | OSCC | 5.24e-15 | 2.94e-01 | 0.1919 |
| 79629 | OCEL1 | C09 | Human | Oral cavity | OSCC | 1.01e-02 | 1.60e-01 | 0.1431 |
| 79629 | OCEL1 | SYSMH1 | Human | Oral cavity | OSCC | 2.03e-06 | 1.94e-01 | 0.1127 |
| 79629 | OCEL1 | SYSMH2 | Human | Oral cavity | OSCC | 6.69e-10 | 2.44e-01 | 0.2326 |
| 79629 | OCEL1 | SYSMH3 | Human | Oral cavity | OSCC | 6.54e-17 | 3.94e-01 | 0.2442 |
| 79629 | OCEL1 | SYSMH6 | Human | Oral cavity | OSCC | 1.79e-16 | 3.14e-01 | 0.1275 |
| Page: 1 2 3 4 5 |
| Tissue | Expression Dynamics | Abbreviation |
| Colorectum (GSE201348) |  | FAP: Familial adenomatous polyposis |
| CRC: Colorectal cancer | ||
| Colorectum (HTA11) |  | AD: Adenomas |
| SER: Sessile serrated lesions | ||
| MSI-H: Microsatellite-high colorectal cancer | ||
| MSS: Microsatellite stable colorectal cancer | ||
| Esophagus | 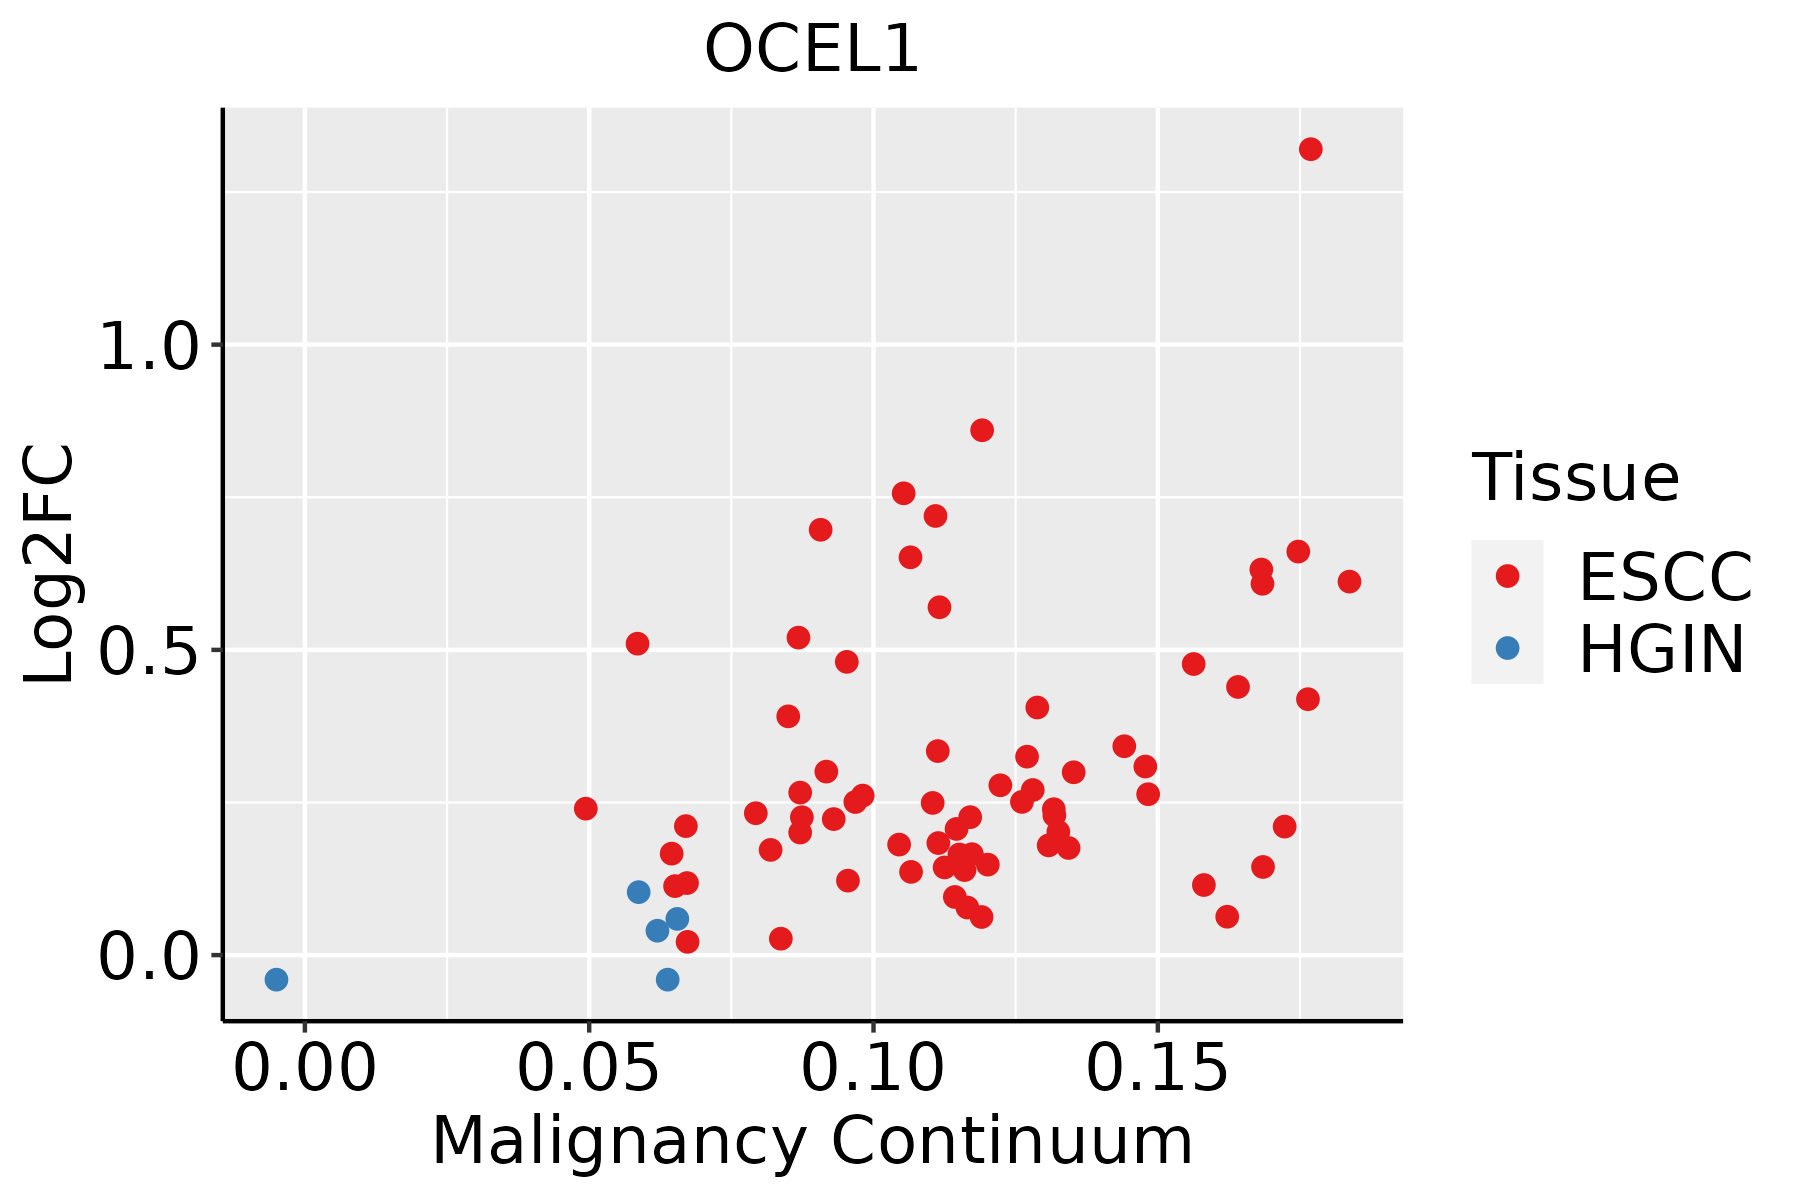 | ESCC: Esophageal squamous cell carcinoma |
| HGIN: High-grade intraepithelial neoplasias | ||
| LGIN: Low-grade intraepithelial neoplasias | ||
| Liver | 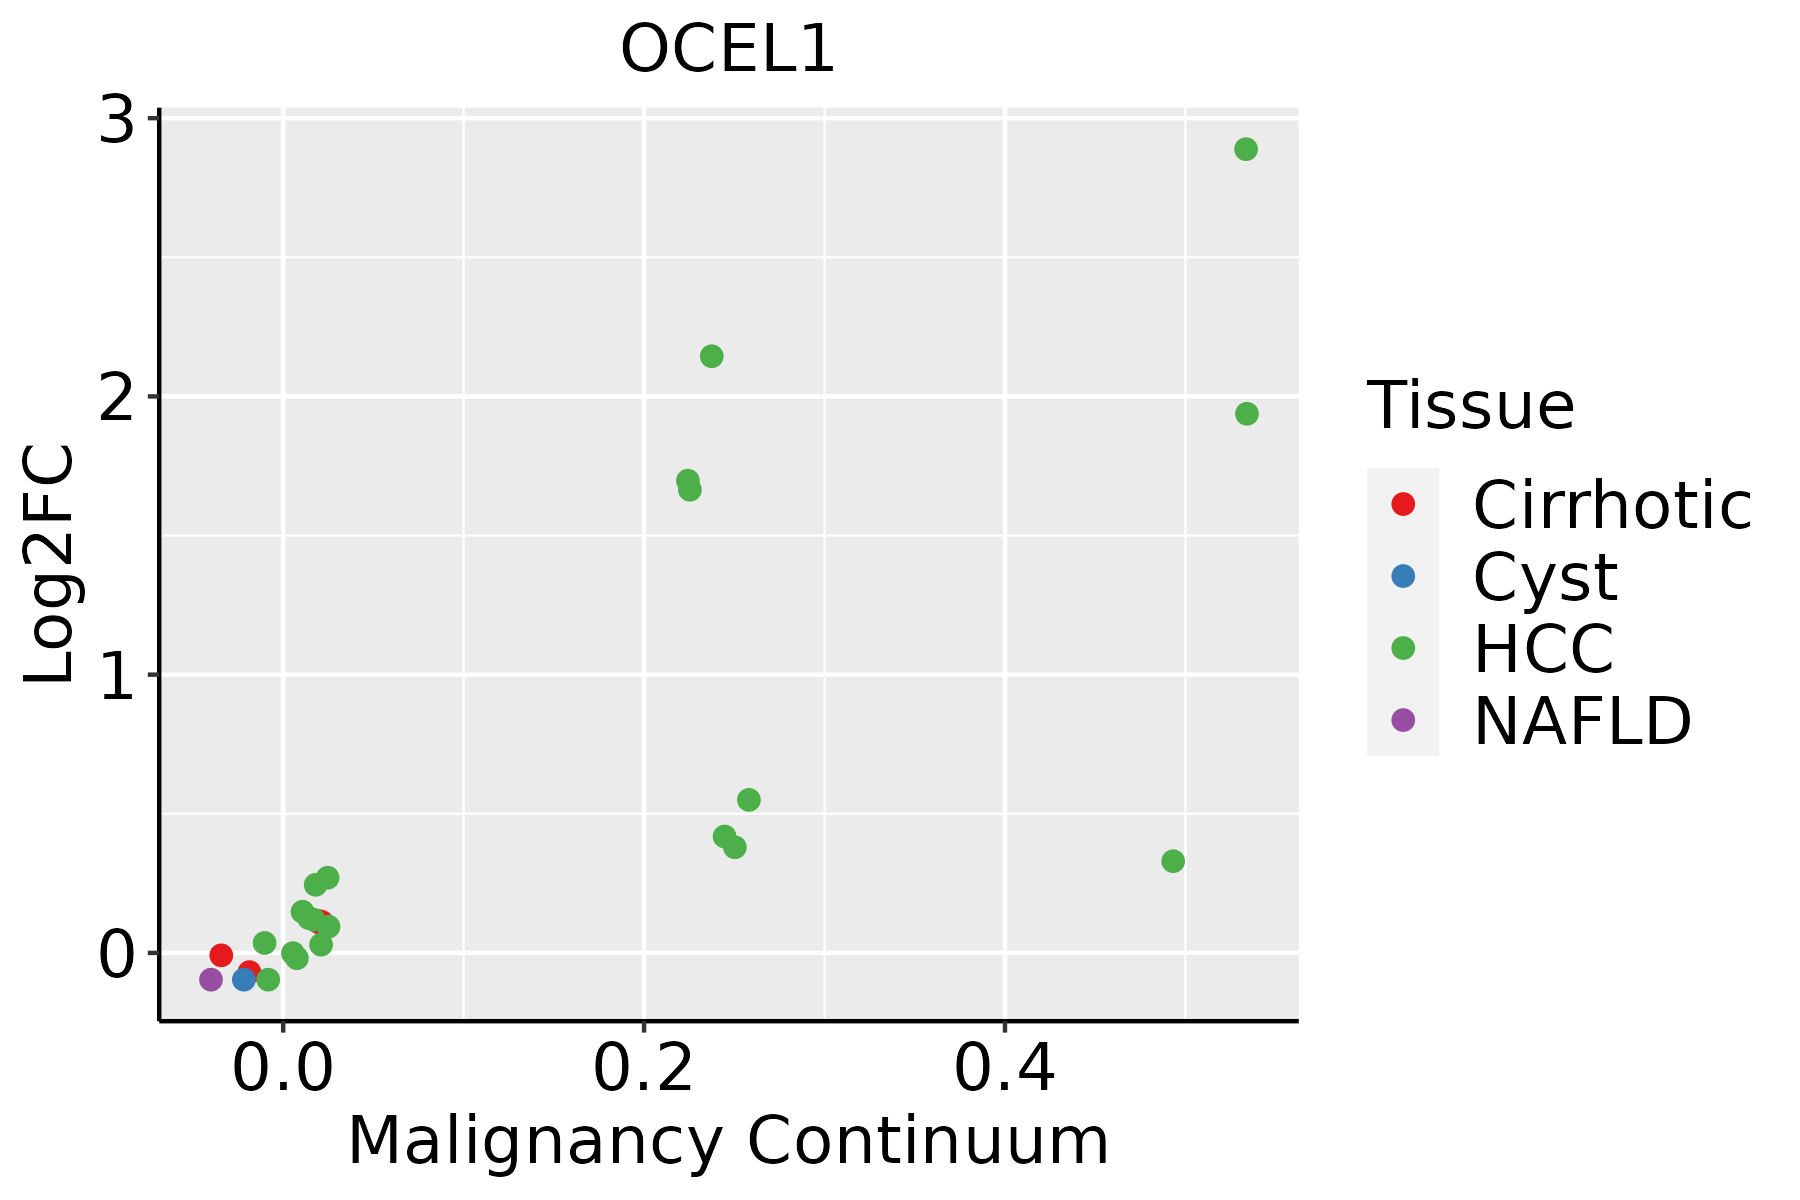 | HCC: Hepatocellular carcinoma |
| NAFLD: Non-alcoholic fatty liver disease | ||
| Oral Cavity | 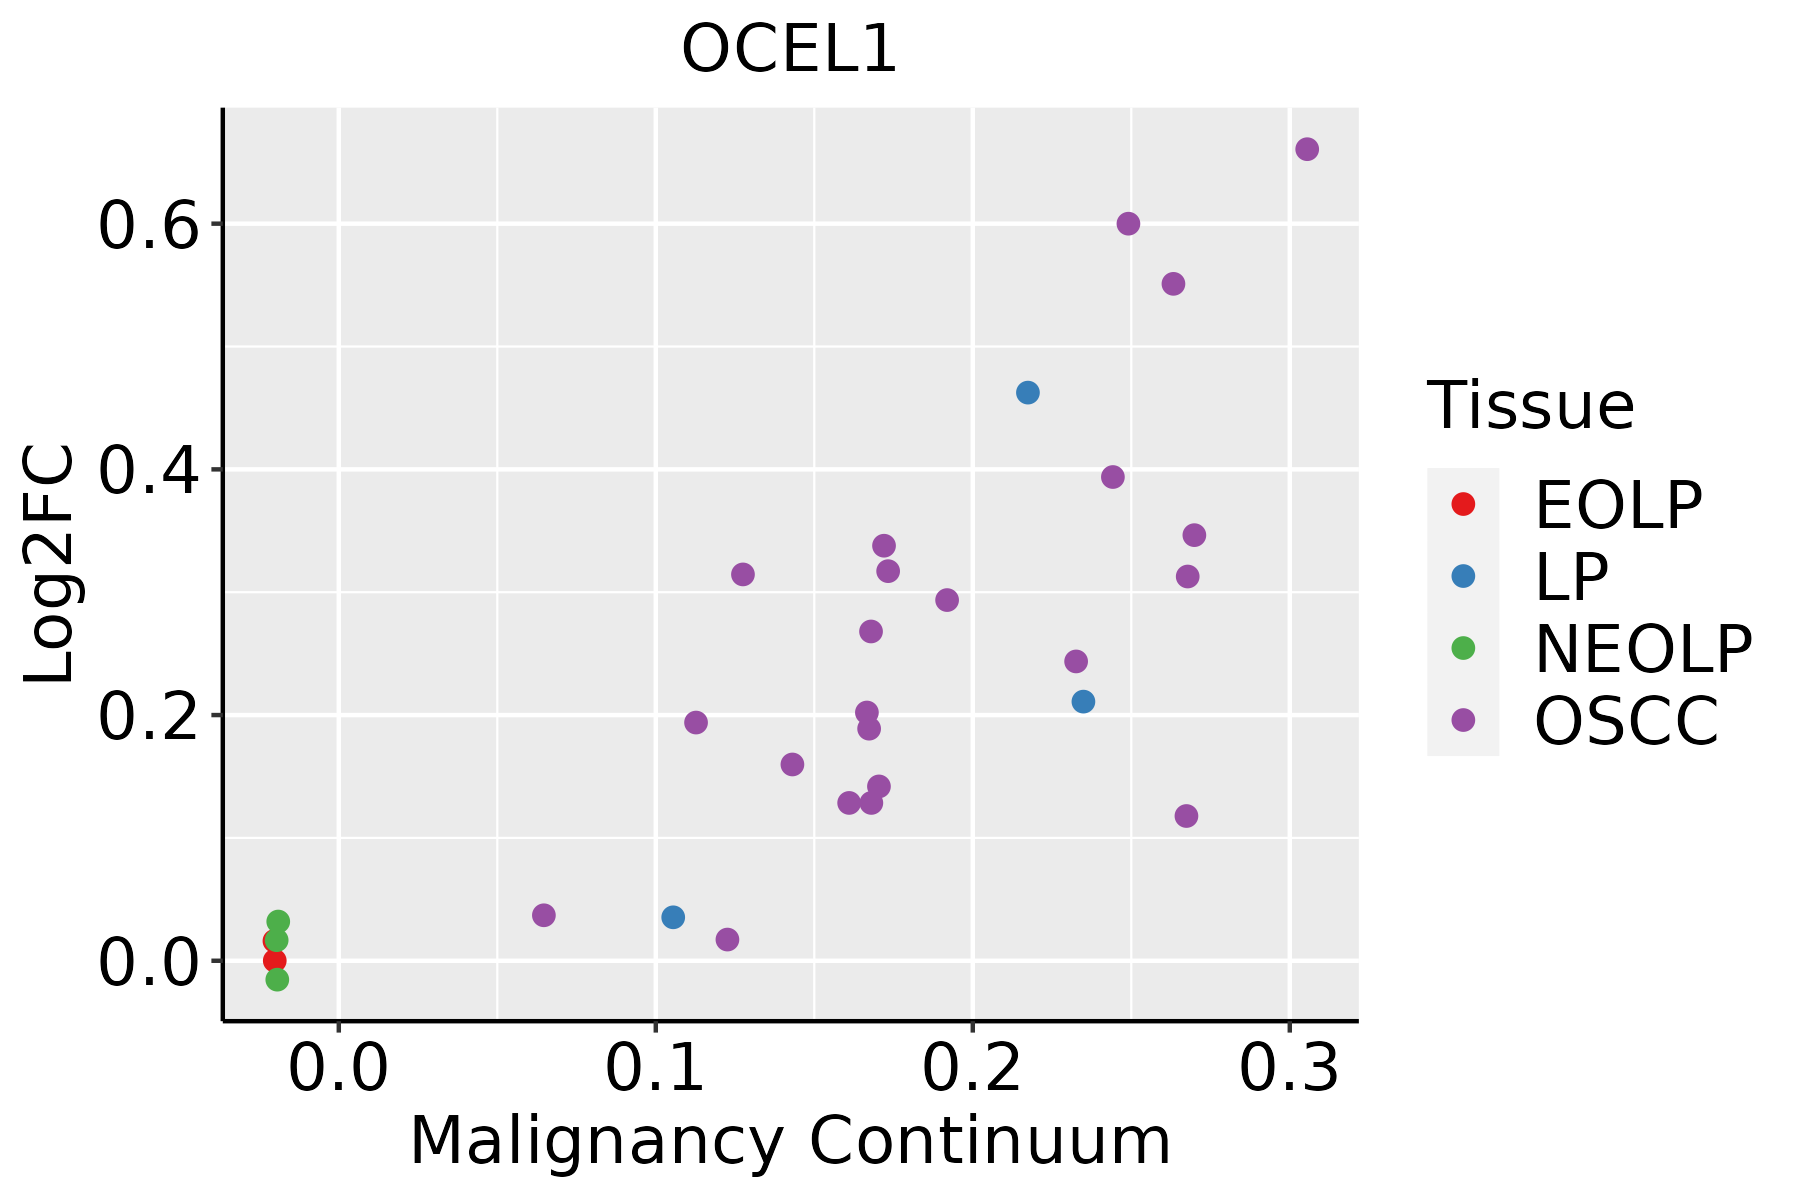 | EOLP: Erosive Oral lichen planus |
| LP: leukoplakia | ||
| NEOLP: Non-erosive oral lichen planus | ||
| OSCC: Oral squamous cell carcinoma |
| ∗log2FC in expression of this searched gene in stem-like cells from each diseased tissue sample relative to stem-like cells in normal samples in each tissue plotted against the malignancy continuum. Samples are colored based on if they are from different disease stage. |
Top |
Malignant transformation related pathway analysis |
| Find out the enriched GO biological processes and KEGG pathways involved in transition from healthy to precancer to cancer |
| Tissue | Disease Stage | Enriched GO biological Processes |
| Colorectum | AD |  |
| Colorectum | SER |  |
| Colorectum | MSS |  |
| Colorectum | MSI-H |  |
| Colorectum | FAP |  |
| ∗Top 15 enriched GO BP terms are showed in the bar plot of each disease state in each tissue. Each row represents a significant GO biological process which is colored according to the -log10(p.adjust). |
| Page: 1 2 3 4 5 6 7 8 9 |
| GO ID | Tissue | Disease Stage | Description | Gene Ratio | Bg Ratio | pvalue | p.adjust | Count |
| Page: 1 |
| Pathway ID | Tissue | Disease Stage | Description | Gene Ratio | Bg Ratio | pvalue | p.adjust | qvalue | Count |
| Page: 1 |
Top |
Cell-cell communication analysis |
| Identification of potential cell-cell interactions between two cell types and their ligand-receptor pairs for different disease states |
| Ligand | Receptor | LRpair | Pathway | Tissue | Disease Stage |
| Page: 1 |
Top |
Single-cell gene regulatory network inference analysis |
| Find out the significant the regulons (TFs) and the target genes of each regulon across cell types for different disease states |
| TF | Cell Type | Tissue | Disease Stage | Target Gene | RSS | Regulon Activity |
| ∗The dot plots of a searched regulon are shown for all cell subpopulations in each disease state of each tissue based on the regulon specific score inferred using pySCENIC and by calculating the average expression. |
| Page: 1 |
Top |
Somatic mutation of malignant transformation related genes |
| Annotation of somatic variants for genes involved in malignant transformation |
| Hugo Symbol | Variant Class | Variant Classification | dbSNP RS | HGVSc | HGVSp | HGVSp Short | SWISSPROT | BIOTYPE | SIFT | PolyPhen | Tumor Sample Barcode | Tissue | Histology | Sex | Age | Stage | Therapy Types | Drugs | Outcome |
| OCEL1 | SNV | Missense_Mutation | rs201983831 | c.29N>T | p.Pro10Leu | p.P10L | Q9H607 | protein_coding | tolerated_low_confidence(0.44) | benign(0) | TCGA-A2-A0YK-01 | Breast | breast invasive carcinoma | Female | <65 | I/II | Chemotherapy | cytoxan | SD |
| OCEL1 | insertion | In_Frame_Ins | novel | c.654_655insCAC | p.Glu218_Phe219insHis | p.E218_F219insH | Q9H607 | protein_coding | TCGA-A7-A0CE-01 | Breast | breast invasive carcinoma | Female | <65 | I/II | Chemotherapy | adriamycin | SD | ||
| OCEL1 | deletion | Frame_Shift_Del | novel | c.358delN | p.Leu120CysfsTer37 | p.L120Cfs*37 | Q9H607 | protein_coding | TCGA-D8-A27V-01 | Breast | breast invasive carcinoma | Female | <65 | I/II | Hormone Therapy | tamoxiphen | SD | ||
| OCEL1 | SNV | Missense_Mutation | novel | c.387G>T | p.Lys129Asn | p.K129N | Q9H607 | protein_coding | deleterious(0.03) | benign(0.154) | TCGA-AA-A010-01 | Colorectum | colon adenocarcinoma | Female | <65 | I/II | Chemotherapy | folinic | CR |
| OCEL1 | SNV | Missense_Mutation | c.756C>A | p.Phe252Leu | p.F252L | Q9H607 | protein_coding | deleterious(0) | possibly_damaging(0.892) | TCGA-CA-6717-01 | Colorectum | colon adenocarcinoma | Male | <65 | I/II | Chemotherapy | oxaliplatin | CR | |
| OCEL1 | SNV | Missense_Mutation | c.451N>T | p.Leu151Phe | p.L151F | Q9H607 | protein_coding | deleterious(0.01) | probably_damaging(0.996) | TCGA-EI-6882-01 | Colorectum | rectum adenocarcinoma | Male | <65 | I/II | Unknown | Unknown | SD | |
| OCEL1 | insertion | Frame_Shift_Ins | novel | c.572_573insCA | p.Arg191SerfsTer8 | p.R191Sfs*8 | Q9H607 | protein_coding | TCGA-AM-5820-01 | Colorectum | colon adenocarcinoma | Female | <65 | I/II | Unknown | Unknown | SD | ||
| OCEL1 | insertion | In_Frame_Ins | novel | c.573_574insGGCCTC | p.Arg191_Gln192insGlyLeu | p.R191_Q192insGL | Q9H607 | protein_coding | TCGA-AM-5820-01 | Colorectum | colon adenocarcinoma | Female | <65 | I/II | Unknown | Unknown | SD | ||
| OCEL1 | deletion | Frame_Shift_Del | c.284delN | p.Arg97AlafsTer60 | p.R97Afs*60 | Q9H607 | protein_coding | TCGA-CM-5861-01 | Colorectum | colon adenocarcinoma | Female | <65 | I/II | Unknown | Unknown | PD | |||
| OCEL1 | SNV | Missense_Mutation | c.528N>A | p.Phe176Leu | p.F176L | Q9H607 | protein_coding | tolerated(0.28) | benign(0.003) | TCGA-AJ-A5DW-01 | Endometrium | uterine corpus endometrioid carcinoma | Female | <65 | I/II | Unknown | Unknown | SD |
| Page: 1 2 3 |
Top |
Related drugs of malignant transformation related genes |
| Identification of chemicals and drugs interact with genes involved in malignant transfromation |
| (DGIdb 4.0) |
| Entrez ID | Symbol | Category | Interaction Types | Drug Claim Name | Drug Name | PMIDs |
| Page: 1 |

Copyright 2023-Present -The University of Texas Health Science Center at Houston |