
|
|||||
|
 | |
| |
| |
| |
| |
| |
|
Gene: OAZ1 |
Gene summary for OAZ1 |
| Gene information | Species | Human | Gene symbol | OAZ1 | Gene ID | 4946 |
| Gene name | ornithine decarboxylase antizyme 1 | |
| Gene Alias | AZ1 | |
| Cytomap | 19p13.3 | |
| Gene Type | protein-coding | GO ID | GO:0006576 | UniProtAcc | J3QQY4 |
Top |
Malignant transformation analysis |
| Identification of the aberrant gene expression in precancerous and cancerous lesions by comparing the gene expression of stem-like cells in diseased tissues with normal stem cells |
| Entrez ID | Symbol | Replicates | Species | Organ | Tissue | Adj P-value | Log2FC | Malignancy |
| 4946 | OAZ1 | LZE6T | Human | Esophagus | ESCC | 1.86e-27 | 2.30e+00 | 0.0845 |
| 4946 | OAZ1 | P1T-E | Human | Esophagus | ESCC | 8.16e-29 | 2.37e+00 | 0.0875 |
| 4946 | OAZ1 | P2T-E | Human | Esophagus | ESCC | 4.65e-56 | 1.57e+00 | 0.1177 |
| 4946 | OAZ1 | P4T-E | Human | Esophagus | ESCC | 2.34e-65 | 2.49e+00 | 0.1323 |
| 4946 | OAZ1 | P5T-E | Human | Esophagus | ESCC | 2.15e-55 | 1.71e+00 | 0.1327 |
| 4946 | OAZ1 | P8T-E | Human | Esophagus | ESCC | 2.27e-52 | 1.63e+00 | 0.0889 |
| 4946 | OAZ1 | P9T-E | Human | Esophagus | ESCC | 1.03e-46 | 2.57e+00 | 0.1131 |
| 4946 | OAZ1 | P10T-E | Human | Esophagus | ESCC | 1.36e-73 | 2.48e+00 | 0.116 |
| 4946 | OAZ1 | P11T-E | Human | Esophagus | ESCC | 3.38e-29 | 1.68e+00 | 0.1426 |
| 4946 | OAZ1 | P12T-E | Human | Esophagus | ESCC | 9.86e-70 | 2.11e+00 | 0.1122 |
| 4946 | OAZ1 | P15T-E | Human | Esophagus | ESCC | 1.74e-57 | 2.27e+00 | 0.1149 |
| 4946 | OAZ1 | P16T-E | Human | Esophagus | ESCC | 1.19e-53 | 1.70e+00 | 0.1153 |
| 4946 | OAZ1 | P17T-E | Human | Esophagus | ESCC | 1.26e-33 | 2.63e+00 | 0.1278 |
| 4946 | OAZ1 | P19T-E | Human | Esophagus | ESCC | 1.12e-24 | 2.55e+00 | 0.1662 |
| 4946 | OAZ1 | P20T-E | Human | Esophagus | ESCC | 3.29e-69 | 2.56e+00 | 0.1124 |
| 4946 | OAZ1 | P21T-E | Human | Esophagus | ESCC | 4.20e-90 | 2.81e+00 | 0.1617 |
| 4946 | OAZ1 | P22T-E | Human | Esophagus | ESCC | 3.89e-84 | 2.08e+00 | 0.1236 |
| 4946 | OAZ1 | P23T-E | Human | Esophagus | ESCC | 4.10e-68 | 2.92e+00 | 0.108 |
| 4946 | OAZ1 | P24T-E | Human | Esophagus | ESCC | 9.32e-70 | 2.44e+00 | 0.1287 |
| 4946 | OAZ1 | P26T-E | Human | Esophagus | ESCC | 3.54e-90 | 2.86e+00 | 0.1276 |
| Page: 1 2 3 4 5 6 7 8 9 10 11 12 13 14 15 |
| Tissue | Expression Dynamics | Abbreviation |
| Cervix |  | CC: Cervix cancer |
| HSIL_HPV: HPV-infected high-grade squamous intraepithelial lesions | ||
| N_HPV: HPV-infected normal cervix | ||
| Colorectum (GSE201348) |  | FAP: Familial adenomatous polyposis |
| CRC: Colorectal cancer | ||
| Colorectum (HTA11) |  | AD: Adenomas |
| SER: Sessile serrated lesions | ||
| MSI-H: Microsatellite-high colorectal cancer | ||
| MSS: Microsatellite stable colorectal cancer | ||
| Endometrium |  | AEH: Atypical endometrial hyperplasia |
| EEC: Endometrioid Cancer | ||
| Esophagus | 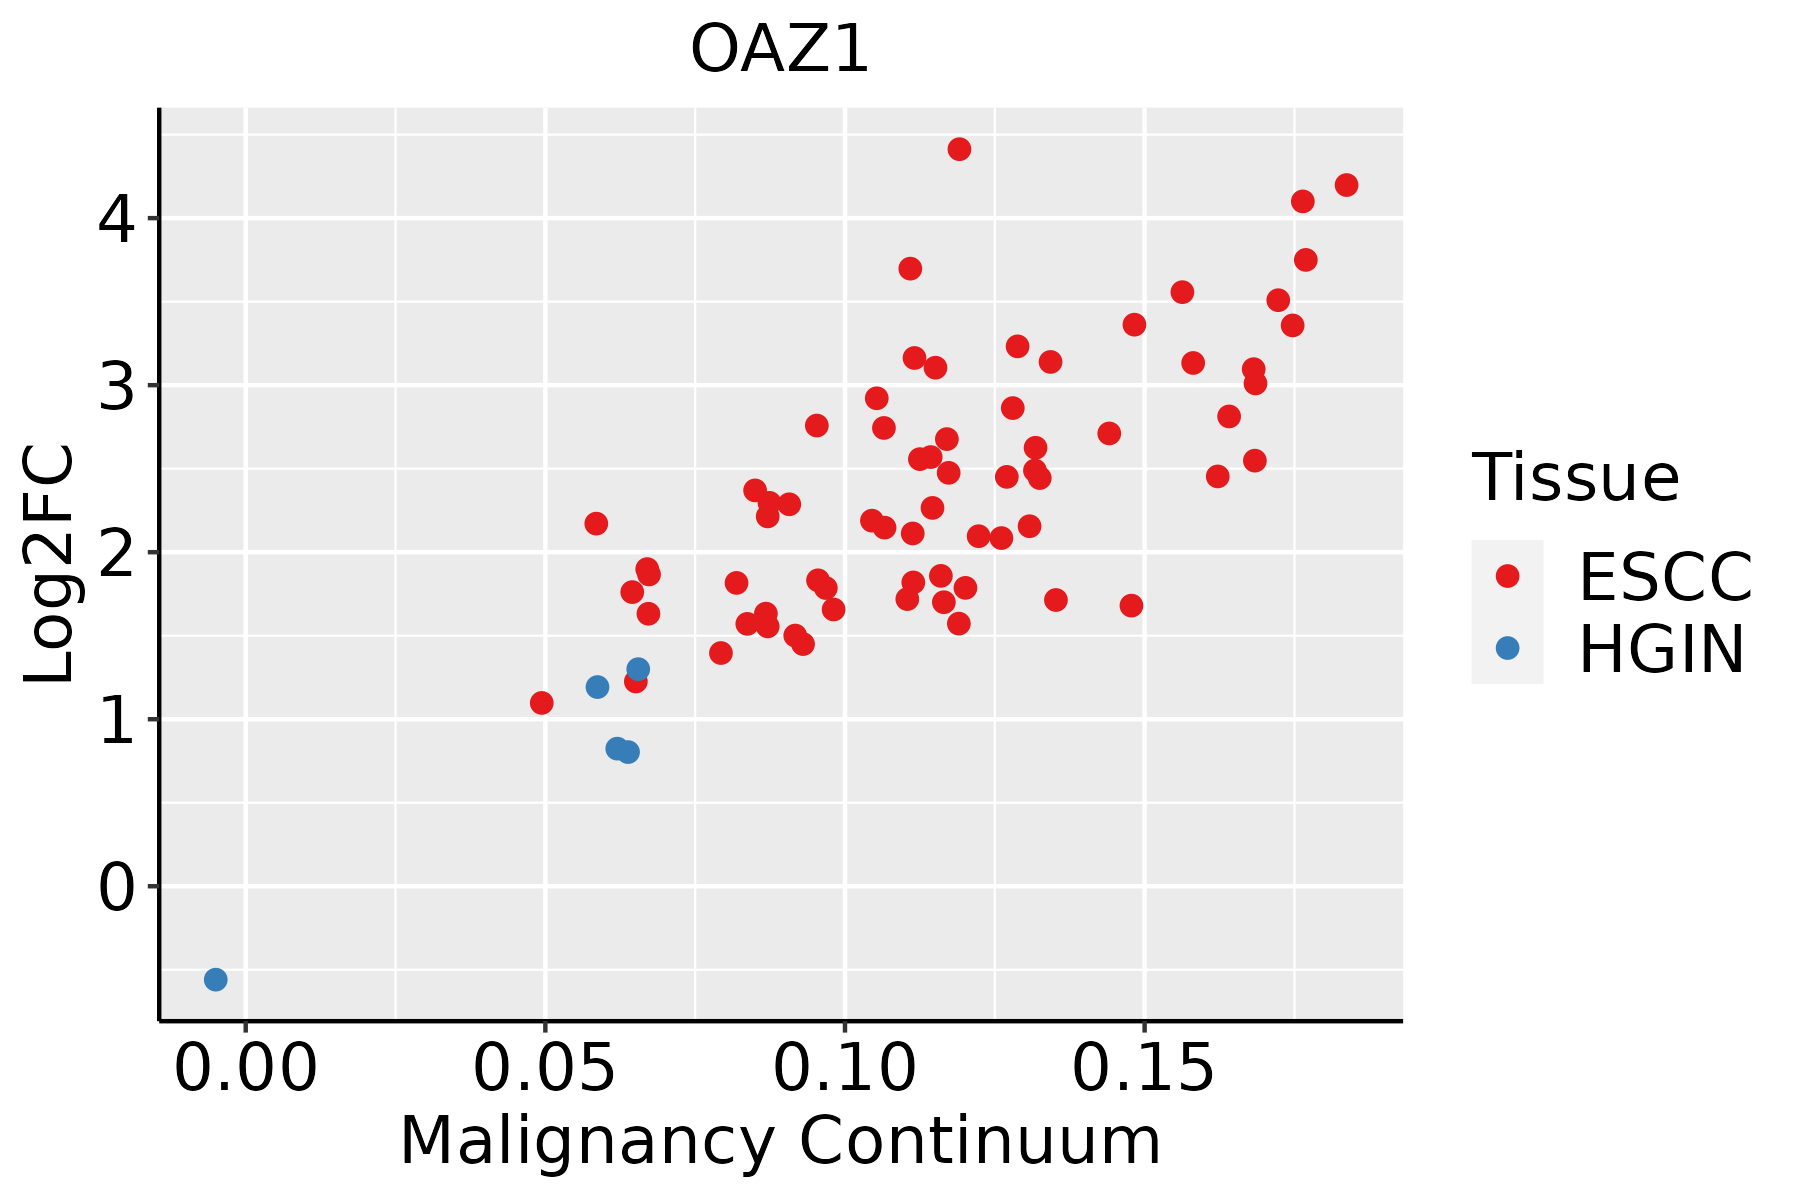 | ESCC: Esophageal squamous cell carcinoma |
| HGIN: High-grade intraepithelial neoplasias | ||
| LGIN: Low-grade intraepithelial neoplasias | ||
| Liver | 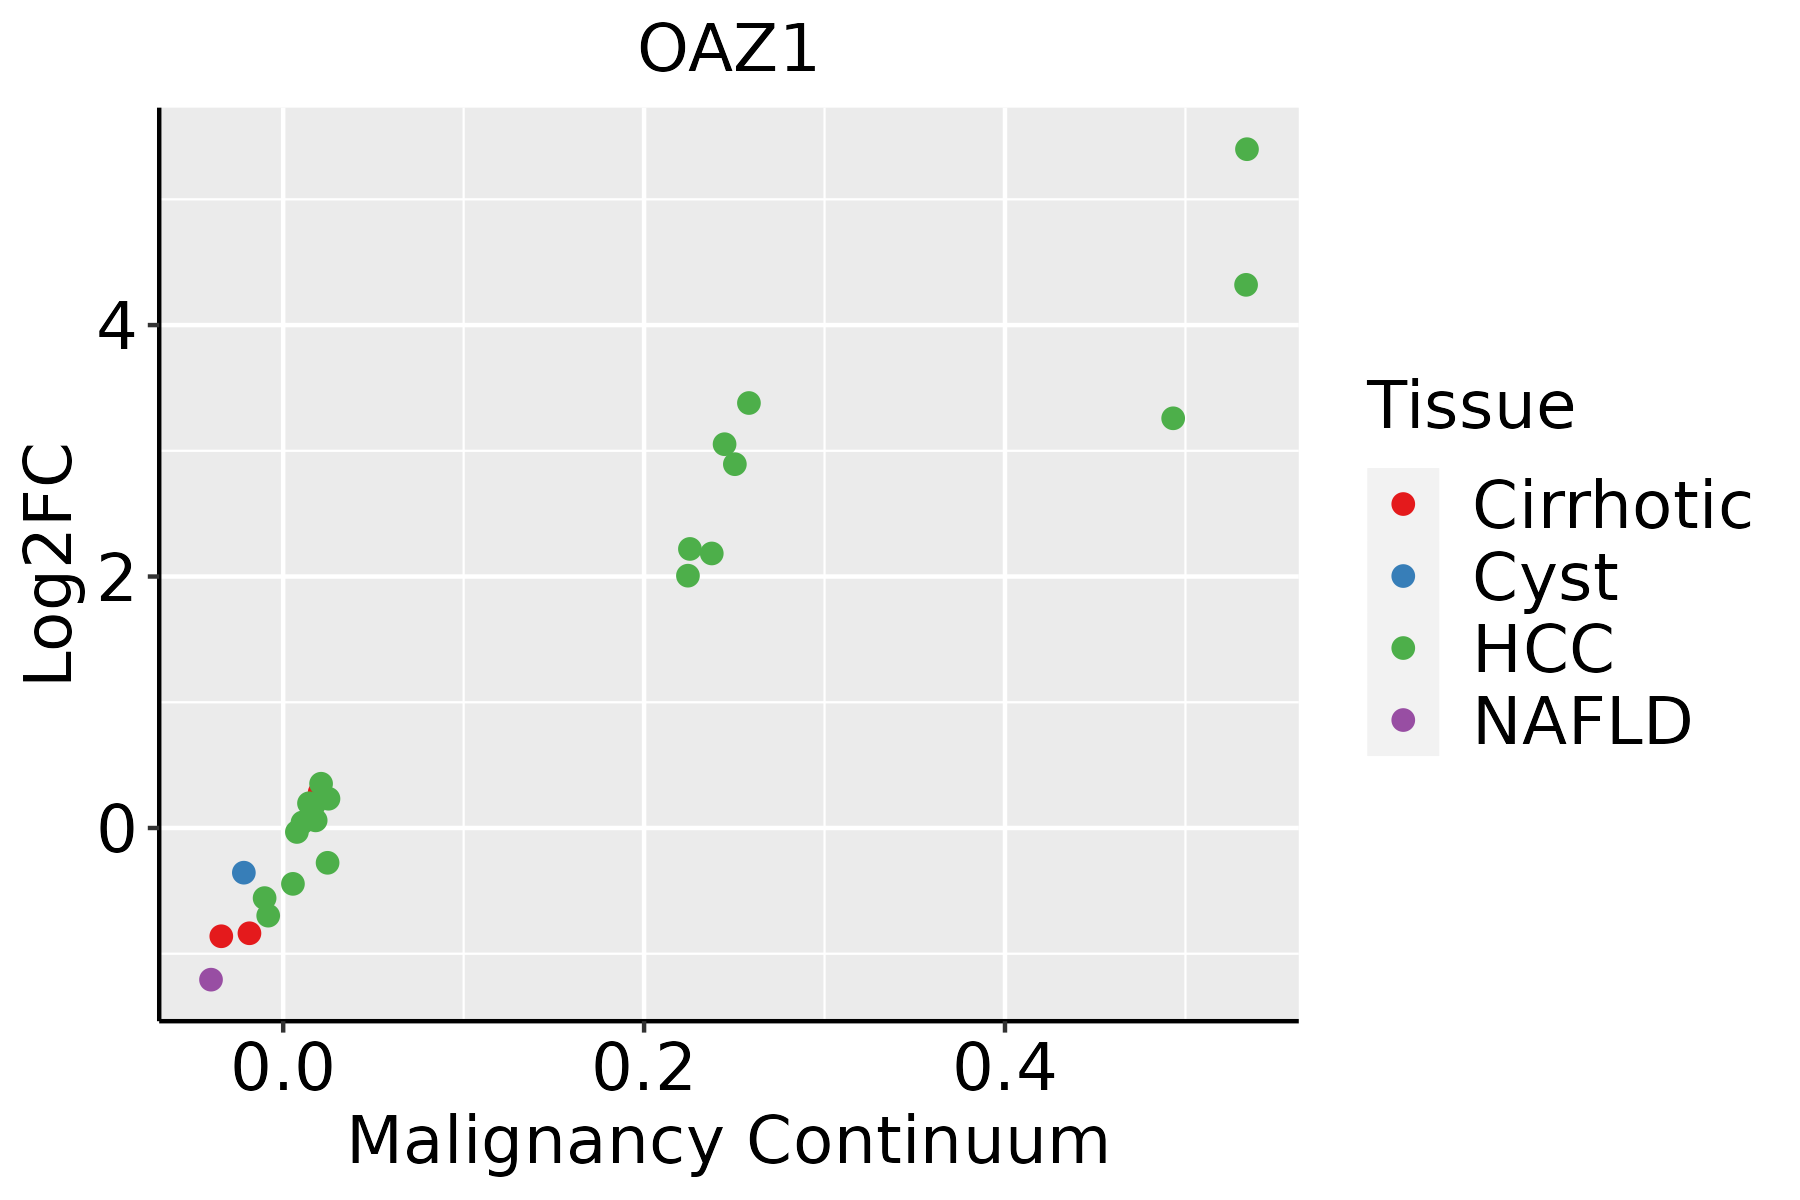 | HCC: Hepatocellular carcinoma |
| NAFLD: Non-alcoholic fatty liver disease | ||
| Lung | 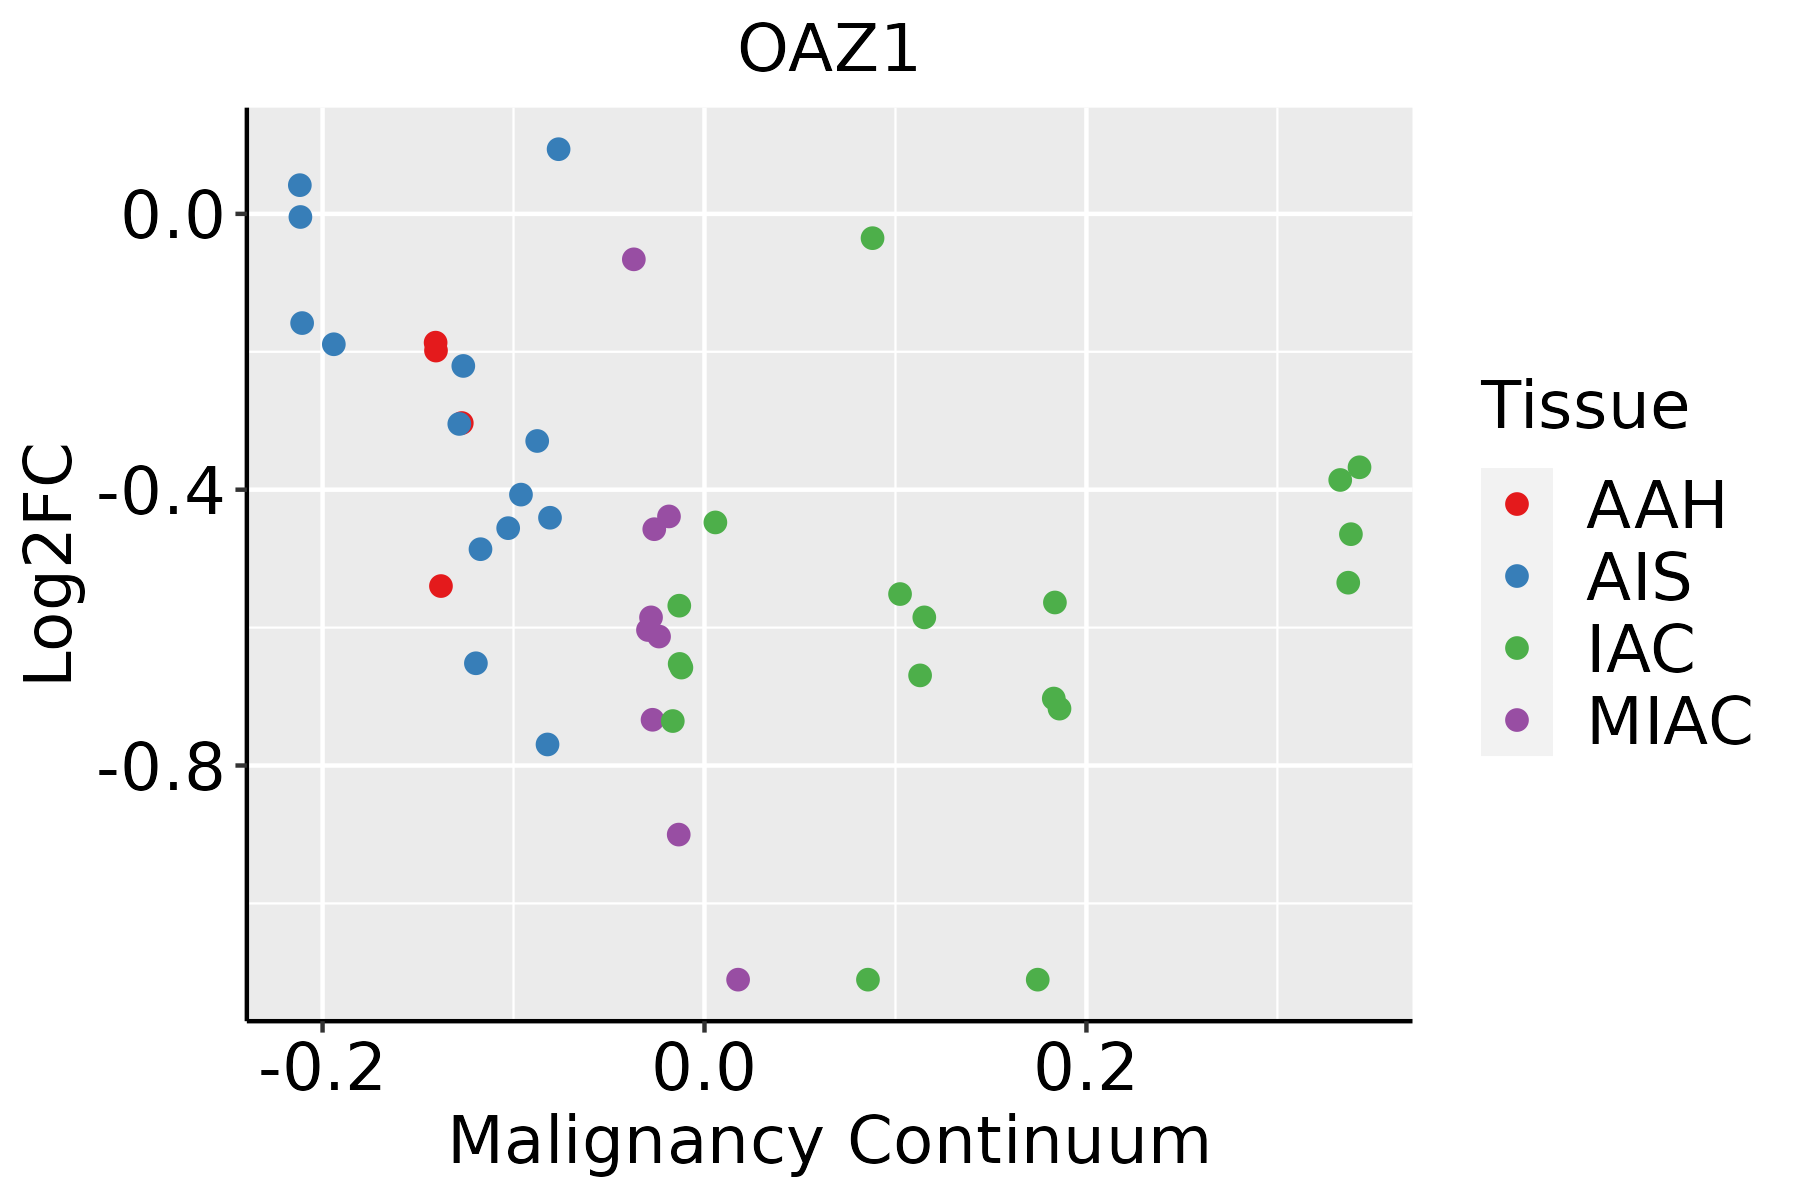 | AAH: Atypical adenomatous hyperplasia |
| AIS: Adenocarcinoma in situ | ||
| IAC: Invasive lung adenocarcinoma | ||
| MIA: Minimally invasive adenocarcinoma | ||
| Oral Cavity |  | EOLP: Erosive Oral lichen planus |
| LP: leukoplakia | ||
| NEOLP: Non-erosive oral lichen planus | ||
| OSCC: Oral squamous cell carcinoma | ||
| Prostate | 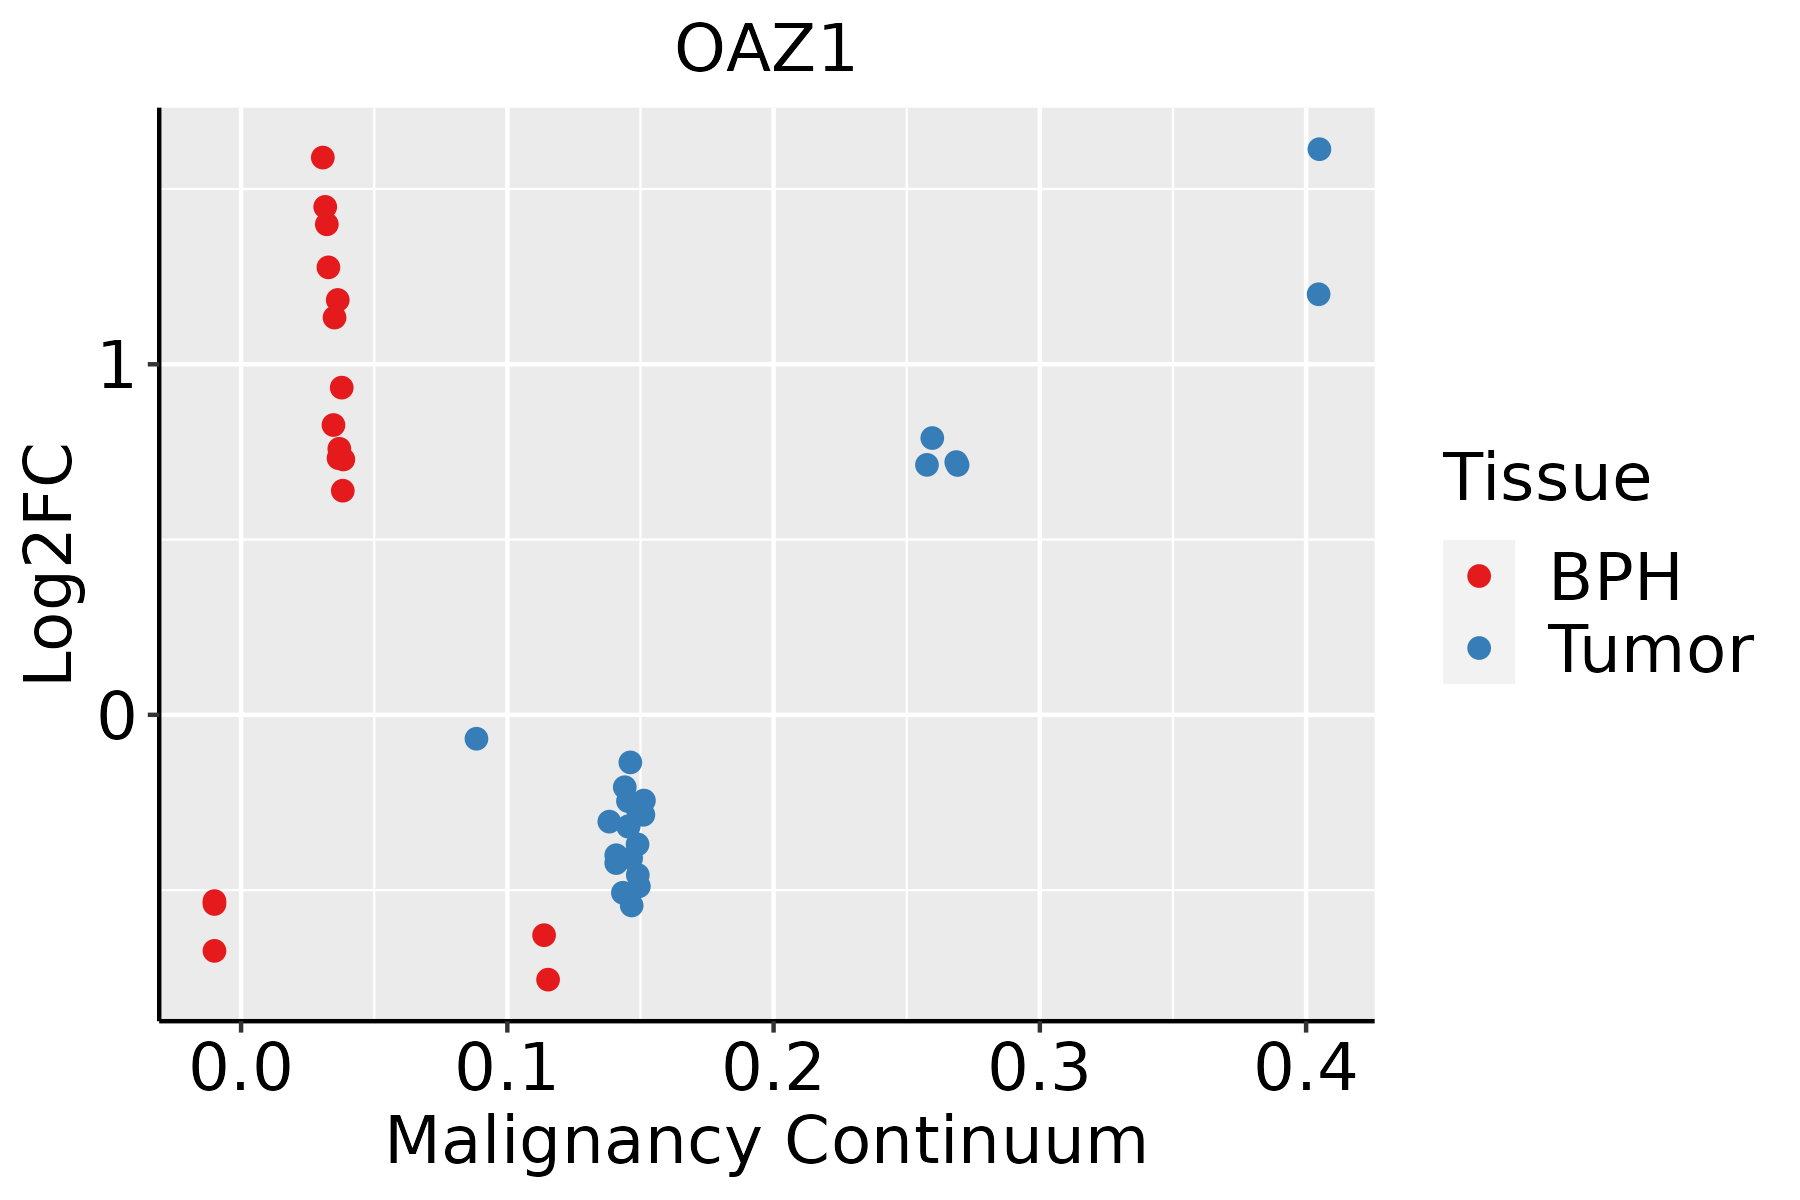 | BPH: Benign Prostatic Hyperplasia |
| Skin |  | AK: Actinic keratosis |
| cSCC: Cutaneous squamous cell carcinoma | ||
| SCCIS:squamous cell carcinoma in situ | ||
| Thyroid | 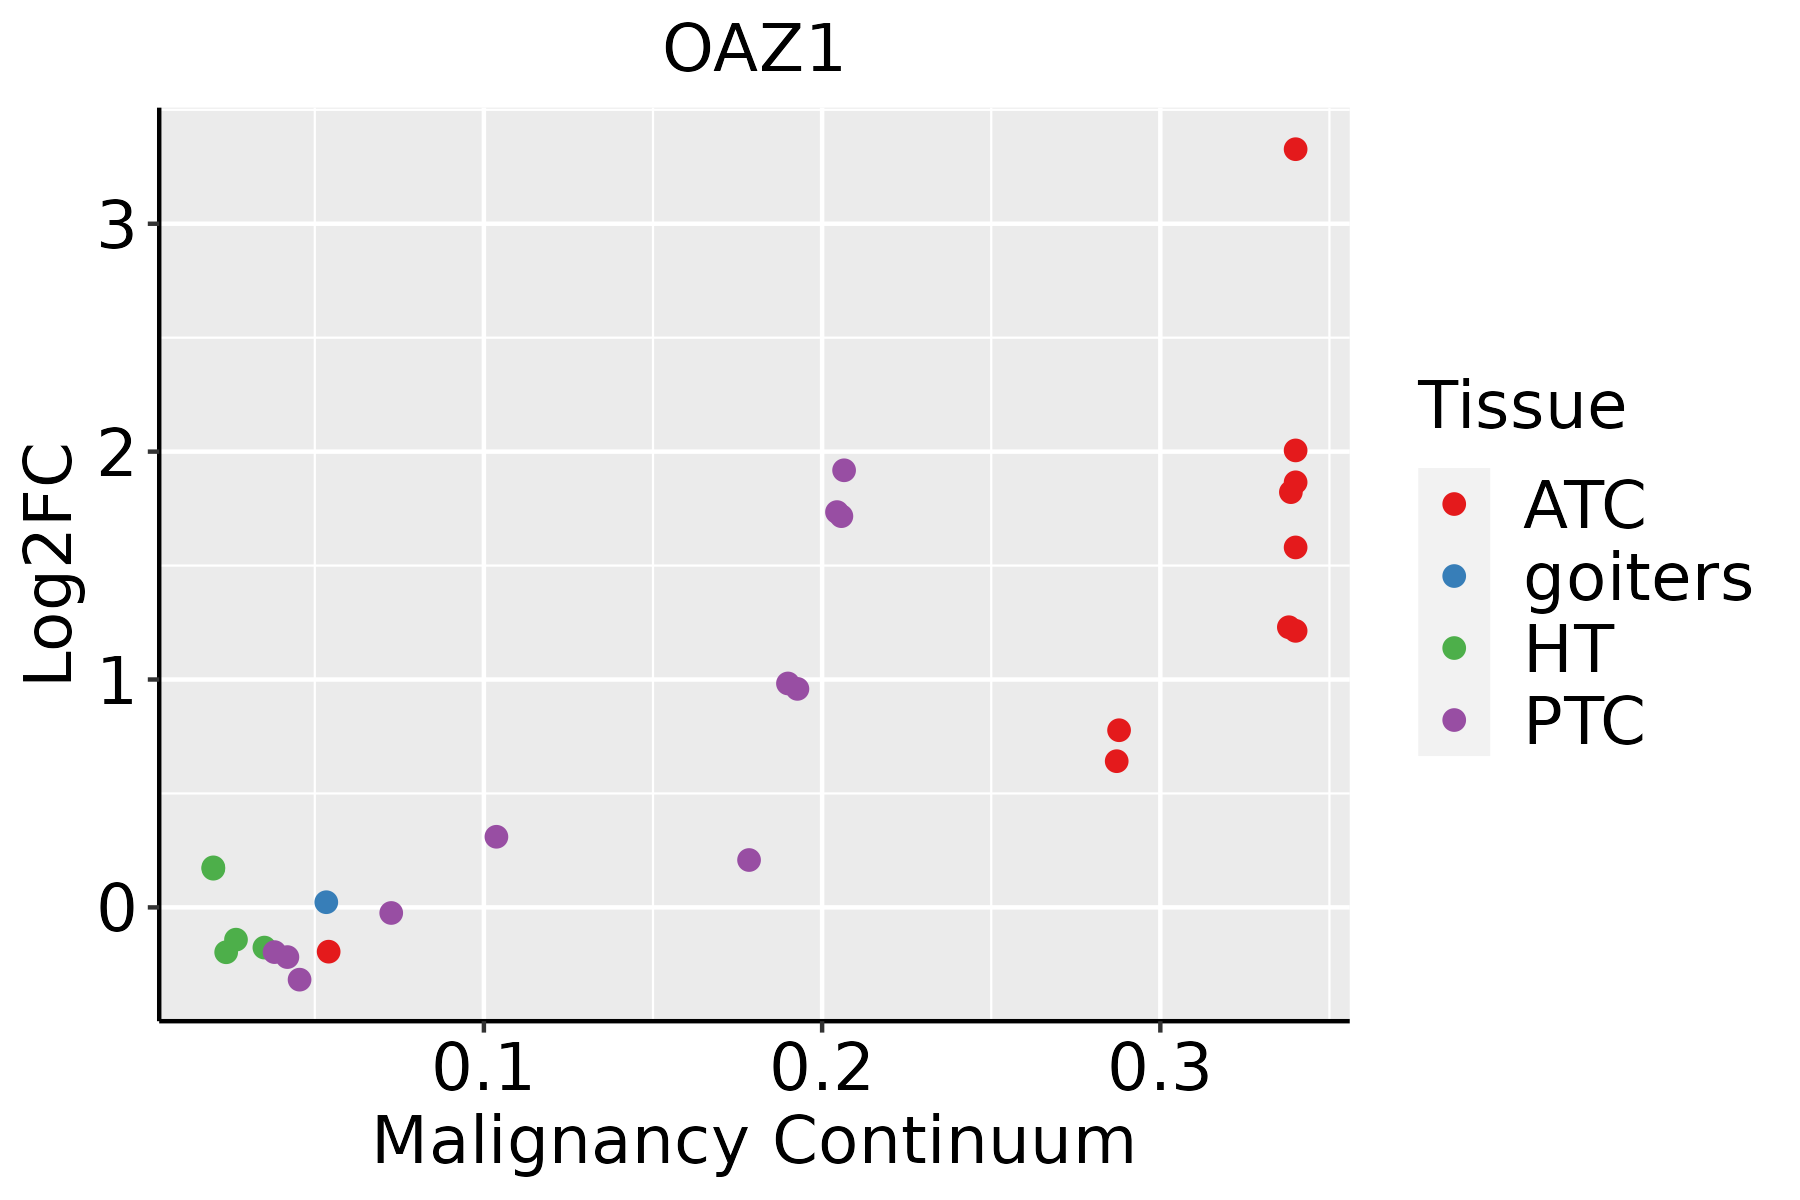 | ATC: Anaplastic thyroid cancer |
| HT: Hashimoto's thyroiditis | ||
| PTC: Papillary thyroid cancer |
| ∗log2FC in expression of this searched gene in stem-like cells from each diseased tissue sample relative to stem-like cells in normal samples in each tissue plotted against the malignancy continuum. Samples are colored based on if they are from different disease stage. |
Top |
Malignant transformation related pathway analysis |
| Find out the enriched GO biological processes and KEGG pathways involved in transition from healthy to precancer to cancer |
| Tissue | Disease Stage | Enriched GO biological Processes |
| Colorectum | AD |  |
| Colorectum | SER |  |
| Colorectum | MSS |  |
| Colorectum | MSI-H |  |
| Colorectum | FAP |  |
| ∗Top 15 enriched GO BP terms are showed in the bar plot of each disease state in each tissue. Each row represents a significant GO biological process which is colored according to the -log10(p.adjust). |
| Page: 1 2 3 4 5 6 7 8 9 |
| GO ID | Tissue | Disease Stage | Description | Gene Ratio | Bg Ratio | pvalue | p.adjust | Count |
| GO:004217610 | Cervix | CC | regulation of protein catabolic process | 104/2311 | 391/18723 | 9.39e-15 | 9.36e-12 | 104 |
| GO:004573210 | Cervix | CC | positive regulation of protein catabolic process | 65/2311 | 231/18723 | 7.44e-11 | 1.39e-08 | 65 |
| GO:000989610 | Cervix | CC | positive regulation of catabolic process | 109/2311 | 492/18723 | 5.26e-10 | 6.99e-08 | 109 |
| GO:005122210 | Cervix | CC | positive regulation of protein transport | 72/2311 | 303/18723 | 2.36e-08 | 1.70e-06 | 72 |
| GO:190495110 | Cervix | CC | positive regulation of establishment of protein localization | 73/2311 | 319/18723 | 9.69e-08 | 5.25e-06 | 73 |
| GO:00903167 | Cervix | CC | positive regulation of intracellular protein transport | 41/2311 | 160/18723 | 3.24e-06 | 8.80e-05 | 41 |
| GO:00323868 | Cervix | CC | regulation of intracellular transport | 71/2311 | 337/18723 | 3.70e-06 | 9.74e-05 | 71 |
| GO:00331579 | Cervix | CC | regulation of intracellular protein transport | 52/2311 | 229/18723 | 8.16e-06 | 1.88e-04 | 52 |
| GO:00323889 | Cervix | CC | positive regulation of intracellular transport | 46/2311 | 202/18723 | 2.45e-05 | 4.24e-04 | 46 |
| GO:004217615 | Cervix | HSIL_HPV | regulation of protein catabolic process | 34/737 | 391/18723 | 1.41e-05 | 4.41e-04 | 34 |
| GO:004573215 | Cervix | HSIL_HPV | positive regulation of protein catabolic process | 22/737 | 231/18723 | 1.24e-04 | 2.49e-03 | 22 |
| GO:005122214 | Cervix | HSIL_HPV | positive regulation of protein transport | 23/737 | 303/18723 | 2.11e-03 | 2.17e-02 | 23 |
| GO:190495114 | Cervix | HSIL_HPV | positive regulation of establishment of protein localization | 23/737 | 319/18723 | 4.01e-03 | 3.45e-02 | 23 |
| GO:0042176 | Colorectum | AD | regulation of protein catabolic process | 160/3918 | 391/18723 | 1.06e-19 | 7.34e-17 | 160 |
| GO:0009896 | Colorectum | AD | positive regulation of catabolic process | 180/3918 | 492/18723 | 4.33e-16 | 1.94e-13 | 180 |
| GO:0045732 | Colorectum | AD | positive regulation of protein catabolic process | 92/3918 | 231/18723 | 3.85e-11 | 4.47e-09 | 92 |
| GO:1904951 | Colorectum | AD | positive regulation of establishment of protein localization | 112/3918 | 319/18723 | 2.55e-09 | 1.80e-07 | 112 |
| GO:0051222 | Colorectum | AD | positive regulation of protein transport | 106/3918 | 303/18723 | 8.45e-09 | 5.08e-07 | 106 |
| GO:0090316 | Colorectum | AD | positive regulation of intracellular protein transport | 62/3918 | 160/18723 | 1.82e-07 | 7.79e-06 | 62 |
| GO:0032388 | Colorectum | AD | positive regulation of intracellular transport | 74/3918 | 202/18723 | 1.83e-07 | 7.80e-06 | 74 |
| Page: 1 2 3 4 5 6 7 8 9 10 11 12 13 14 |
| Pathway ID | Tissue | Disease Stage | Description | Gene Ratio | Bg Ratio | pvalue | p.adjust | qvalue | Count |
| Page: 1 |
Top |
Cell-cell communication analysis |
| Identification of potential cell-cell interactions between two cell types and their ligand-receptor pairs for different disease states |
| Ligand | Receptor | LRpair | Pathway | Tissue | Disease Stage |
| Page: 1 |
Top |
Single-cell gene regulatory network inference analysis |
| Find out the significant the regulons (TFs) and the target genes of each regulon across cell types for different disease states |
| TF | Cell Type | Tissue | Disease Stage | Target Gene | RSS | Regulon Activity |
| ∗The dot plots of a searched regulon are shown for all cell subpopulations in each disease state of each tissue based on the regulon specific score inferred using pySCENIC and by calculating the average expression. |
| Page: 1 |
Top |
Somatic mutation of malignant transformation related genes |
| Annotation of somatic variants for genes involved in malignant transformation |
| Hugo Symbol | Variant Class | Variant Classification | dbSNP RS | HGVSc | HGVSp | HGVSp Short | SWISSPROT | BIOTYPE | SIFT | PolyPhen | Tumor Sample Barcode | Tissue | Histology | Sex | Age | Stage | Therapy Types | Drugs | Outcome |
| OAZ1 | SNV | Missense_Mutation | novel | c.663N>C | p.Glu221Asp | p.E221D | P54368 | protein_coding | tolerated(1) | benign(0) | TCGA-AC-A6IW-01 | Breast | breast invasive carcinoma | Female | >=65 | I/II | Unknown | Unknown | SD |
| OAZ1 | SNV | Missense_Mutation | novel | c.233N>T | p.Pro78Leu | p.P78L | P54368 | protein_coding | deleterious(0) | possibly_damaging(0.659) | TCGA-EK-A2RJ-01 | Cervix | cervical & endocervical cancer | Female | <65 | I/II | Unknown | Unknown | SD |
| OAZ1 | SNV | Missense_Mutation | rs772512082 | c.423N>G | p.Ile141Met | p.I141M | P54368 | protein_coding | deleterious(0) | possibly_damaging(0.892) | TCGA-EK-A2RJ-01 | Cervix | cervical & endocervical cancer | Female | <65 | I/II | Unknown | Unknown | SD |
| OAZ1 | SNV | Missense_Mutation | c.76N>A | p.Ala26Thr | p.A26T | P54368 | protein_coding | tolerated_low_confidence(0.41) | benign(0) | TCGA-AD-6964-01 | Colorectum | colon adenocarcinoma | Male | <65 | III/IV | Chemotherapy | folfox | PD | |
| OAZ1 | SNV | Missense_Mutation | c.122N>A | p.Ser41Asn | p.S41N | P54368 | protein_coding | deleterious(0.04) | benign(0.079) | TCGA-D5-6530-01 | Colorectum | colon adenocarcinoma | Male | <65 | I/II | Unknown | Unknown | SD | |
| OAZ1 | SNV | Missense_Mutation | rs763840090 | c.52G>C | p.Glu18Gln | p.E18Q | P54368 | protein_coding | deleterious(0) | probably_damaging(0.998) | TCGA-DC-4749-01 | Colorectum | rectum adenocarcinoma | Male | <65 | I/II | Unknown | Unknown | SD |
| OAZ1 | SNV | Missense_Mutation | novel | c.74G>T | p.Ser25Ile | p.S25I | P54368 | protein_coding | tolerated(0.22) | benign(0.074) | TCGA-A5-A0G1-01 | Endometrium | uterine corpus endometrioid carcinoma | Female | >=65 | I/II | Unknown | Unknown | SD |
| OAZ1 | SNV | Missense_Mutation | novel | c.599C>A | p.Pro200Gln | p.P200Q | P54368 | protein_coding | deleterious(0) | probably_damaging(0.999) | TCGA-AJ-A3BH-01 | Endometrium | uterine corpus endometrioid carcinoma | Female | Unknown | I/II | Unknown | Unknown | SD |
| OAZ1 | SNV | Missense_Mutation | novel | c.200G>T | p.Cys67Phe | p.C67F | P54368 | protein_coding | deleterious(0) | possibly_damaging(0.781) | TCGA-AX-A1CE-01 | Endometrium | uterine corpus endometrioid carcinoma | Female | <65 | I/II | Unspecific | Paclitaxel | SD |
| OAZ1 | SNV | Missense_Mutation | novel | c.455N>A | p.Ser152Asn | p.S152N | P54368 | protein_coding | tolerated(0.15) | possibly_damaging(0.446) | TCGA-BG-A221-01 | Endometrium | uterine corpus endometrioid carcinoma | Female | >=65 | I/II | Unknown | Unknown | SD |
| Page: 1 2 |
Top |
Related drugs of malignant transformation related genes |
| Identification of chemicals and drugs interact with genes involved in malignant transfromation |
| (DGIdb 4.0) |
| Entrez ID | Symbol | Category | Interaction Types | Drug Claim Name | Drug Name | PMIDs |
| Page: 1 |

Copyright 2023-Present -The University of Texas Health Science Center at Houston |