
|
|||||
|
 | |
| |
| |
| |
| |
| |
|
Gene: NUFIP2 |
Gene summary for NUFIP2 |
| Gene information | Species | Human | Gene symbol | NUFIP2 | Gene ID | 57532 |
| Gene name | nuclear FMR1 interacting protein 2 | |
| Gene Alias | 182-FIP | |
| Cytomap | 17q11.2 | |
| Gene Type | protein-coding | GO ID | GO:0005575 | UniProtAcc | Q7Z417 |
Top |
Malignant transformation analysis |
| Identification of the aberrant gene expression in precancerous and cancerous lesions by comparing the gene expression of stem-like cells in diseased tissues with normal stem cells |
| Entrez ID | Symbol | Replicates | Species | Organ | Tissue | Adj P-value | Log2FC | Malignancy |
| 57532 | NUFIP2 | HCC1_Meng | Human | Liver | HCC | 1.80e-55 | 1.04e-01 | 0.0246 |
| 57532 | NUFIP2 | HCC2_Meng | Human | Liver | HCC | 1.54e-38 | 2.61e-01 | 0.0107 |
| 57532 | NUFIP2 | HCC2 | Human | Liver | HCC | 2.91e-09 | 3.41e+00 | 0.5341 |
| 57532 | NUFIP2 | Pt13.b | Human | Liver | HCC | 5.97e-15 | 8.52e-02 | 0.0251 |
| 57532 | NUFIP2 | Pt14.b | Human | Liver | HCC | 4.78e-03 | 8.46e-02 | 0.018 |
| 57532 | NUFIP2 | S014 | Human | Liver | HCC | 6.49e-06 | 5.59e-01 | 0.2254 |
| 57532 | NUFIP2 | S015 | Human | Liver | HCC | 4.17e-08 | 8.03e-01 | 0.2375 |
| 57532 | NUFIP2 | S016 | Human | Liver | HCC | 2.93e-04 | 5.03e-01 | 0.2243 |
| 57532 | NUFIP2 | S027 | Human | Liver | HCC | 5.46e-09 | 1.16e+00 | 0.2446 |
| 57532 | NUFIP2 | S028 | Human | Liver | HCC | 1.28e-17 | 1.21e+00 | 0.2503 |
| 57532 | NUFIP2 | S029 | Human | Liver | HCC | 5.54e-11 | 9.58e-01 | 0.2581 |
| 57532 | NUFIP2 | C04 | Human | Oral cavity | OSCC | 2.36e-09 | 7.17e-01 | 0.2633 |
| 57532 | NUFIP2 | C21 | Human | Oral cavity | OSCC | 1.20e-17 | 6.83e-01 | 0.2678 |
| 57532 | NUFIP2 | C30 | Human | Oral cavity | OSCC | 4.79e-11 | 6.95e-01 | 0.3055 |
| 57532 | NUFIP2 | C38 | Human | Oral cavity | OSCC | 1.15e-05 | 1.20e+00 | 0.172 |
| 57532 | NUFIP2 | C43 | Human | Oral cavity | OSCC | 7.04e-14 | 3.54e-01 | 0.1704 |
| 57532 | NUFIP2 | C46 | Human | Oral cavity | OSCC | 2.99e-02 | 2.60e-01 | 0.1673 |
| 57532 | NUFIP2 | C51 | Human | Oral cavity | OSCC | 5.42e-09 | 5.99e-01 | 0.2674 |
| 57532 | NUFIP2 | C06 | Human | Oral cavity | OSCC | 1.09e-04 | 8.91e-01 | 0.2699 |
| 57532 | NUFIP2 | C08 | Human | Oral cavity | OSCC | 1.91e-15 | 3.94e-01 | 0.1919 |
| Page: 1 2 3 4 5 6 7 8 9 |
| Tissue | Expression Dynamics | Abbreviation |
| Cervix | 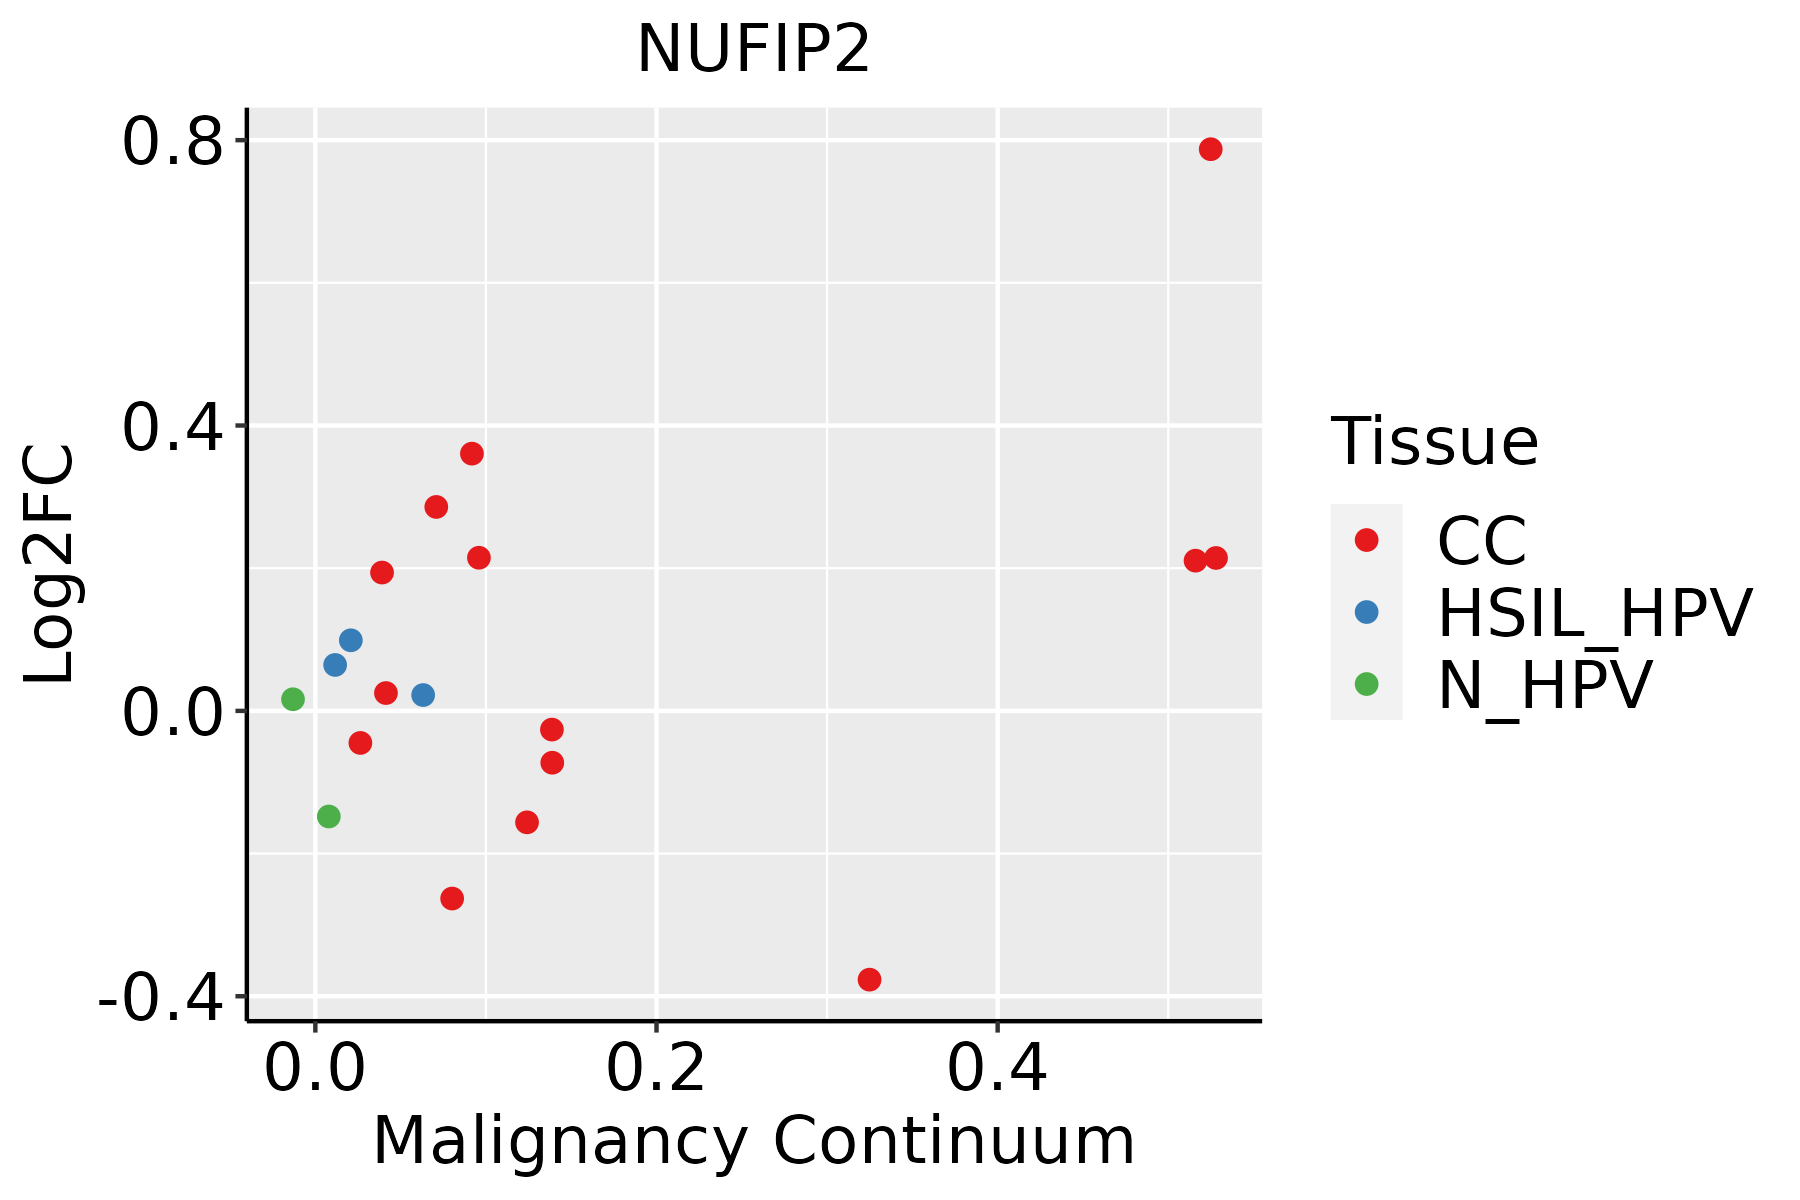 | CC: Cervix cancer |
| HSIL_HPV: HPV-infected high-grade squamous intraepithelial lesions | ||
| N_HPV: HPV-infected normal cervix | ||
| Endometrium |  | AEH: Atypical endometrial hyperplasia |
| EEC: Endometrioid Cancer | ||
| Esophagus | 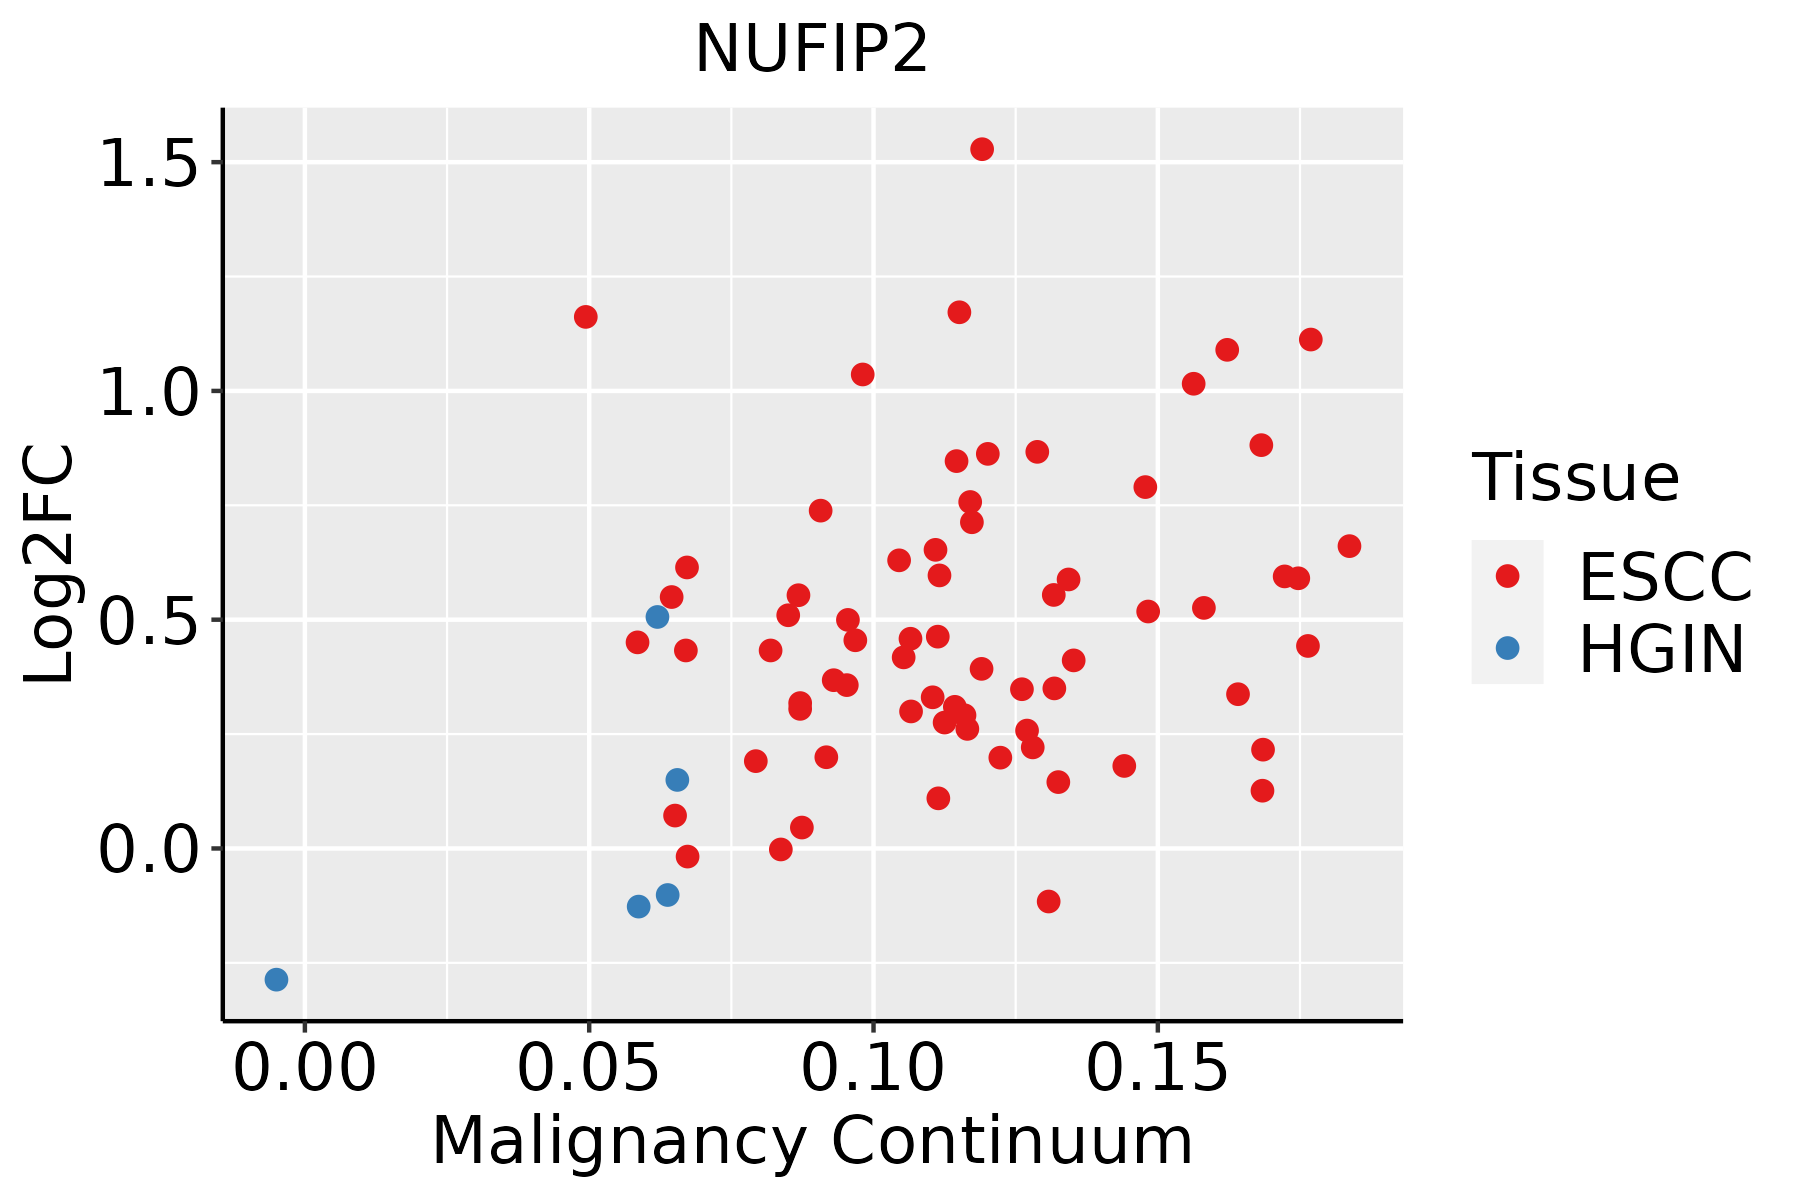 | ESCC: Esophageal squamous cell carcinoma |
| HGIN: High-grade intraepithelial neoplasias | ||
| LGIN: Low-grade intraepithelial neoplasias | ||
| Liver | 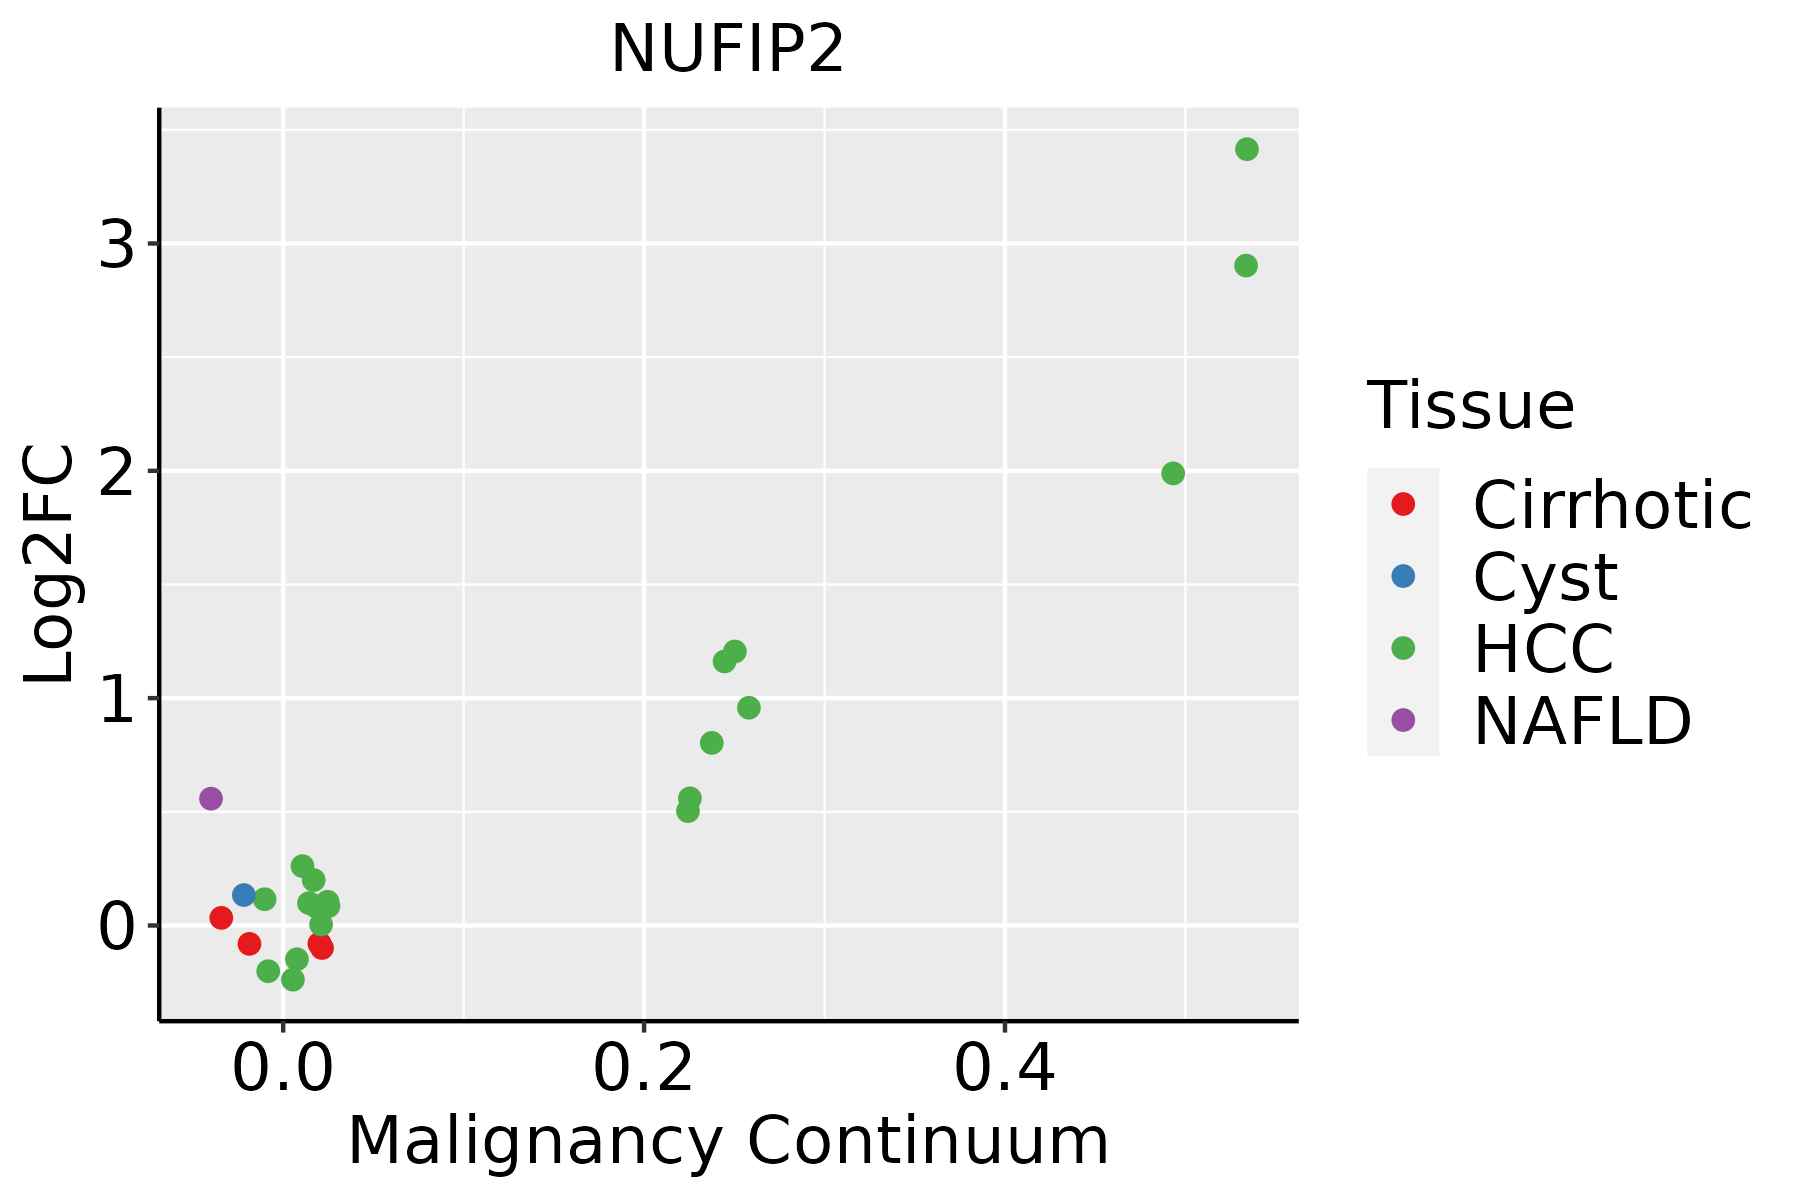 | HCC: Hepatocellular carcinoma |
| NAFLD: Non-alcoholic fatty liver disease | ||
| Oral Cavity |  | EOLP: Erosive Oral lichen planus |
| LP: leukoplakia | ||
| NEOLP: Non-erosive oral lichen planus | ||
| OSCC: Oral squamous cell carcinoma | ||
| Prostate |  | BPH: Benign Prostatic Hyperplasia |
| Skin | 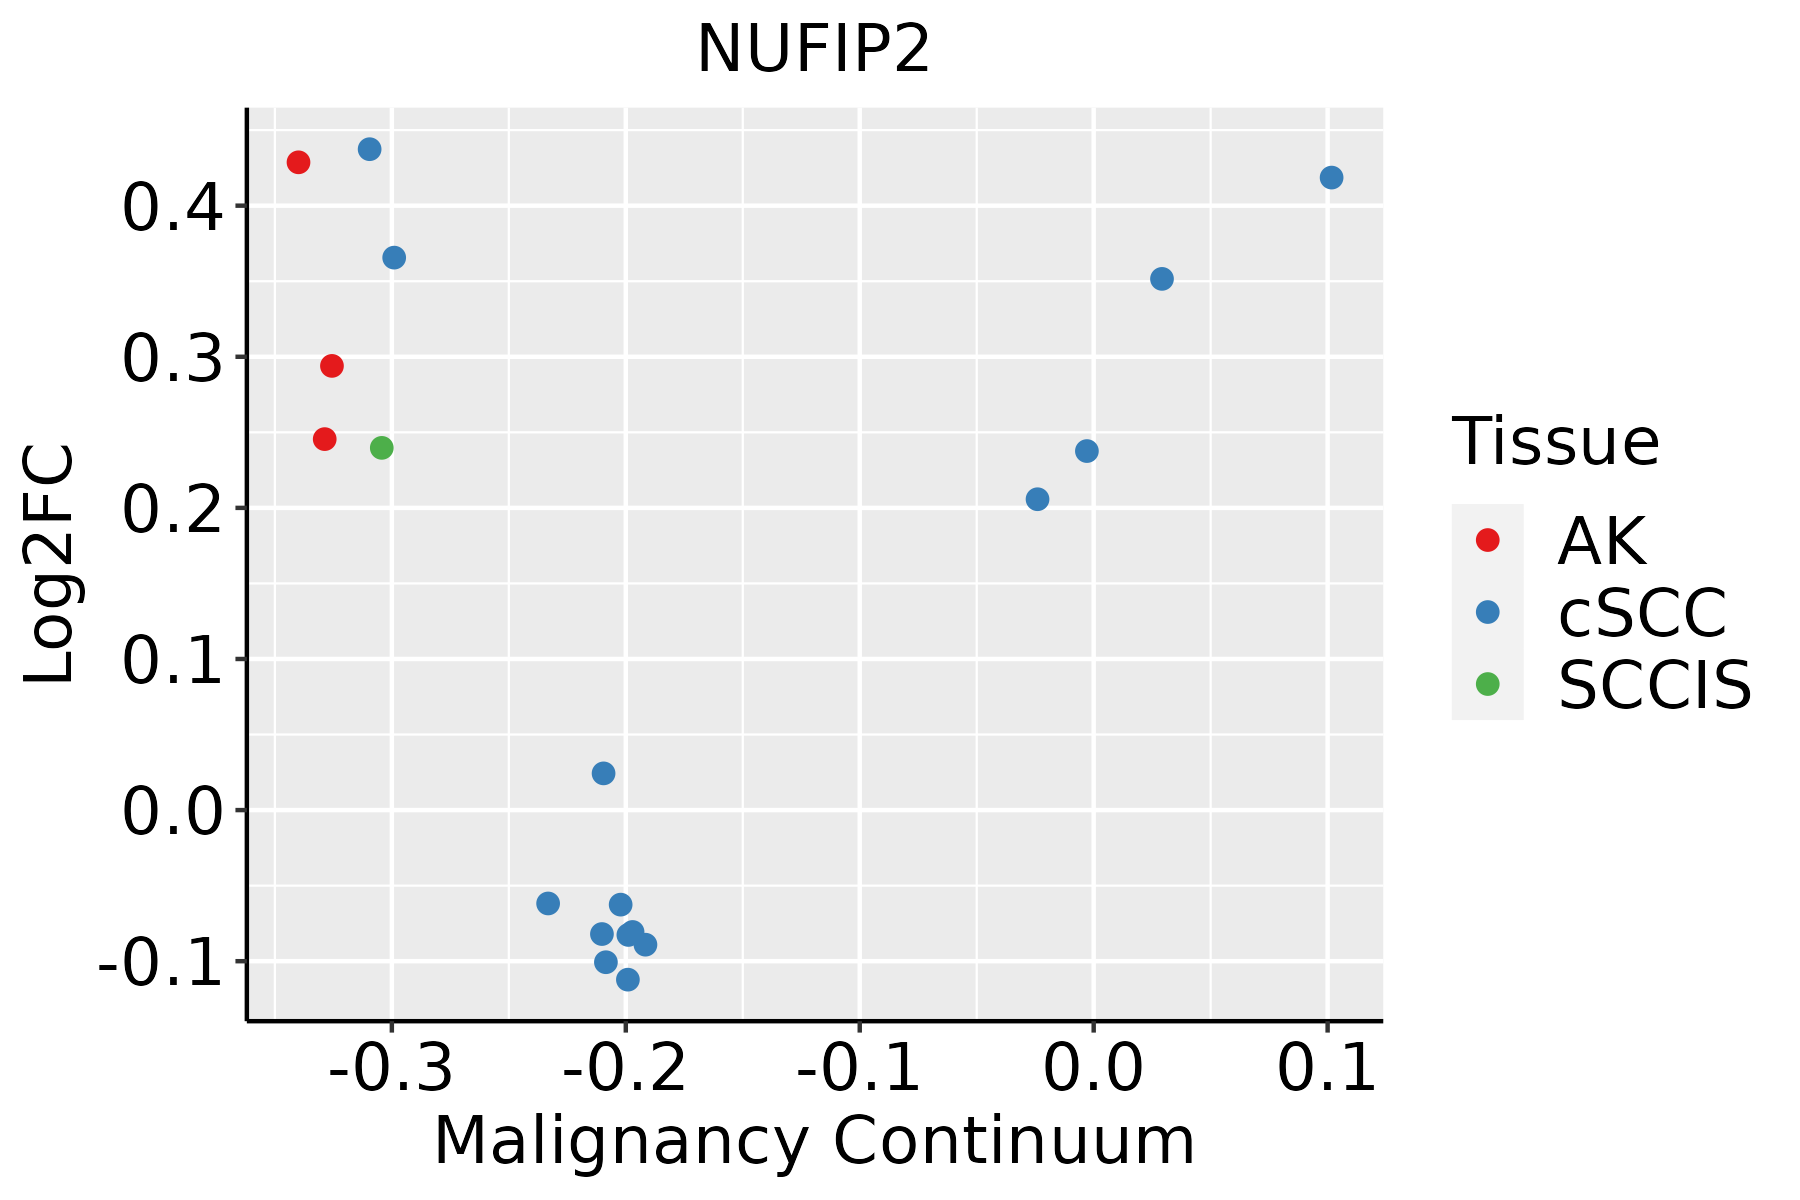 | AK: Actinic keratosis |
| cSCC: Cutaneous squamous cell carcinoma | ||
| SCCIS:squamous cell carcinoma in situ | ||
| Thyroid |  | ATC: Anaplastic thyroid cancer |
| HT: Hashimoto's thyroiditis | ||
| PTC: Papillary thyroid cancer |
| ∗log2FC in expression of this searched gene in stem-like cells from each diseased tissue sample relative to stem-like cells in normal samples in each tissue plotted against the malignancy continuum. Samples are colored based on if they are from different disease stage. |
Top |
Malignant transformation related pathway analysis |
| Find out the enriched GO biological processes and KEGG pathways involved in transition from healthy to precancer to cancer |
| Tissue | Disease Stage | Enriched GO biological Processes |
| Colorectum | AD |  |
| Colorectum | SER |  |
| Colorectum | MSS |  |
| Colorectum | MSI-H |  |
| Colorectum | FAP |  |
| ∗Top 15 enriched GO BP terms are showed in the bar plot of each disease state in each tissue. Each row represents a significant GO biological process which is colored according to the -log10(p.adjust). |
| Page: 1 2 3 4 5 6 7 8 9 |
| GO ID | Tissue | Disease Stage | Description | Gene Ratio | Bg Ratio | pvalue | p.adjust | Count |
| Page: 1 |
| Pathway ID | Tissue | Disease Stage | Description | Gene Ratio | Bg Ratio | pvalue | p.adjust | qvalue | Count |
| Page: 1 |
Top |
Cell-cell communication analysis |
| Identification of potential cell-cell interactions between two cell types and their ligand-receptor pairs for different disease states |
| Ligand | Receptor | LRpair | Pathway | Tissue | Disease Stage |
| Page: 1 |
Top |
Single-cell gene regulatory network inference analysis |
| Find out the significant the regulons (TFs) and the target genes of each regulon across cell types for different disease states |
| TF | Cell Type | Tissue | Disease Stage | Target Gene | RSS | Regulon Activity |
| ∗The dot plots of a searched regulon are shown for all cell subpopulations in each disease state of each tissue based on the regulon specific score inferred using pySCENIC and by calculating the average expression. |
| Page: 1 |
Top |
Somatic mutation of malignant transformation related genes |
| Annotation of somatic variants for genes involved in malignant transformation |
| Hugo Symbol | Variant Class | Variant Classification | dbSNP RS | HGVSc | HGVSp | HGVSp Short | SWISSPROT | BIOTYPE | SIFT | PolyPhen | Tumor Sample Barcode | Tissue | Histology | Sex | Age | Stage | Therapy Types | Drugs | Outcome |
| NUFIP2 | SNV | Missense_Mutation | novel | c.1270N>C | p.Asp424His | p.D424H | Q7Z417 | protein_coding | deleterious(0.01) | possibly_damaging(0.774) | TCGA-3C-AALI-01 | Breast | breast invasive carcinoma | Female | <65 | I/II | Unspecific | Poly E | Complete Response |
| NUFIP2 | SNV | Missense_Mutation | c.1768N>A | p.Ala590Thr | p.A590T | Q7Z417 | protein_coding | tolerated(0.45) | benign(0.056) | TCGA-AN-A0AK-01 | Breast | breast invasive carcinoma | Female | >=65 | I/II | Unknown | Unknown | SD | |
| NUFIP2 | SNV | Missense_Mutation | c.7N>C | p.Glu3Gln | p.E3Q | Q7Z417 | protein_coding | deleterious_low_confidence(0) | probably_damaging(0.986) | TCGA-BH-A1F2-01 | Breast | breast invasive carcinoma | Female | <65 | III/IV | Unknown | Unknown | SD | |
| NUFIP2 | SNV | Missense_Mutation | c.187N>A | p.Glu63Lys | p.E63K | Q7Z417 | protein_coding | tolerated(0.15) | benign(0.001) | TCGA-DS-A1OB-01 | Cervix | cervical & endocervical cancer | Female | <65 | I/II | Chemotherapy | carboplatin | PD | |
| NUFIP2 | SNV | Missense_Mutation | novel | c.1036G>C | p.Asp346His | p.D346H | Q7Z417 | protein_coding | deleterious(0) | probably_damaging(1) | TCGA-EA-A43B-01 | Cervix | cervical & endocervical cancer | Female | <65 | I/II | Chemotherapy | cisplatin | CR |
| NUFIP2 | SNV | Missense_Mutation | c.703G>C | p.Glu235Gln | p.E235Q | Q7Z417 | protein_coding | deleterious(0.01) | benign(0.299) | TCGA-EK-A3GJ-01 | Cervix | cervical & endocervical cancer | Female | <65 | I/II | Unknown | Unknown | SD | |
| NUFIP2 | SNV | Missense_Mutation | novel | c.1424N>G | p.Pro475Arg | p.P475R | Q7Z417 | protein_coding | deleterious(0) | probably_damaging(0.964) | TCGA-VS-A8EJ-01 | Cervix | cervical & endocervical cancer | Female | <65 | I/II | Chemotherapy | cisplatin | PD |
| NUFIP2 | SNV | Missense_Mutation | c.456N>T | p.Lys152Asn | p.K152N | Q7Z417 | protein_coding | deleterious(0.02) | benign(0.42) | TCGA-AA-3510-01 | Colorectum | colon adenocarcinoma | Male | >=65 | I/II | Unknown | Unknown | SD | |
| NUFIP2 | SNV | Missense_Mutation | c.640N>G | p.Ser214Ala | p.S214A | Q7Z417 | protein_coding | deleterious(0.01) | probably_damaging(0.991) | TCGA-CA-6717-01 | Colorectum | colon adenocarcinoma | Male | <65 | I/II | Chemotherapy | oxaliplatin | CR | |
| NUFIP2 | SNV | Missense_Mutation | c.103C>T | p.His35Tyr | p.H35Y | Q7Z417 | protein_coding | tolerated_low_confidence(0.41) | benign(0.003) | TCGA-CM-4746-01 | Colorectum | colon adenocarcinoma | Male | <65 | I/II | Unknown | Unknown | SD |
| Page: 1 2 3 4 5 6 |
Top |
Related drugs of malignant transformation related genes |
| Identification of chemicals and drugs interact with genes involved in malignant transfromation |
| (DGIdb 4.0) |
| Entrez ID | Symbol | Category | Interaction Types | Drug Claim Name | Drug Name | PMIDs |
| Page: 1 |

Copyright 2023-Present -The University of Texas Health Science Center at Houston |