Schematic overview of the cellular and molecular mechanisms involved in the cancer progression, including the proposed cellular and molecular mechanisms in cancer cells trajectory. AT1: alveolar type 1 cells; AT2: alveolar type 2 cells; AAH: atypical adenomatous hyperplasia; AIS: adenocarcinoma in situ; MIA: minimally invasive adenocarcinoma; IA: invasive adenocarcinoma; EMT: epithelial-mesenchymal transition

Home

Download

Statistics

Help

Contact

Center for Computational Systems Medicine
leaf

Gene summary

leaf

Malignant transformation analysis

leaf

Malignant transformation related pathway analysis

leaf

Cell-cell communication analysis

leaf

Single-cell gene regulatory network inference analysis

leaf

Somatic mutation of malignant transformation related genes

leaf

Related drugs of malignant transformation related genes

Gene: NSUN2

Gene summary for NSUN2

check button Gene summary.

Gene informationSpeciesHuman
Gene symbol

NSUN2

Gene ID

54888

Gene nameNOP2/Sun RNA methyltransferase 2
Gene AliasMISU
Cytomap5p15.31
Gene Typeprotein-coding
GO ID

GO:0000003

UniProtAcc

Q08J23


Top

Malignant transformation analysis

check button Identification of the aberrant gene expression in precancerous and cancerous lesions by comparing the gene expression of stem-like cells in diseased tissues with normal stem cells
check button Malignant transformation involving gene list.
Entrez IDSymbolReplicatesSpeciesOrganTissueAdj P-valueLog2FCMalignancy
54888NSUN2P127T-EHumanEsophagusESCC7.86e-232.51e-010.0826
54888NSUN2P128T-EHumanEsophagusESCC1.40e-561.92e+000.1241
54888NSUN2P130T-EHumanEsophagusESCC6.59e-731.39e+000.1676
54888NSUN2NAFLD1HumanLiverNAFLD3.21e-023.52e-01-0.04
54888NSUN2HCC1_MengHumanLiverHCC5.32e-441.75e-030.0246
54888NSUN2HCC2_MengHumanLiverHCC3.65e-07-2.83e-020.0107
54888NSUN2HCC1HumanLiverHCC1.37e-103.53e+000.5336
54888NSUN2HCC2HumanLiverHCC9.77e-133.14e+000.5341
54888NSUN2S014HumanLiverHCC1.54e-218.15e-010.2254
54888NSUN2S015HumanLiverHCC5.18e-147.97e-010.2375
54888NSUN2S016HumanLiverHCC3.44e-187.09e-010.2243
54888NSUN2S027HumanLiverHCC2.25e-067.19e-010.2446
54888NSUN2S028HumanLiverHCC1.28e-179.69e-010.2503
54888NSUN2S029HumanLiverHCC6.07e-149.27e-010.2581
54888NSUN2RNA-P17T-P17T-2HumanLungIAC9.76e-079.51e-010.3371
54888NSUN2RNA-P17T-P17T-4HumanLungIAC2.97e-079.74e-010.343
54888NSUN2C04HumanOral cavityOSCC9.79e-219.15e-010.2633
54888NSUN2C21HumanOral cavityOSCC5.95e-248.25e-010.2678
54888NSUN2C30HumanOral cavityOSCC1.63e-341.36e+000.3055
54888NSUN2C38HumanOral cavityOSCC3.14e-067.48e-010.172
Page: 1 2 3 4 5 6 7 

check button Transcriptomic changes along malignancy continuum.
TissueExpression DynamicsAbbreviation
Colorectum (GSE201348)The image shows the transcriptomic changes along malignancy continuum.log2FC in expression of this searched gene in stem-like cells from each diseased tissue sample relative to stem-like cells in normal samples in each tissue plotted against the malignancy continuum. Samples are colored based on if they are from different disease stage.
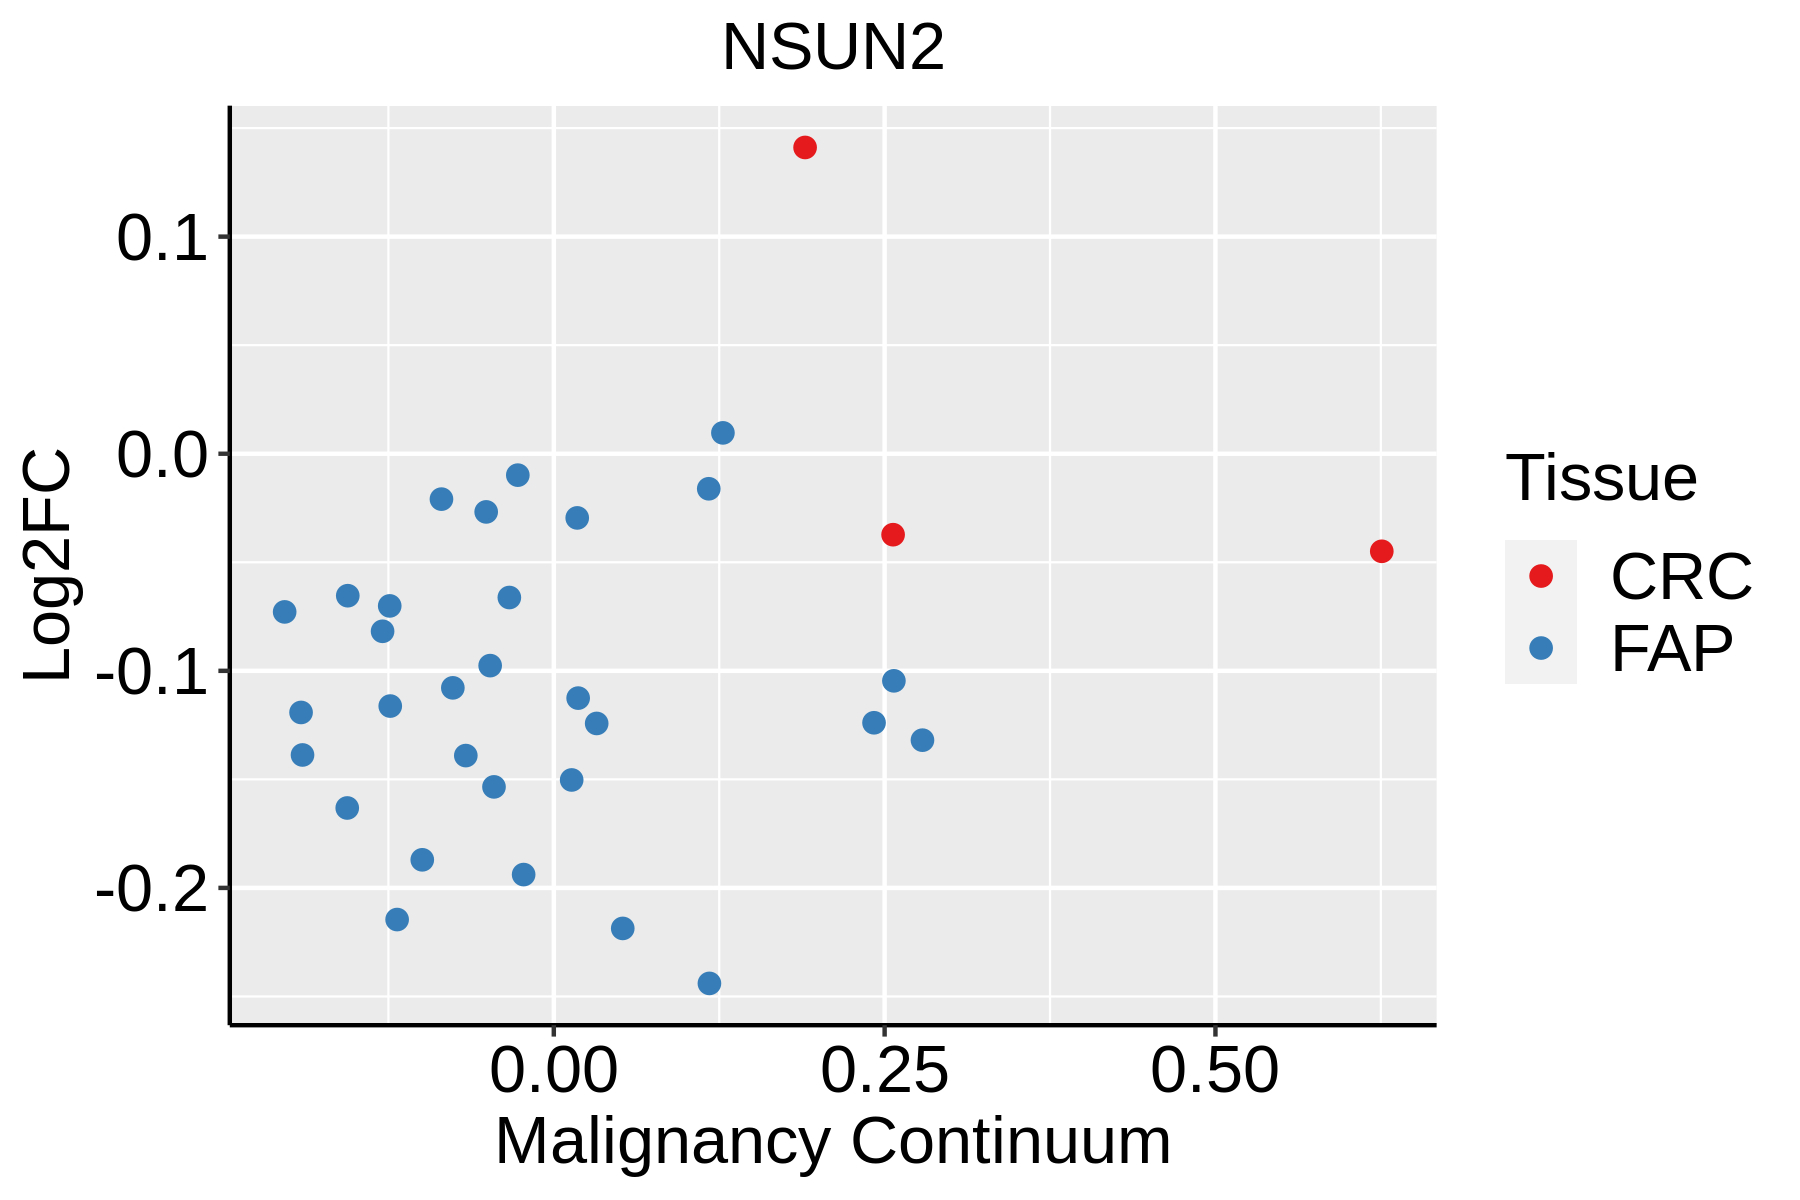
FAP: Familial adenomatous polyposis
CRC: Colorectal cancer
Colorectum (HTA11)The image shows the transcriptomic changes along malignancy continuum.log2FC in expression of this searched gene in stem-like cells from each diseased tissue sample relative to stem-like cells in normal samples in each tissue plotted against the malignancy continuum. Samples are colored based on if they are from different disease stage.AD: Adenomas
SER: Sessile serrated lesions
MSI-H: Microsatellite-high colorectal cancer
MSS: Microsatellite stable colorectal cancer
EsophagusThe image shows the transcriptomic changes along malignancy continuum.log2FC in expression of this searched gene in stem-like cells from each diseased tissue sample relative to stem-like cells in normal samples in each tissue plotted against the malignancy continuum. Samples are colored based on if they are from different disease stage.ESCC: Esophageal squamous cell carcinoma
HGIN: High-grade intraepithelial neoplasias
LGIN: Low-grade intraepithelial neoplasias
LiverThe image shows the transcriptomic changes along malignancy continuum.log2FC in expression of this searched gene in stem-like cells from each diseased tissue sample relative to stem-like cells in normal samples in each tissue plotted against the malignancy continuum. Samples are colored based on if they are from different disease stage.
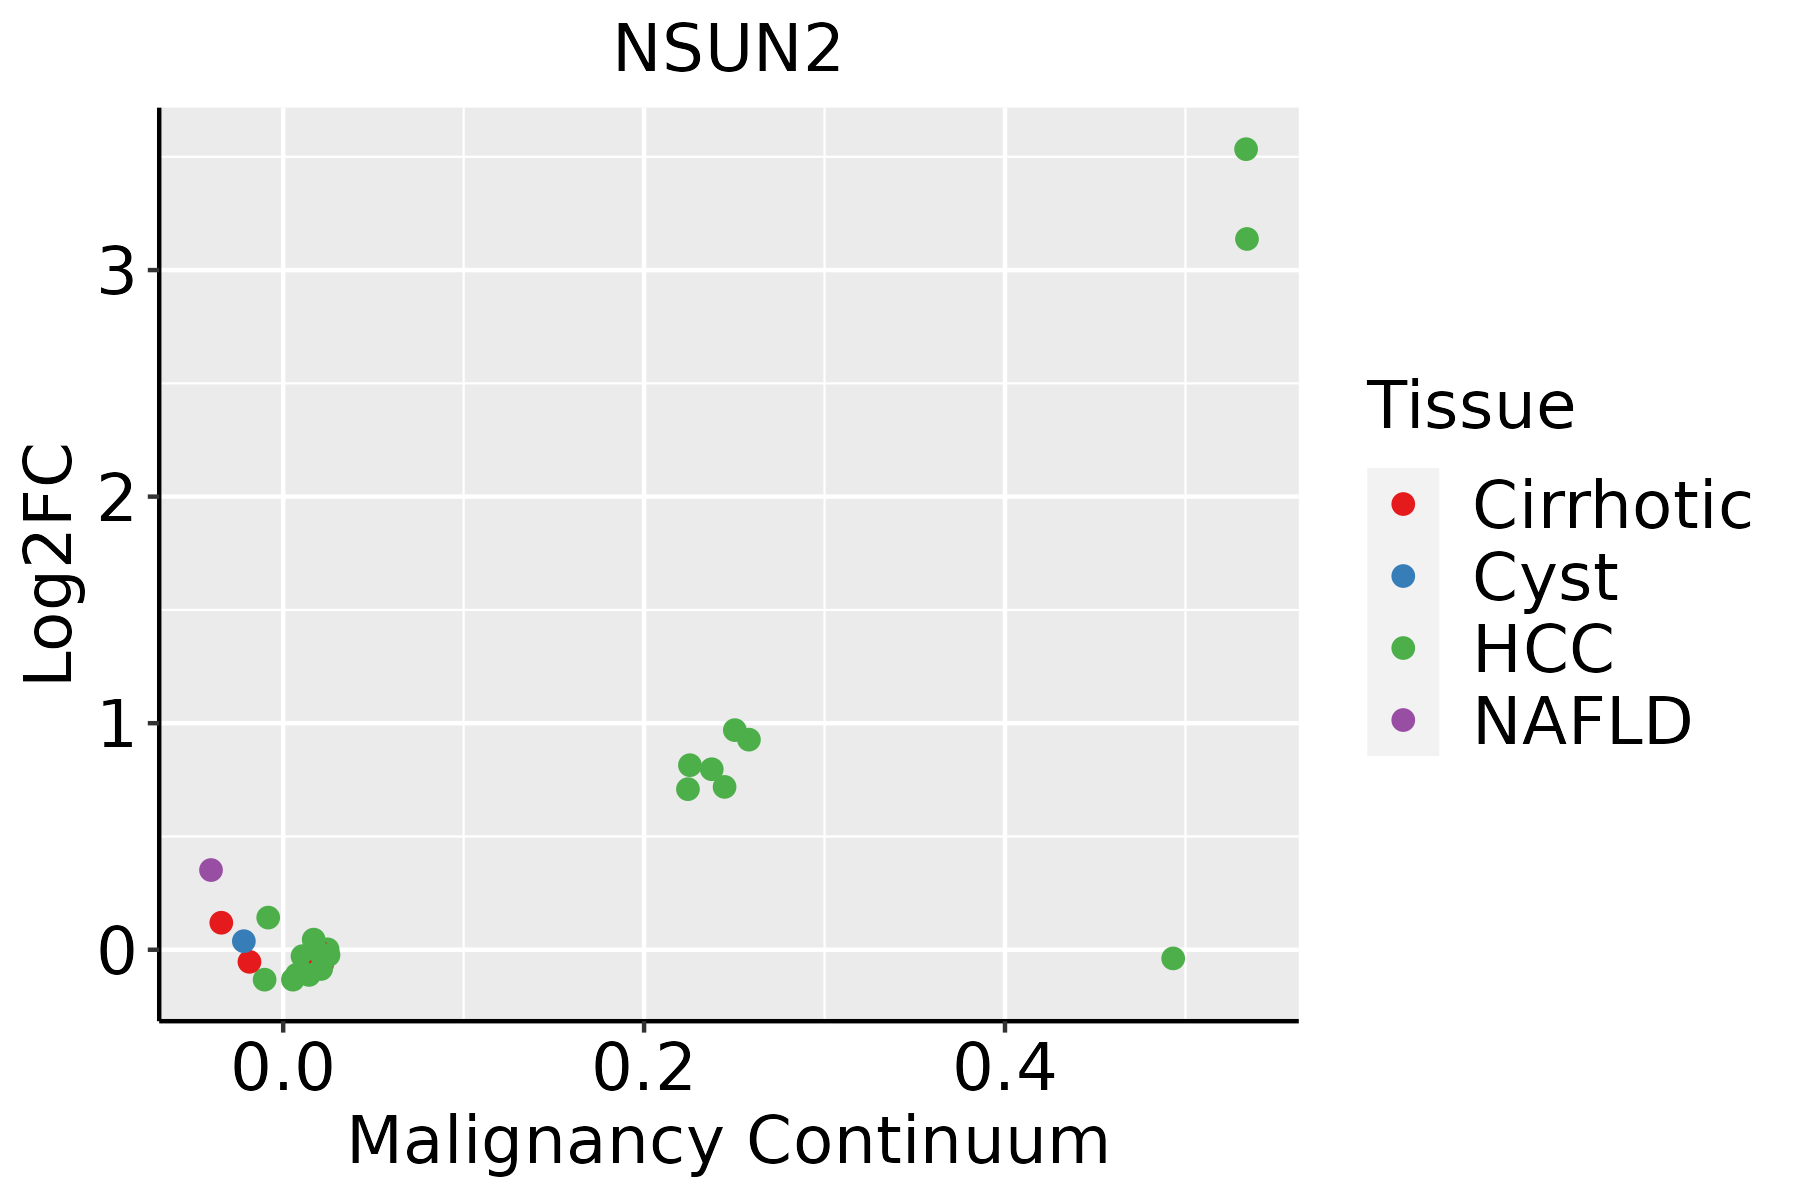
HCC: Hepatocellular carcinoma
NAFLD: Non-alcoholic fatty liver disease
LungThe image shows the transcriptomic changes along malignancy continuum.log2FC in expression of this searched gene in stem-like cells from each diseased tissue sample relative to stem-like cells in normal samples in each tissue plotted against the malignancy continuum. Samples are colored based on if they are from different disease stage.
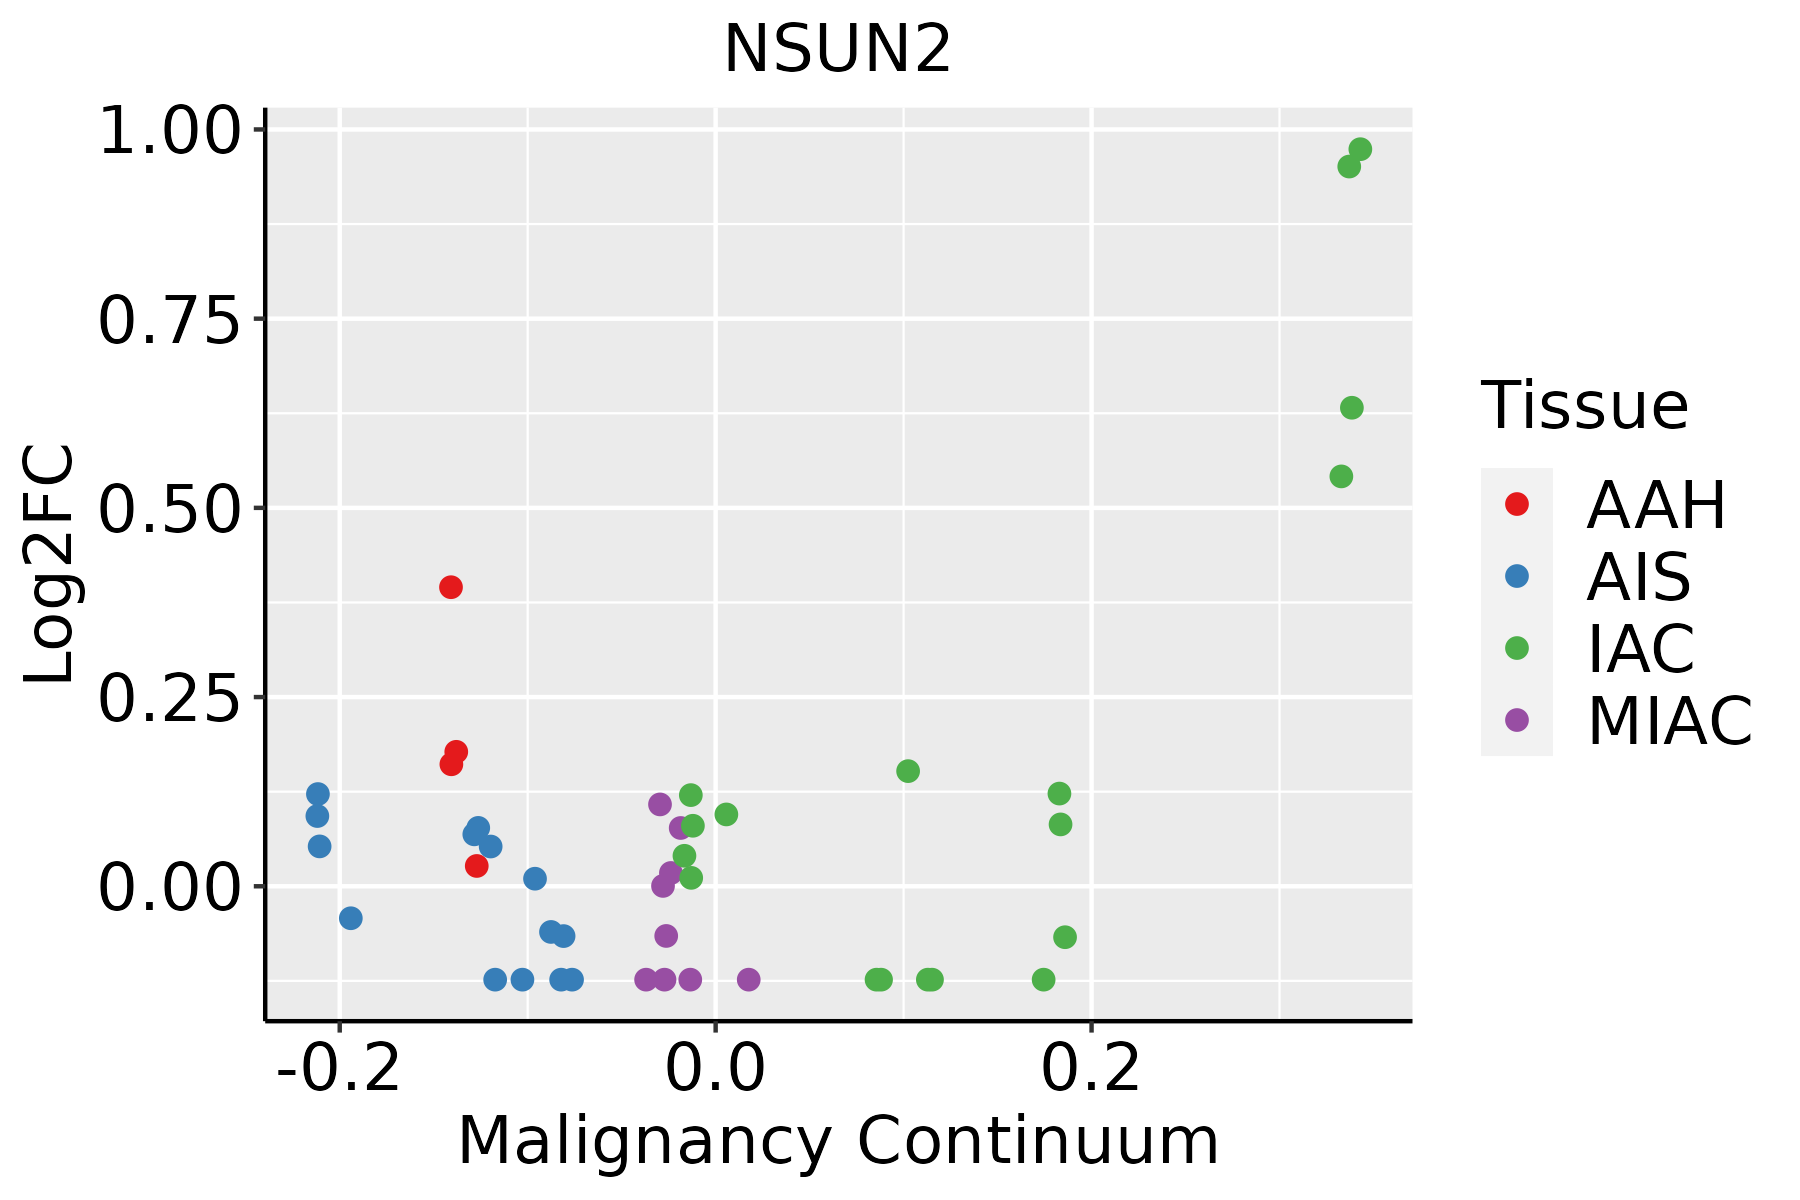
AAH: Atypical adenomatous hyperplasia
AIS: Adenocarcinoma in situ
IAC: Invasive lung adenocarcinoma
MIA: Minimally invasive adenocarcinoma
Oral CavityThe image shows the transcriptomic changes along malignancy continuum.log2FC in expression of this searched gene in stem-like cells from each diseased tissue sample relative to stem-like cells in normal samples in each tissue plotted against the malignancy continuum. Samples are colored based on if they are from different disease stage.
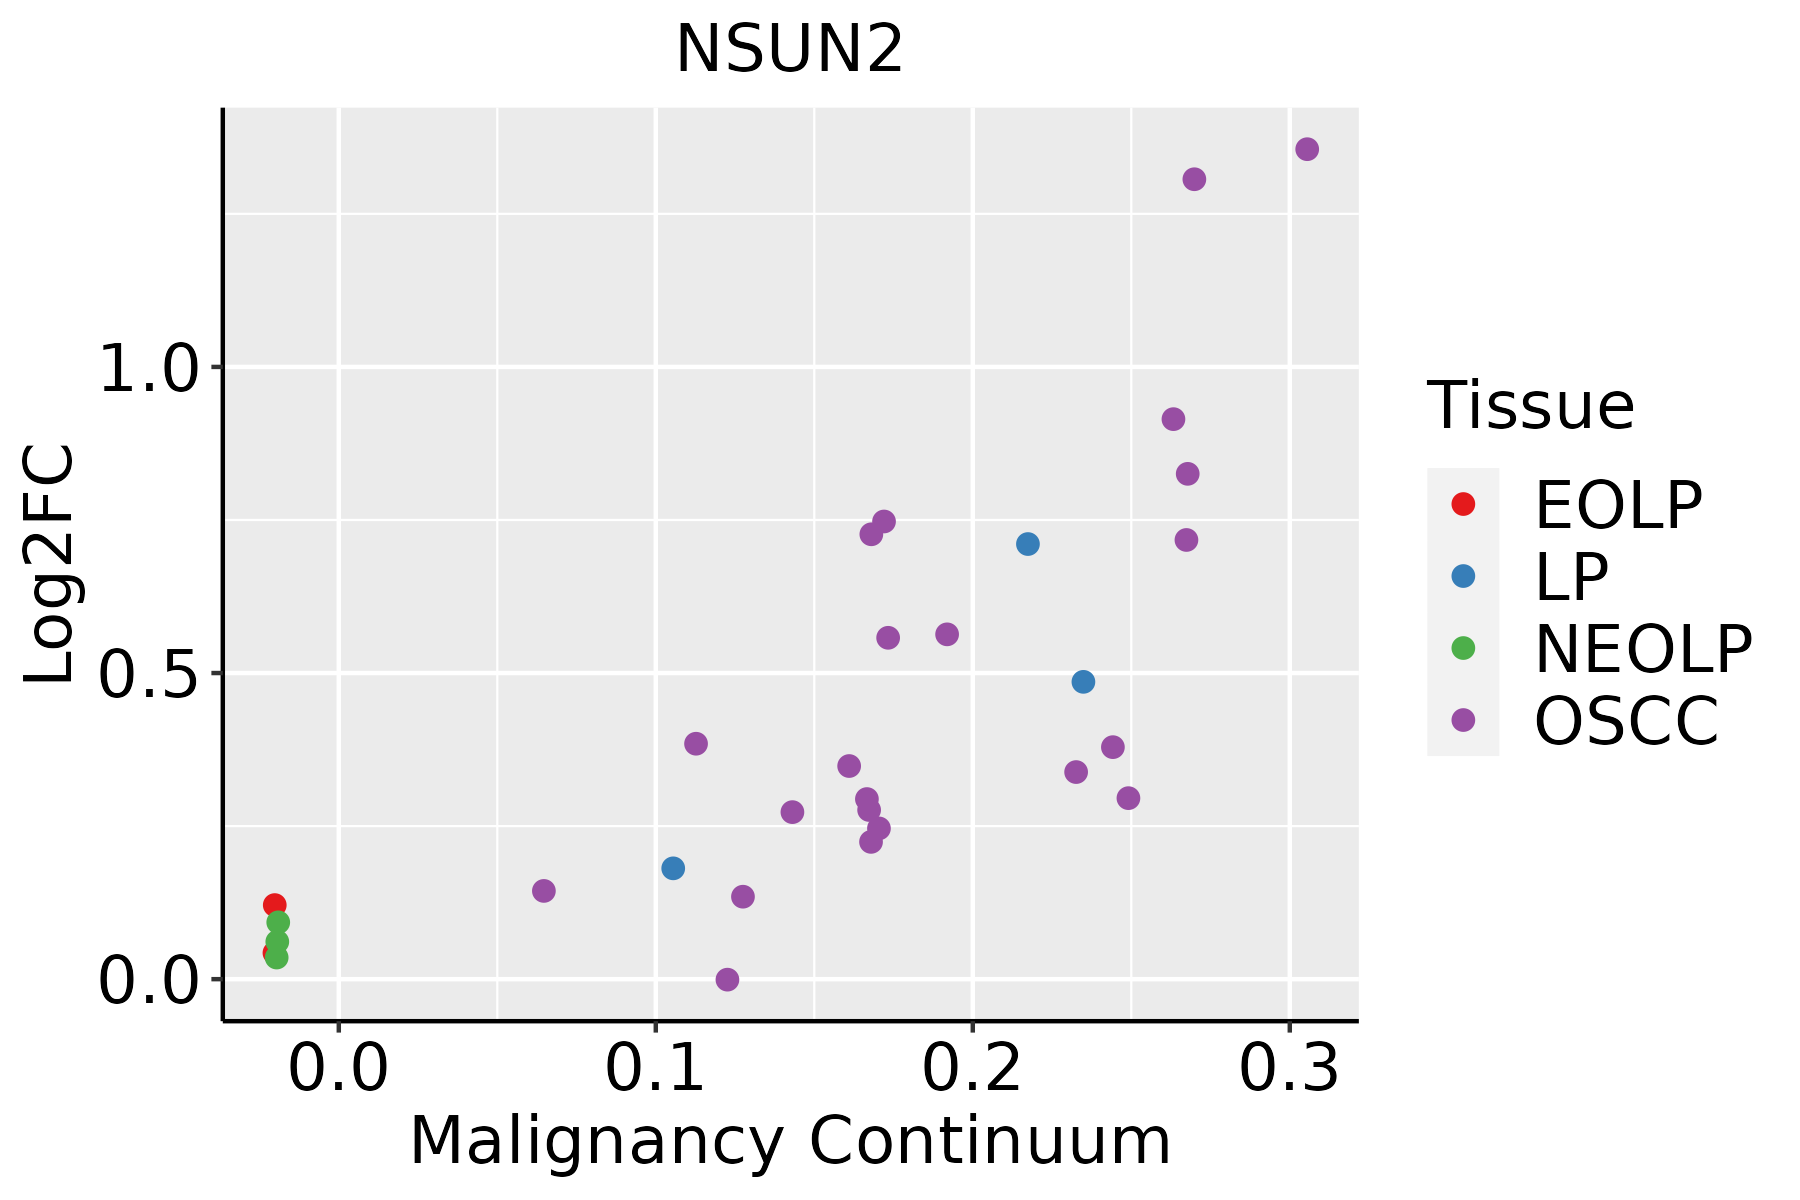
EOLP: Erosive Oral lichen planus
LP: leukoplakia
NEOLP: Non-erosive oral lichen planus
OSCC: Oral squamous cell carcinoma
SkinThe image shows the transcriptomic changes along malignancy continuum.log2FC in expression of this searched gene in stem-like cells from each diseased tissue sample relative to stem-like cells in normal samples in each tissue plotted against the malignancy continuum. Samples are colored based on if they are from different disease stage.
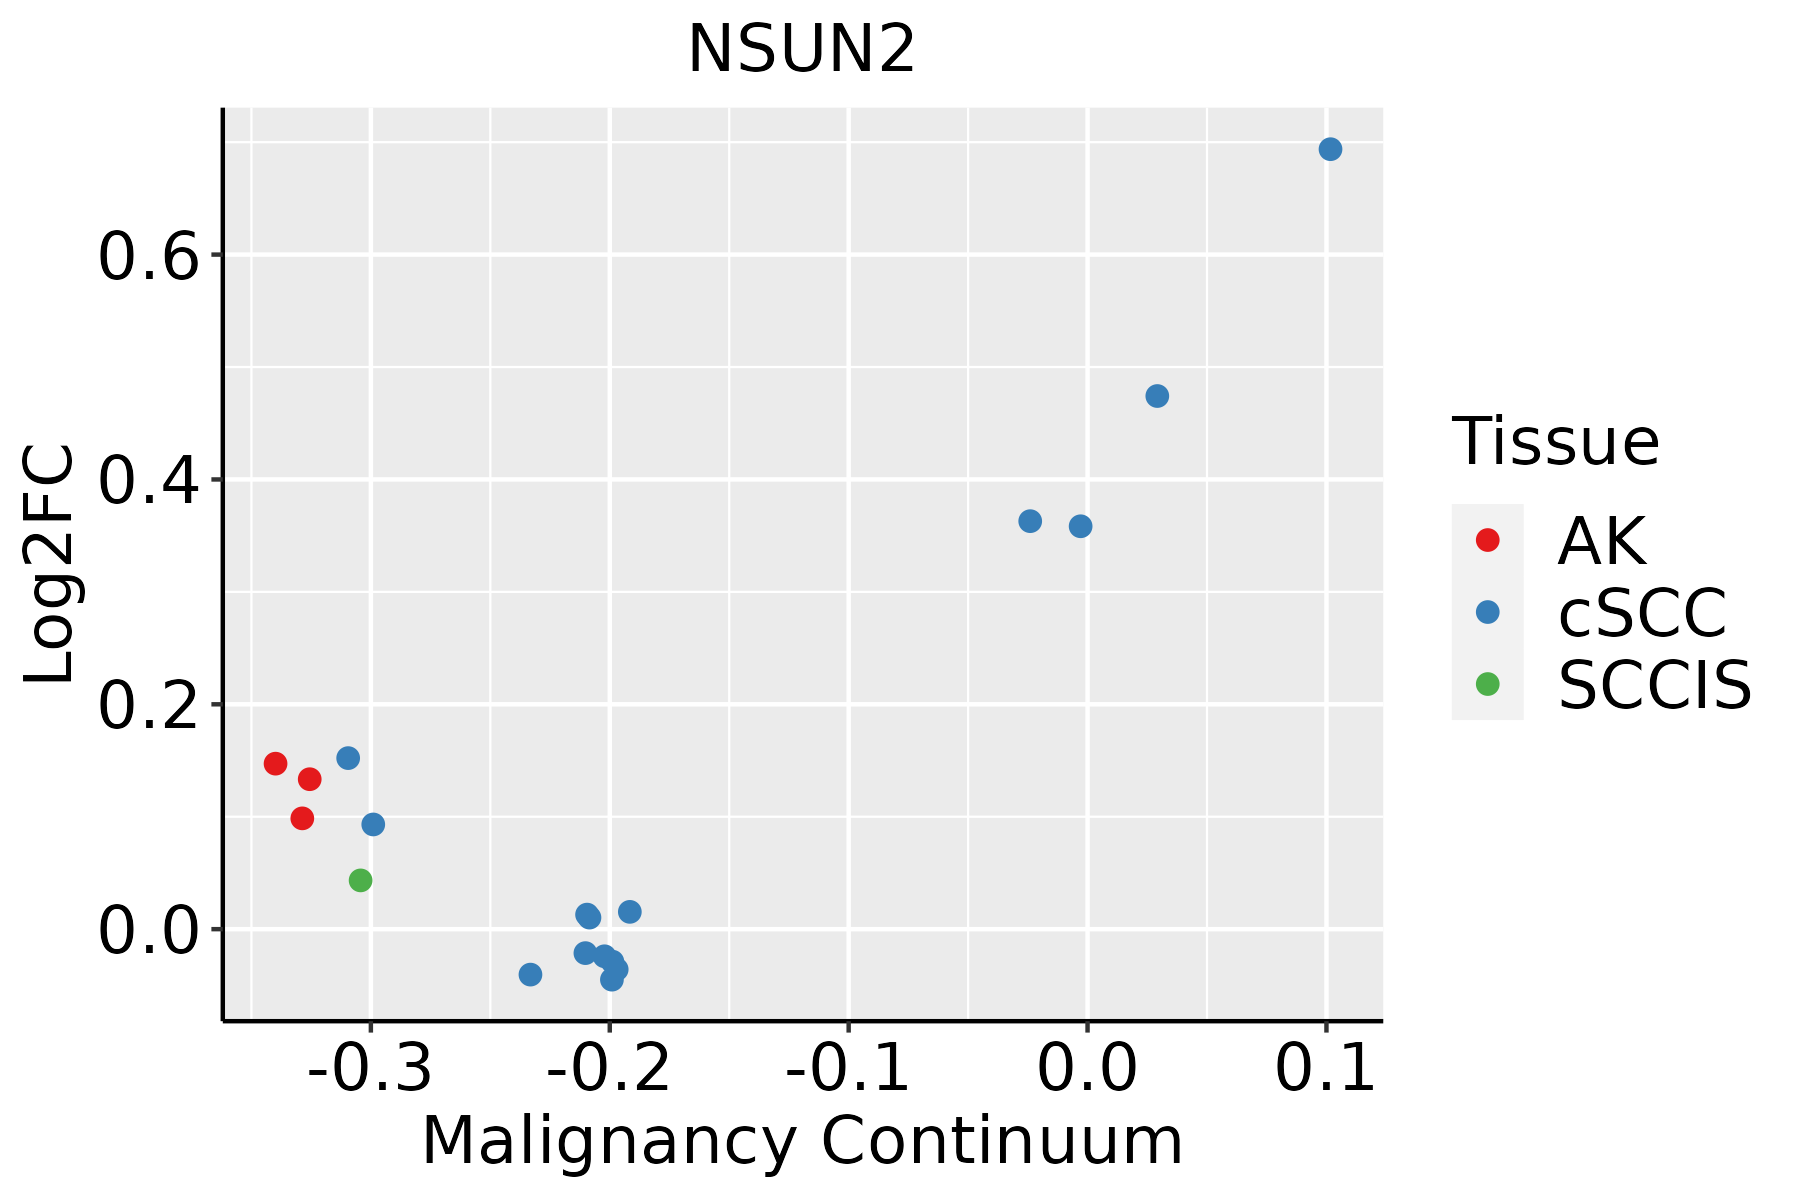
AK: Actinic keratosis
cSCC: Cutaneous squamous cell carcinoma
SCCIS:squamous cell carcinoma in situ
ThyroidThe image shows the transcriptomic changes along malignancy continuum.log2FC in expression of this searched gene in stem-like cells from each diseased tissue sample relative to stem-like cells in normal samples in each tissue plotted against the malignancy continuum. Samples are colored based on if they are from different disease stage.ATC: Anaplastic thyroid cancer
HT: Hashimoto's thyroiditis
PTC: Papillary thyroid cancer
∗log2FC in expression of this searched gene in stem-like cells from each diseased tissue sample relative to stem-like cells in normal samples in each tissue plotted against the malignancy continuum. Samples are colored based on if they are from different disease stage.

Top

Malignant transformation related pathway analysis

check buttonFind out the enriched GO biological processes and KEGG pathways involved in transition from healthy to precancer to cancer
check button Figure of enriched GO biological processes.
TissueDisease StageEnriched GO biological Processes
ColorectumADGO analysis - Figure of enriched GO biological processes: Top 15 enriched GO BP terms are showed in the bar plot of each disease state in each tissue. Each row represents a significant GO biological process which is colored according to the -log10(p.adjust).
ColorectumSERGO analysis - Figure of enriched GO biological processes: Top 15 enriched GO BP terms are showed in the bar plot of each disease state in each tissue. Each row represents a significant GO biological process which is colored according to the -log10(p.adjust).
ColorectumMSSGO analysis - Figure of enriched GO biological processes: Top 15 enriched GO BP terms are showed in the bar plot of each disease state in each tissue. Each row represents a significant GO biological process which is colored according to the -log10(p.adjust).
ColorectumMSI-HGO analysis - Figure of enriched GO biological processes: Top 15 enriched GO BP terms are showed in the bar plot of each disease state in each tissue. Each row represents a significant GO biological process which is colored according to the -log10(p.adjust).
ColorectumFAPGO analysis - Figure of enriched GO biological processes: Top 15 enriched GO BP terms are showed in the bar plot of each disease state in each tissue. Each row represents a significant GO biological process which is colored according to the -log10(p.adjust).
∗Top 15 enriched GO BP terms are showed in the bar plot of each disease state in each tissue. Each row represents a significant GO biological process which is colored according to the -log10(p.adjust).
Page: 1 2 3 4 5 6 7 8 9 

check button Enriched GO biological processes.
GO IDTissueDisease StageDescriptionGene RatioBg Ratiopvaluep.adjustCount
GO:0009895ColorectumADnegative regulation of catabolic process124/3918320/187231.66e-133.35e-11124
GO:0031330ColorectumADnegative regulation of cellular catabolic process104/3918262/187232.66e-123.96e-10104
GO:0006401ColorectumADRNA catabolic process102/3918278/187238.64e-106.76e-08102
GO:0044270ColorectumADcellular nitrogen compound catabolic process147/3918451/187233.35e-092.23e-07147
GO:0046700ColorectumADheterocycle catabolic process145/3918445/187234.37e-092.84e-07145
GO:0034655ColorectumADnucleobase-containing compound catabolic process133/3918407/187231.56e-089.12e-07133
GO:0019439ColorectumADaromatic compound catabolic process146/3918467/187237.48e-083.84e-06146
GO:1901361ColorectumADorganic cyclic compound catabolic process153/3918495/187238.23e-084.18e-06153
GO:0006913ColorectumADnucleocytoplasmic transport102/3918301/187231.00e-074.85e-06102
GO:0051169ColorectumADnuclear transport102/3918301/187231.00e-074.85e-06102
GO:0032386ColorectumADregulation of intracellular transport109/3918337/187235.33e-071.95e-05109
GO:0043487ColorectumADregulation of RNA stability63/3918170/187239.17e-073.12e-0563
GO:0006403ColorectumADRNA localization71/3918201/187231.54e-064.76e-0571
GO:0051236ColorectumADestablishment of RNA localization58/3918166/187231.95e-054.01e-0458
GO:0015931ColorectumADnucleobase-containing compound transport73/3918222/187232.02e-054.10e-0473
GO:0046822ColorectumADregulation of nucleocytoplasmic transport41/3918106/187232.17e-054.33e-0441
GO:0050657ColorectumADnucleic acid transport57/3918163/187232.22e-054.39e-0457
GO:0050658ColorectumADRNA transport57/3918163/187232.22e-054.39e-0457
GO:0001701ColorectumADin utero embryonic development110/3918367/187232.36e-054.62e-04110
GO:0051168ColorectumADnuclear export53/3918154/187236.89e-051.11e-0353
Page: 1 2 3 4 5 6 7 8 9 10 11 12 13 14 15 16 17 18 19 20 21 22 23 24 25 

check button Enriched KEGG pathways.
Pathway IDTissueDisease StageDescriptionGene RatioBg Ratiopvaluep.adjustqvalueCount
Page: 1 

Top

Cell-cell communication analysis

check buttonIdentification of potential cell-cell interactions between two cell types and their ligand-receptor pairs for different disease states
LigandReceptorLRpairPathwayTissueDisease Stage
Page: 1 

Top

Single-cell gene regulatory network inference analysis

check buttonFind out the significant the regulons (TFs) and the target genes of each regulon across cell types for different disease states
TFCell TypeTissueDisease StageTarget GeneRSSRegulon Activity
∗The dot plots of a searched regulon are shown for all cell subpopulations in each disease state of each tissue based on the regulon specific score inferred using pySCENIC and by calculating the average expression.
Page: 1 

Top

Somatic mutation of malignant transformation related genes

check buttonAnnotation of somatic variants for genes involved in malignant transformation
Hugo SymbolVariant ClassVariant ClassificationdbSNP RSHGVScHGVSpHGVSp ShortSWISSPROTBIOTYPESIFTPolyPhenTumor Sample BarcodeTissueHistologySexAgeStageTherapy TypesDrugsOutcome
NSUN2SNVMissense_Mutationc.1876N>Ap.Asp626Asnp.D626NQ08J23protein_codingdeleterious(0)probably_damaging(0.998)TCGA-A2-A0CR-01Breastbreast invasive carcinomaFemale<65I/IIChemotherapyadriamycinCR
NSUN2SNVMissense_Mutationrs745927756c.658N>Tp.Arg220Cysp.R220CQ08J23protein_codingdeleterious(0)probably_damaging(1)TCGA-AN-A046-01Breastbreast invasive carcinomaFemale>=65I/IIUnknownUnknownSD
NSUN2SNVMissense_Mutationnovelc.2117N>Gp.Val706Glyp.V706GQ08J23protein_codingdeleterious(0.01)benign(0.141)TCGA-AO-A1KP-01Breastbreast invasive carcinomaFemale>=65I/IIChemotherapyfluorouracilSD
NSUN2SNVMissense_Mutationrs759251595c.2008N>Tp.Ala670Serp.A670SQ08J23protein_codingtolerated(0.76)benign(0.02)TCGA-E9-A2JS-01Breastbreast invasive carcinomaFemale>=65I/IIChemotherapycyclophosphamidePD
NSUN2insertionNonsense_Mutationnovelc.1617_1618insTTTCATCTTATTTTTTTACTTACAGGTTATTAACACAp.Asp540PhefsTer11p.D540Ffs*11Q08J23protein_codingTCGA-AO-A0J5-01Breastbreast invasive carcinomaFemale<65III/IVOther, specify in notesBisphosphonatezoledronicPD
NSUN2deletionFrame_Shift_Delnovelc.403delNp.Ile135SerfsTer2p.I135Sfs*2Q08J23protein_codingTCGA-D8-A27V-01Breastbreast invasive carcinomaFemale<65I/IIHormone TherapytamoxiphenSD
NSUN2SNVMissense_Mutationrs746142475c.2167G>Ap.Ala723Thrp.A723TQ08J23protein_codingtolerated(0.19)benign(0.003)TCGA-2W-A8YY-01Cervixcervical & endocervical cancerFemale<65I/IIChemotherapycisplatinCR
NSUN2SNVMissense_Mutationnovelc.259G>Ap.Ala87Thrp.A87TQ08J23protein_codingdeleterious(0.04)possibly_damaging(0.616)TCGA-2W-A8YY-01Cervixcervical & endocervical cancerFemale<65I/IIChemotherapycisplatinCR
NSUN2SNVMissense_Mutationc.178N>Ap.Glu60Lysp.E60KQ08J23protein_codingdeleterious(0.01)benign(0.091)TCGA-C5-A1BQ-01Cervixcervical & endocervical cancerFemale>=65III/IVChemotherapycisplatinCR
NSUN2SNVMissense_Mutationnovelc.2001N>Gp.Asn667Lysp.N667KQ08J23protein_codingtolerated(0.93)benign(0)TCGA-VS-A8EK-01Cervixcervical & endocervical cancerFemale>=65I/IIChemotherapycisplatinPD
Page: 1 2 3 4 5 6 7 8 9 10 

Top

Related drugs of malignant transformation related genes

check buttonIdentification of chemicals and drugs interact with genes involved in malignant transfromation
(DGIdb 4.0)
Entrez IDSymbolCategoryInteraction TypesDrug Claim NameDrug NamePMIDs
Page: 1