| Tissue | Expression Dynamics | Abbreviation |
| Cervix | 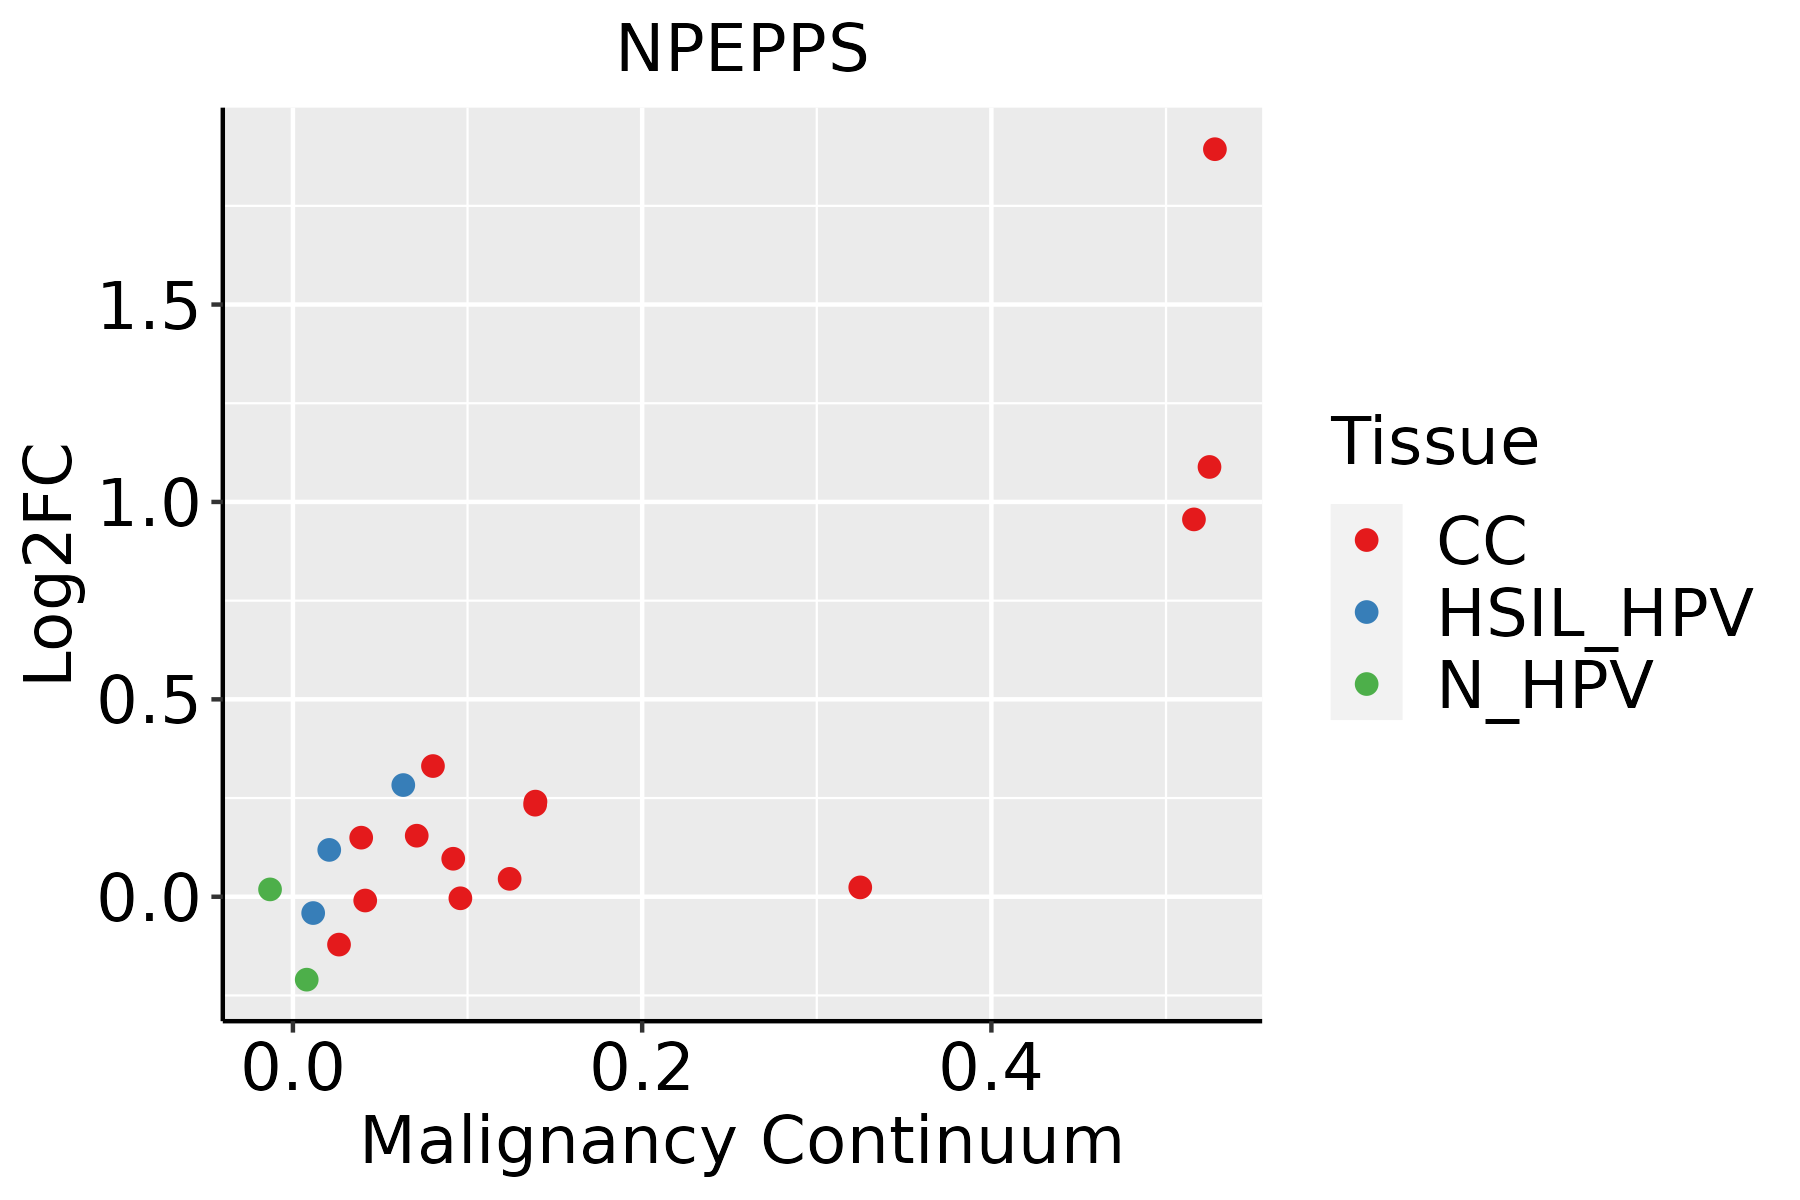 | CC: Cervix cancer |
| HSIL_HPV: HPV-infected high-grade squamous intraepithelial lesions |
| N_HPV: HPV-infected normal cervix |
| Colorectum (GSE201348) |  | FAP: Familial adenomatous polyposis |
| CRC: Colorectal cancer |
| Colorectum (HTA11) |  | AD: Adenomas |
| SER: Sessile serrated lesions |
| MSI-H: Microsatellite-high colorectal cancer |
| MSS: Microsatellite stable colorectal cancer |
| Esophagus | 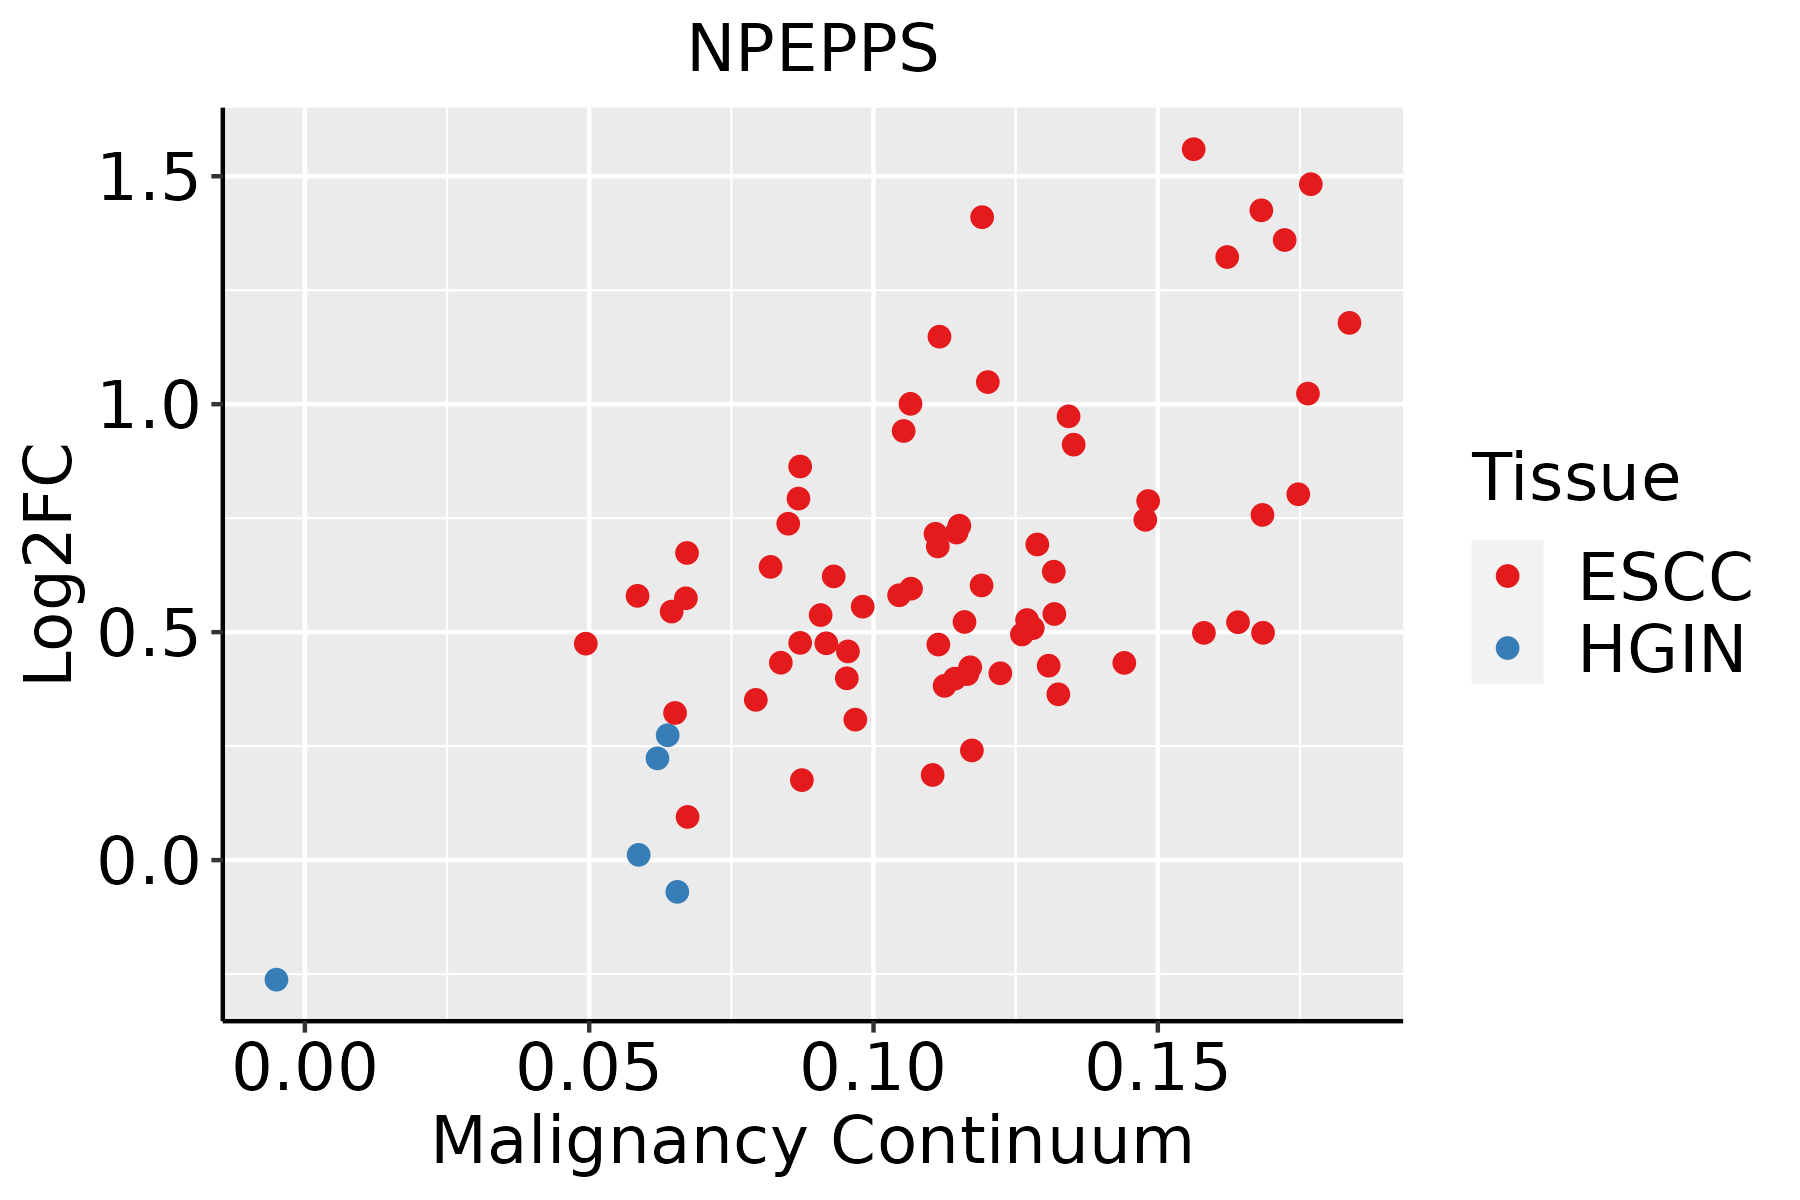 | ESCC: Esophageal squamous cell carcinoma |
| HGIN: High-grade intraepithelial neoplasias |
| LGIN: Low-grade intraepithelial neoplasias |
| Liver | 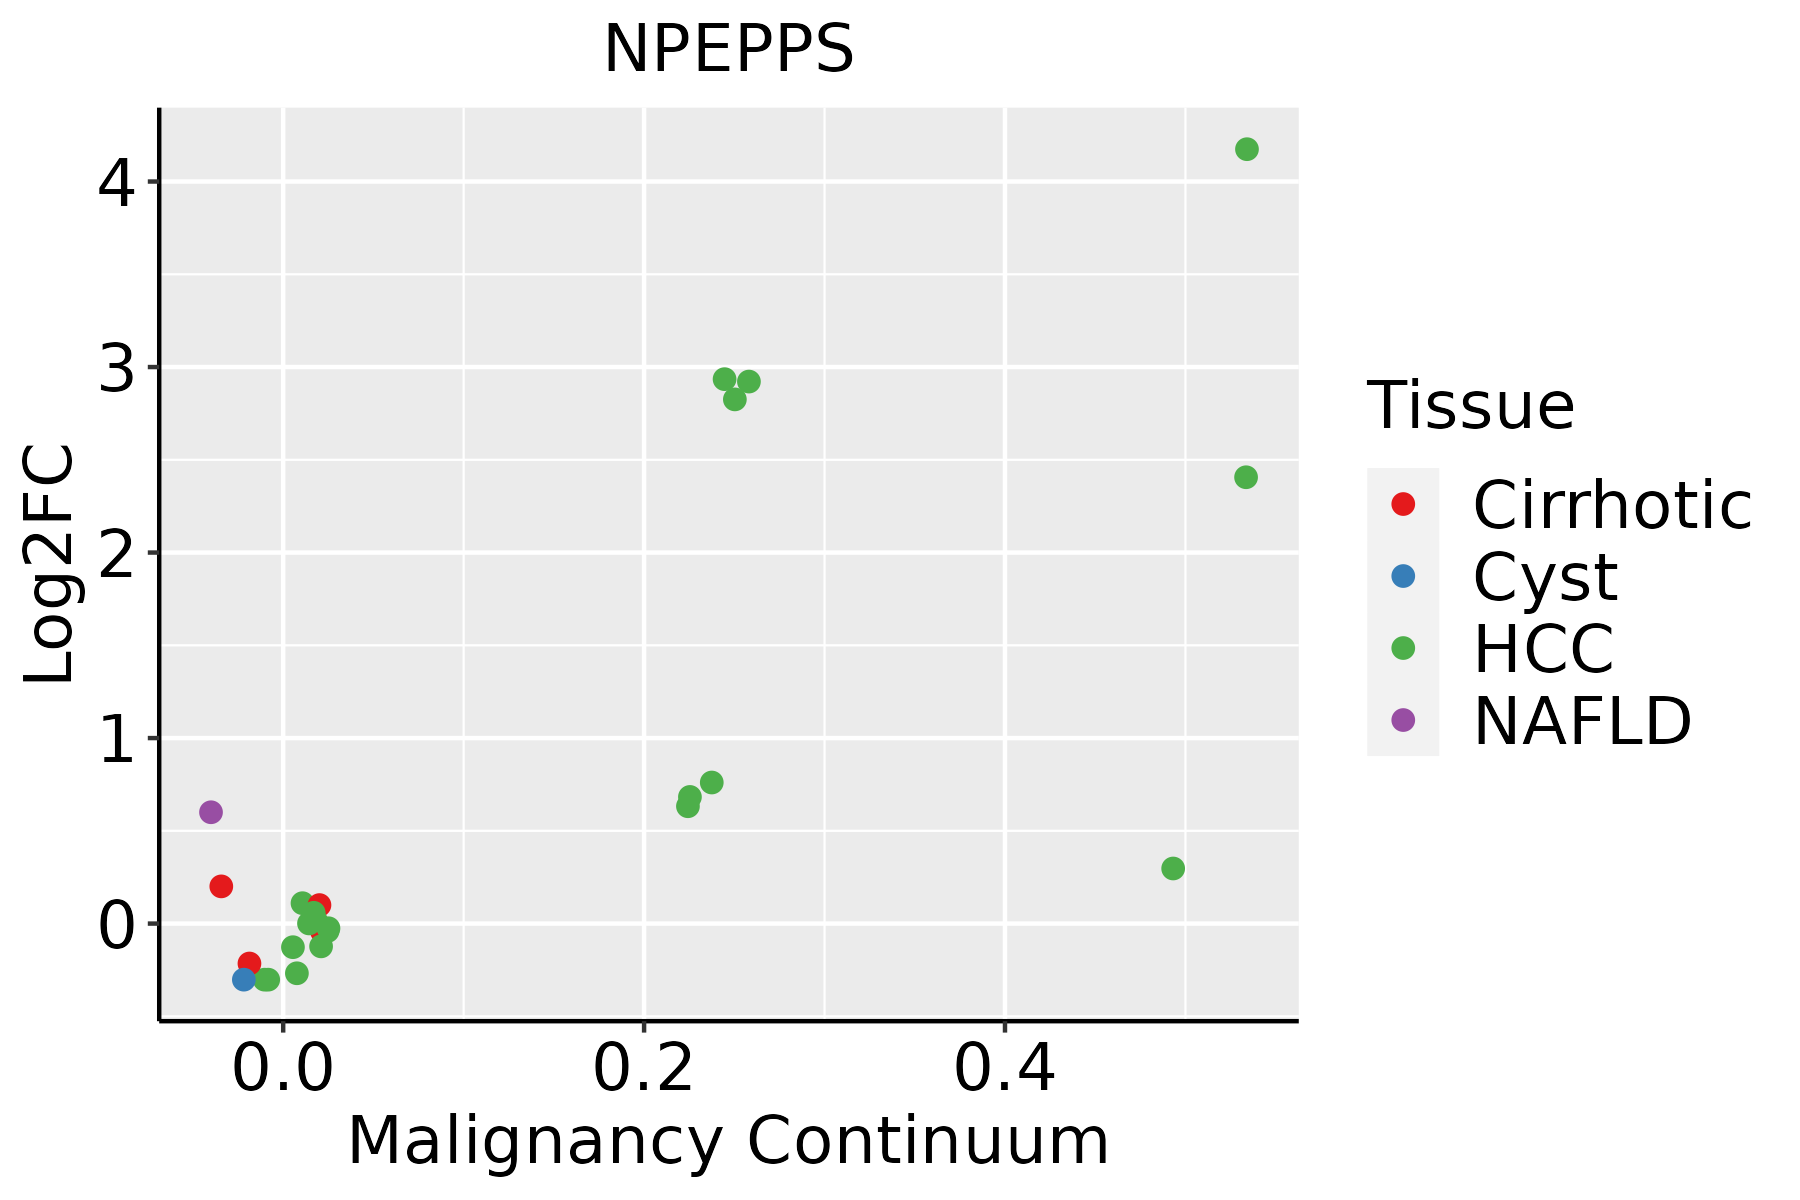 | HCC: Hepatocellular carcinoma |
| NAFLD: Non-alcoholic fatty liver disease |
| Lung |  | AAH: Atypical adenomatous hyperplasia |
| AIS: Adenocarcinoma in situ |
| IAC: Invasive lung adenocarcinoma |
| MIA: Minimally invasive adenocarcinoma |
| Oral Cavity |  | EOLP: Erosive Oral lichen planus |
| LP: leukoplakia |
| NEOLP: Non-erosive oral lichen planus |
| OSCC: Oral squamous cell carcinoma |
| Skin | 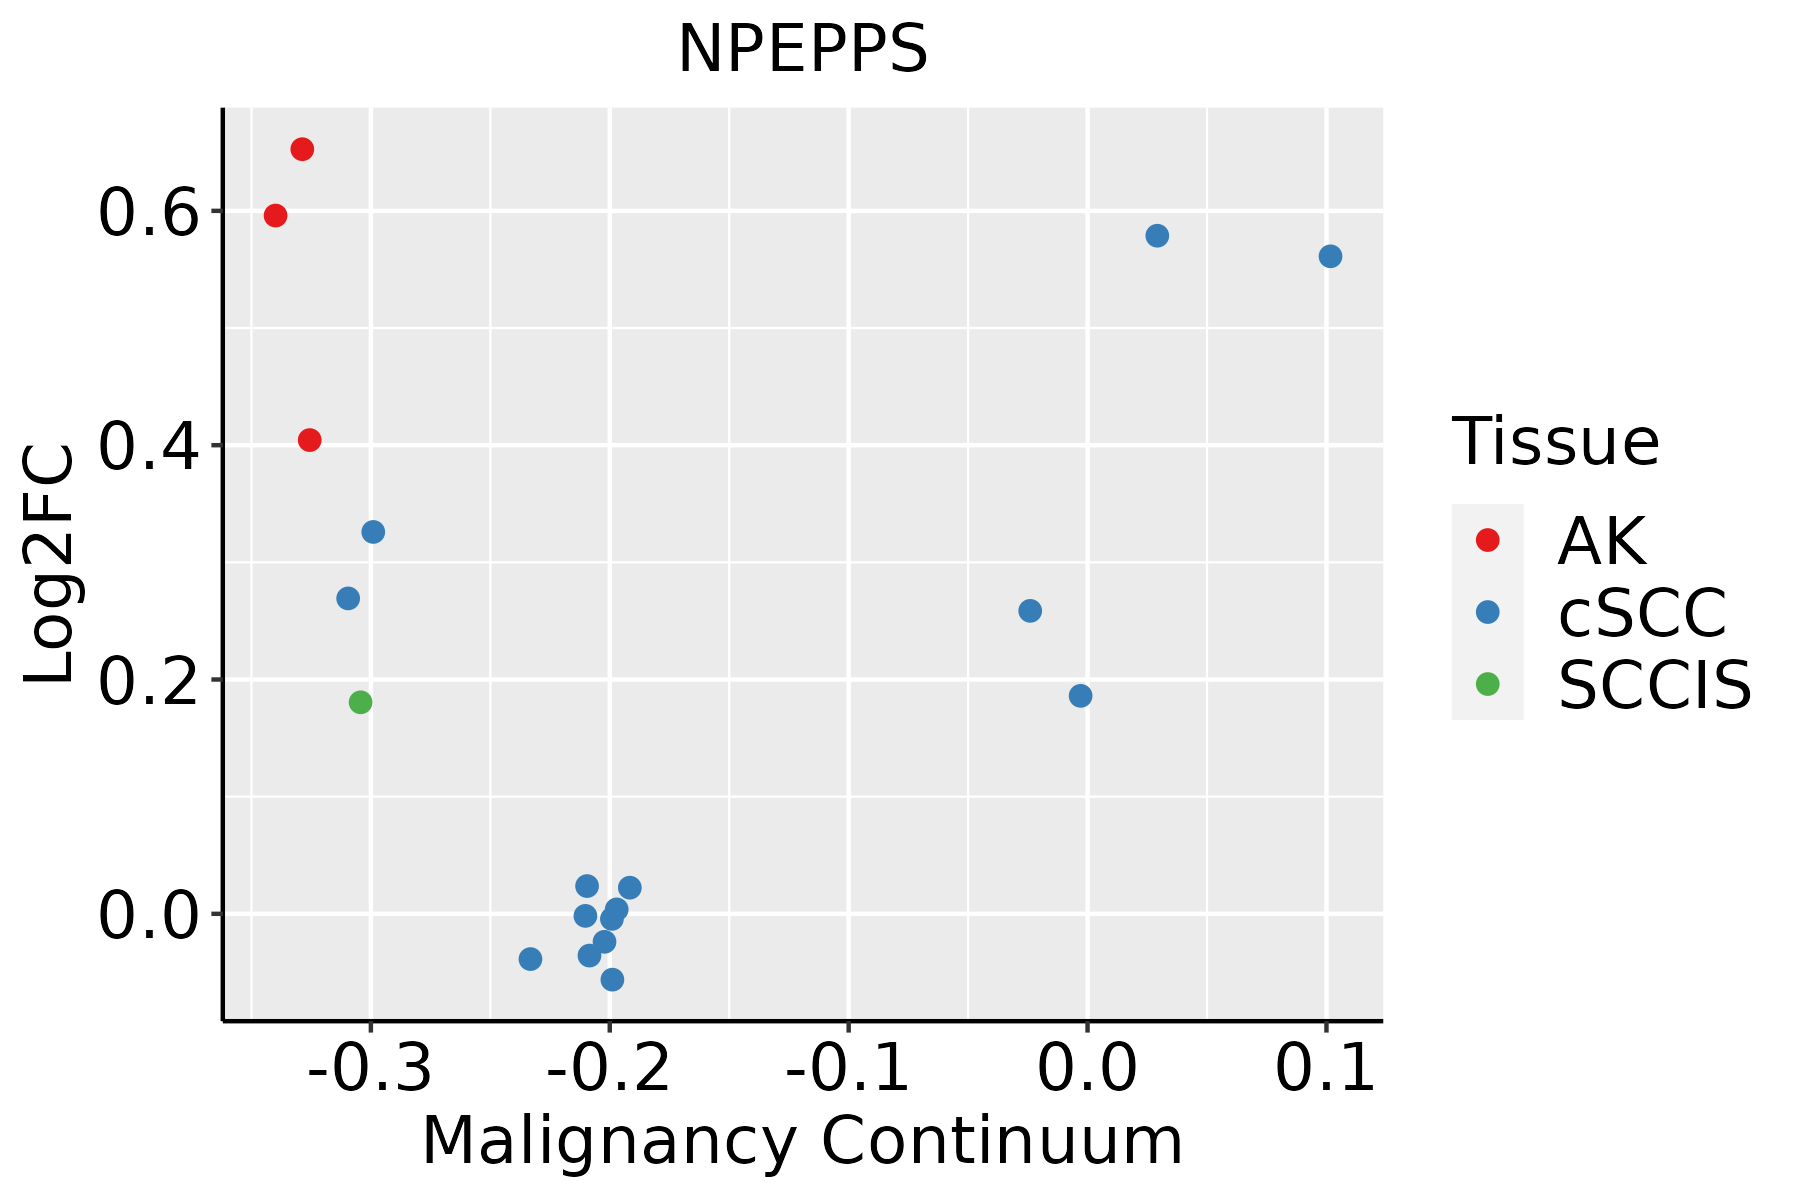 | AK: Actinic keratosis |
| cSCC: Cutaneous squamous cell carcinoma |
| SCCIS:squamous cell carcinoma in situ |
| Thyroid |  | ATC: Anaplastic thyroid cancer |
| HT: Hashimoto's thyroiditis |
| PTC: Papillary thyroid cancer |
| GO ID | Tissue | Disease Stage | Description | Gene Ratio | Bg Ratio | pvalue | p.adjust | Count |
| GO:00725949 | Cervix | CC | establishment of protein localization to organelle | 99/2311 | 422/18723 | 1.23e-10 | 2.11e-08 | 99 |
| GO:190382910 | Cervix | CC | positive regulation of cellular protein localization | 72/2311 | 276/18723 | 3.20e-10 | 4.46e-08 | 72 |
| GO:005122210 | Cervix | CC | positive regulation of protein transport | 72/2311 | 303/18723 | 2.36e-08 | 1.70e-06 | 72 |
| GO:190495110 | Cervix | CC | positive regulation of establishment of protein localization | 73/2311 | 319/18723 | 9.69e-08 | 5.25e-06 | 73 |
| GO:00002097 | Cervix | CC | protein polyubiquitination | 58/2311 | 236/18723 | 1.57e-07 | 7.41e-06 | 58 |
| GO:00068399 | Cervix | CC | mitochondrial transport | 60/2311 | 254/18723 | 4.21e-07 | 1.67e-05 | 60 |
| GO:000660510 | Cervix | CC | protein targeting | 68/2311 | 314/18723 | 2.17e-06 | 6.55e-05 | 68 |
| GO:00903167 | Cervix | CC | positive regulation of intracellular protein transport | 41/2311 | 160/18723 | 3.24e-06 | 8.80e-05 | 41 |
| GO:00323868 | Cervix | CC | regulation of intracellular transport | 71/2311 | 337/18723 | 3.70e-06 | 9.74e-05 | 71 |
| GO:00331579 | Cervix | CC | regulation of intracellular protein transport | 52/2311 | 229/18723 | 8.16e-06 | 1.88e-04 | 52 |
| GO:00705859 | Cervix | CC | protein localization to mitochondrion | 33/2311 | 125/18723 | 1.46e-05 | 2.90e-04 | 33 |
| GO:00323889 | Cervix | CC | positive regulation of intracellular transport | 46/2311 | 202/18723 | 2.45e-05 | 4.24e-04 | 46 |
| GO:00726559 | Cervix | CC | establishment of protein localization to mitochondrion | 31/2311 | 120/18723 | 4.13e-05 | 6.36e-04 | 31 |
| GO:000166610 | Cervix | CC | response to hypoxia | 61/2311 | 307/18723 | 1.04e-04 | 1.34e-03 | 61 |
| GO:007048210 | Cervix | CC | response to oxygen levels | 67/2311 | 347/18723 | 1.21e-04 | 1.51e-03 | 67 |
| GO:003629310 | Cervix | CC | response to decreased oxygen levels | 62/2311 | 322/18723 | 2.29e-04 | 2.57e-03 | 62 |
| GO:00066269 | Cervix | CC | protein targeting to mitochondrion | 25/2311 | 100/18723 | 3.80e-04 | 3.89e-03 | 25 |
| GO:00714539 | Cervix | CC | cellular response to oxygen levels | 38/2311 | 177/18723 | 4.23e-04 | 4.27e-03 | 38 |
| GO:00362949 | Cervix | CC | cellular response to decreased oxygen levels | 35/2311 | 161/18723 | 5.49e-04 | 5.29e-03 | 35 |
| GO:00714566 | Cervix | CC | cellular response to hypoxia | 33/2311 | 151/18723 | 7.06e-04 | 6.41e-03 | 33 |
| Hugo Symbol | Variant Class | Variant Classification | dbSNP RS | HGVSc | HGVSp | HGVSp Short | SWISSPROT | BIOTYPE | SIFT | PolyPhen | Tumor Sample Barcode | Tissue | Histology | Sex | Age | Stage | Therapy Types | Drugs | Outcome |
| NPEPPS | SNV | Missense_Mutation | | c.1013C>G | p.Ser338Cys | p.S338C | P55786 | protein_coding | deleterious(0) | probably_damaging(0.992) | TCGA-A2-A0SY-01 | Breast | breast invasive carcinoma | Female | <65 | III/IV | Hormone Therapy | arimidex | SD |
| NPEPPS | SNV | Missense_Mutation | | c.2219N>T | p.Ser740Phe | p.S740F | P55786 | protein_coding | deleterious(0) | possibly_damaging(0.726) | TCGA-AC-A23H-01 | Breast | breast invasive carcinoma | Female | >=65 | I/II | Unknown | Unknown | PD |
| NPEPPS | SNV | Missense_Mutation | | c.2227C>G | p.Leu743Val | p.L743V | P55786 | protein_coding | deleterious(0) | possibly_damaging(0.629) | TCGA-C8-A27B-01 | Breast | breast invasive carcinoma | Female | <65 | I/II | Chemotherapy | 5-fluorouracil | CR |
| NPEPPS | deletion | Frame_Shift_Del | novel | c.1864delC | p.Leu622SerfsTer13 | p.L622Sfs*13 | P55786 | protein_coding | | | TCGA-EW-A2FV-01 | Breast | breast invasive carcinoma | Female | <65 | III/IV | Chemotherapy | docetaxel | SD |
| NPEPPS | SNV | Missense_Mutation | rs748154171 | c.2432N>T | p.Ser811Leu | p.S811L | P55786 | protein_coding | tolerated(0.19) | benign(0.028) | TCGA-C5-A2LZ-01 | Cervix | cervical & endocervical cancer | Female | >=65 | III/IV | Unknown | Unknown | PD |
| NPEPPS | SNV | Missense_Mutation | | c.769N>A | p.Glu257Lys | p.E257K | P55786 | protein_coding | deleterious(0.03) | possibly_damaging(0.457) | TCGA-C5-A7UH-01 | Cervix | cervical & endocervical cancer | Female | <65 | III/IV | Chemotherapy | cisplatin | SD |
| NPEPPS | SNV | Missense_Mutation | | c.916N>C | p.Asp306His | p.D306H | P55786 | protein_coding | deleterious(0) | probably_damaging(1) | TCGA-C5-A7UH-01 | Cervix | cervical & endocervical cancer | Female | <65 | III/IV | Chemotherapy | cisplatin | SD |
| NPEPPS | SNV | Missense_Mutation | novel | c.1705N>T | p.Val569Phe | p.V569F | P55786 | protein_coding | tolerated(0.14) | benign(0.015) | TCGA-EA-A3HU-01 | Cervix | cervical & endocervical cancer | Female | <65 | I/II | Unknown | Unknown | SD |
| NPEPPS | SNV | Missense_Mutation | rs746589578 | c.153C>G | p.Phe51Leu | p.F51L | P55786 | protein_coding | deleterious(0.01) | benign(0.424) | TCGA-EK-A3GK-01 | Cervix | cervical & endocervical cancer | Female | <65 | I/II | Unknown | Unknown | SD |
| NPEPPS | SNV | Missense_Mutation | | c.95C>T | p.Ser32Phe | p.S32F | P55786 | protein_coding | deleterious_low_confidence(0.04) | benign(0) | TCGA-MU-A51Y-01 | Cervix | cervical & endocervical cancer | Female | <65 | I/II | Unknown | Unknown | SD |


