Schematic overview of the cellular and molecular mechanisms involved in the cancer progression, including the proposed cellular and molecular mechanisms in cancer cells trajectory. AT1: alveolar type 1 cells; AT2: alveolar type 2 cells; AAH: atypical adenomatous hyperplasia; AIS: adenocarcinoma in situ; MIA: minimally invasive adenocarcinoma; IA: invasive adenocarcinoma; EMT: epithelial-mesenchymal transition

Home

Download

Statistics

Help

Contact

Center for Computational Systems Medicine
leaf

Gene summary

leaf

Malignant transformation analysis

leaf

Malignant transformation related pathway analysis

leaf

Cell-cell communication analysis

leaf

Single-cell gene regulatory network inference analysis

leaf

Somatic mutation of malignant transformation related genes

leaf

Related drugs of malignant transformation related genes

Gene: NMB

Gene summary for NMB

check button Gene summary.

Gene informationSpeciesHuman
Gene symbol

NMB

Gene ID

4828

Gene nameneuromedin B
Gene AliasNMB
Cytomap15q25.2
Gene Typeprotein-coding
GO ID

GO:0006810

UniProtAcc

P08949


Top

Malignant transformation analysis

check button Identification of the aberrant gene expression in precancerous and cancerous lesions by comparing the gene expression of stem-like cells in diseased tissues with normal stem cells
check button Malignant transformation involving gene list.
Entrez IDSymbolReplicatesSpeciesOrganTissueAdj P-valueLog2FCMalignancy
4828NMBLN46HumanOral cavityOSCC1.35e-126.78e-010.1666
4828NMBLP15HumanOral cavityLP8.33e-111.79e+000.2174
4828NMBLP17HumanOral cavityLP6.69e-101.31e+000.2349
4828NMBSYSMH1HumanOral cavityOSCC1.89e-711.47e+000.1127
4828NMBSYSMH2HumanOral cavityOSCC3.67e-209.27e-010.2326
4828NMBSYSMH3HumanOral cavityOSCC1.08e-164.93e-010.2442
4828NMBSYSMH5HumanOral cavityOSCC8.69e-061.32e-010.0647
4828NMBP10_cSCCHumanSkincSCC6.23e-106.84e-010.1017
4828NMBmale-WTAHumanThyroidPTC2.99e-252.99e-010.1037
4828NMBPTC01HumanThyroidPTC1.22e-155.81e-010.1899
4828NMBPTC04HumanThyroidPTC8.01e-201.17e+000.1927
4828NMBPTC05HumanThyroidPTC3.79e-282.03e+000.2065
4828NMBPTC06HumanThyroidPTC1.81e-482.10e+000.2057
4828NMBPTC07HumanThyroidPTC2.29e-802.00e+000.2044
4828NMBATC11HumanThyroidATC2.02e-038.84e-020.3386
4828NMBATC12HumanThyroidATC8.13e-052.83e-010.34
4828NMBATC3HumanThyroidATC3.01e-021.76e-020.338
4828NMBATC4HumanThyroidATC1.72e-104.34e-010.34
Page: 1 2 3 4 5 

check button Transcriptomic changes along malignancy continuum.
TissueExpression DynamicsAbbreviation
EsophagusThe image shows the transcriptomic changes along malignancy continuum.log2FC in expression of this searched gene in stem-like cells from each diseased tissue sample relative to stem-like cells in normal samples in each tissue plotted against the malignancy continuum. Samples are colored based on if they are from different disease stage.
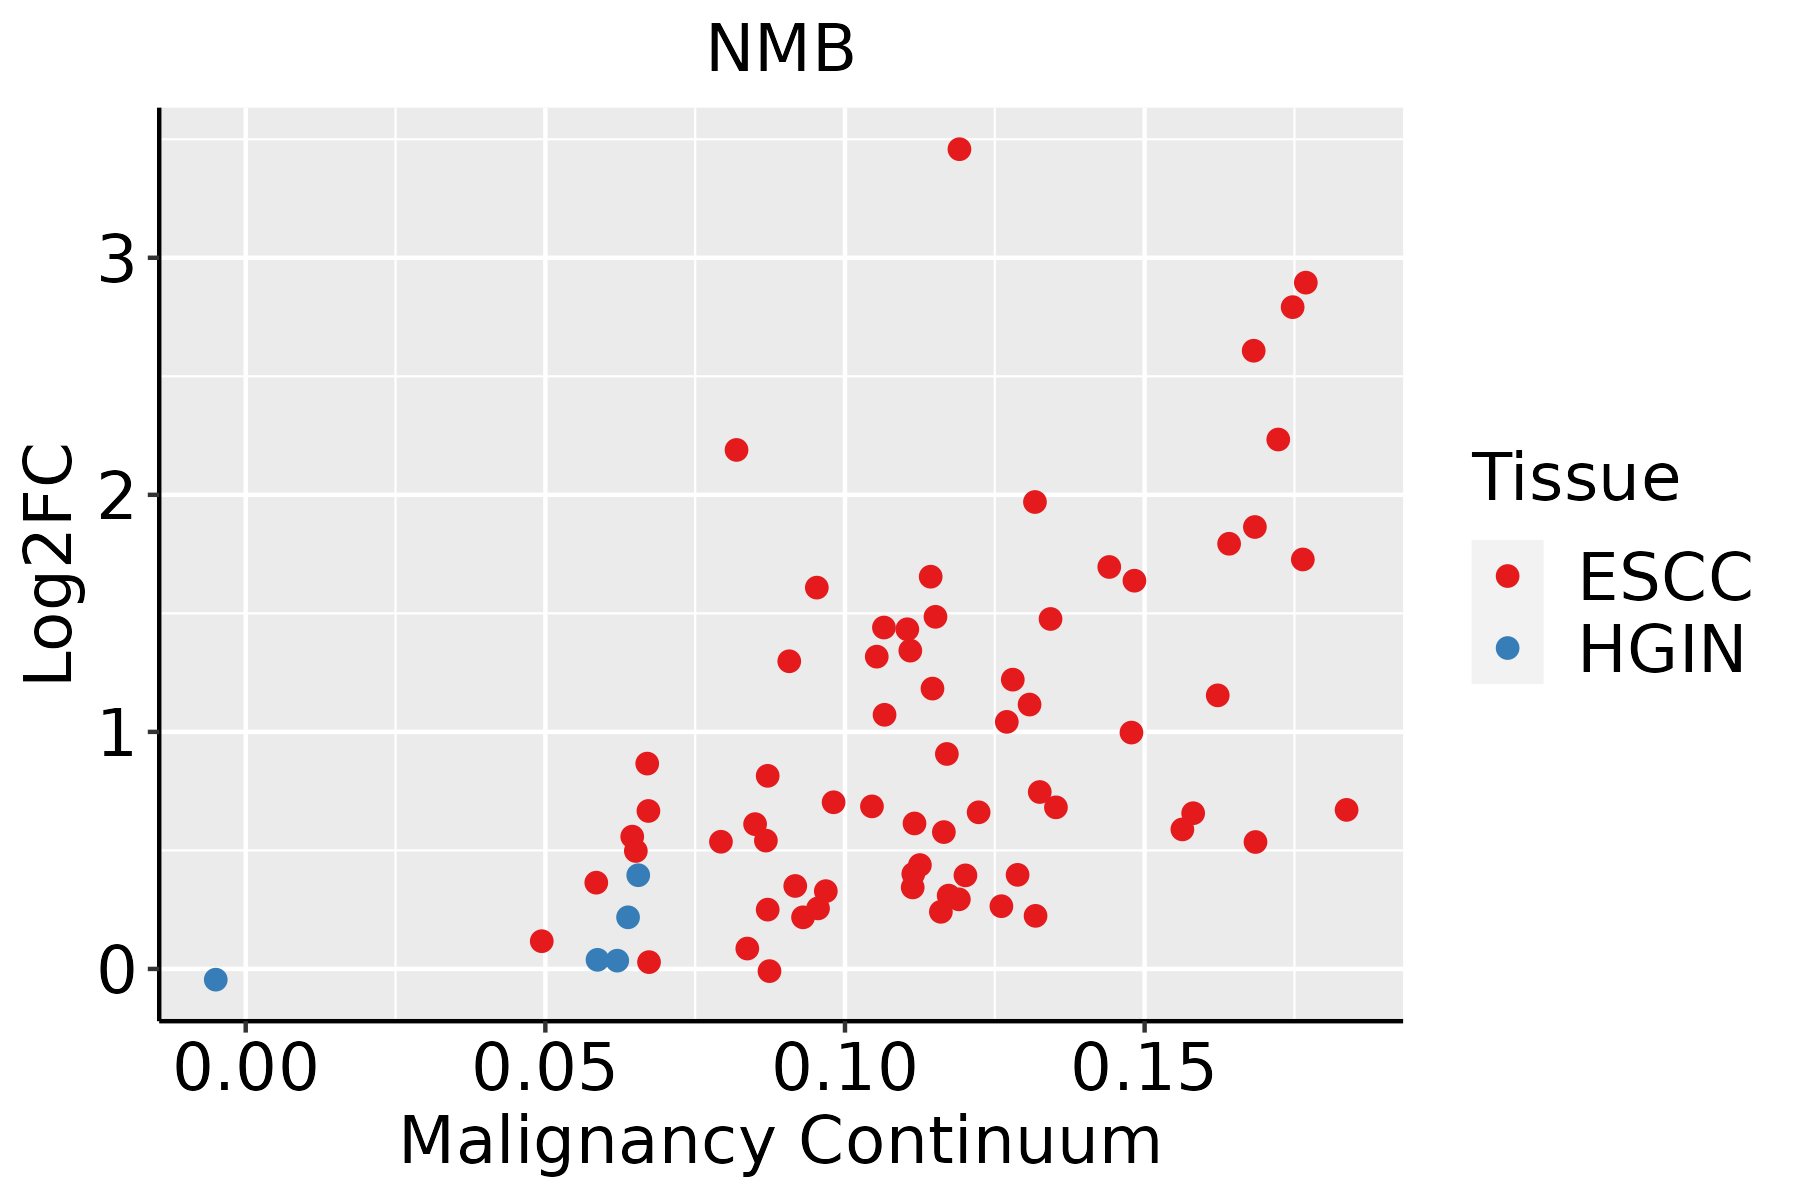
ESCC: Esophageal squamous cell carcinoma
HGIN: High-grade intraepithelial neoplasias
LGIN: Low-grade intraepithelial neoplasias
LiverThe image shows the transcriptomic changes along malignancy continuum.log2FC in expression of this searched gene in stem-like cells from each diseased tissue sample relative to stem-like cells in normal samples in each tissue plotted against the malignancy continuum. Samples are colored based on if they are from different disease stage.
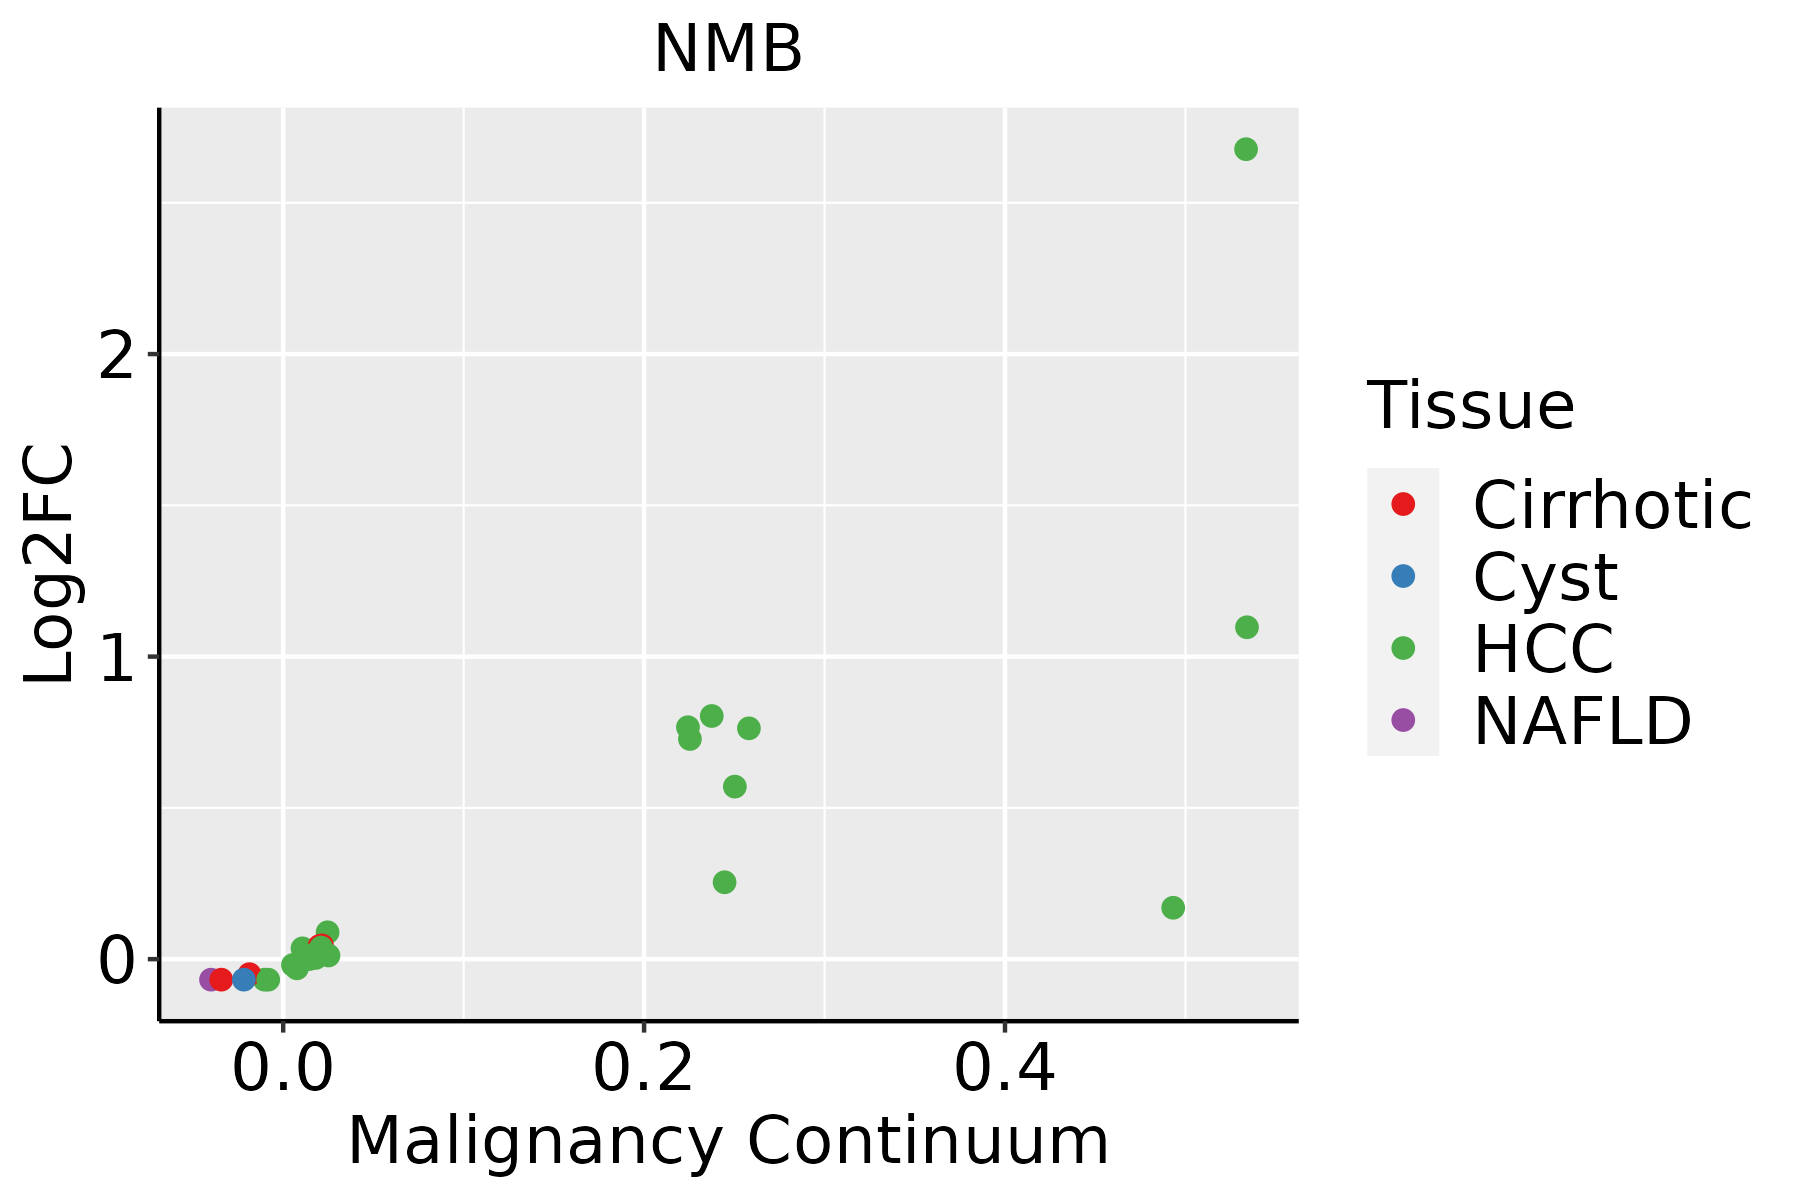
HCC: Hepatocellular carcinoma
NAFLD: Non-alcoholic fatty liver disease
Oral CavityThe image shows the transcriptomic changes along malignancy continuum.log2FC in expression of this searched gene in stem-like cells from each diseased tissue sample relative to stem-like cells in normal samples in each tissue plotted against the malignancy continuum. Samples are colored based on if they are from different disease stage.
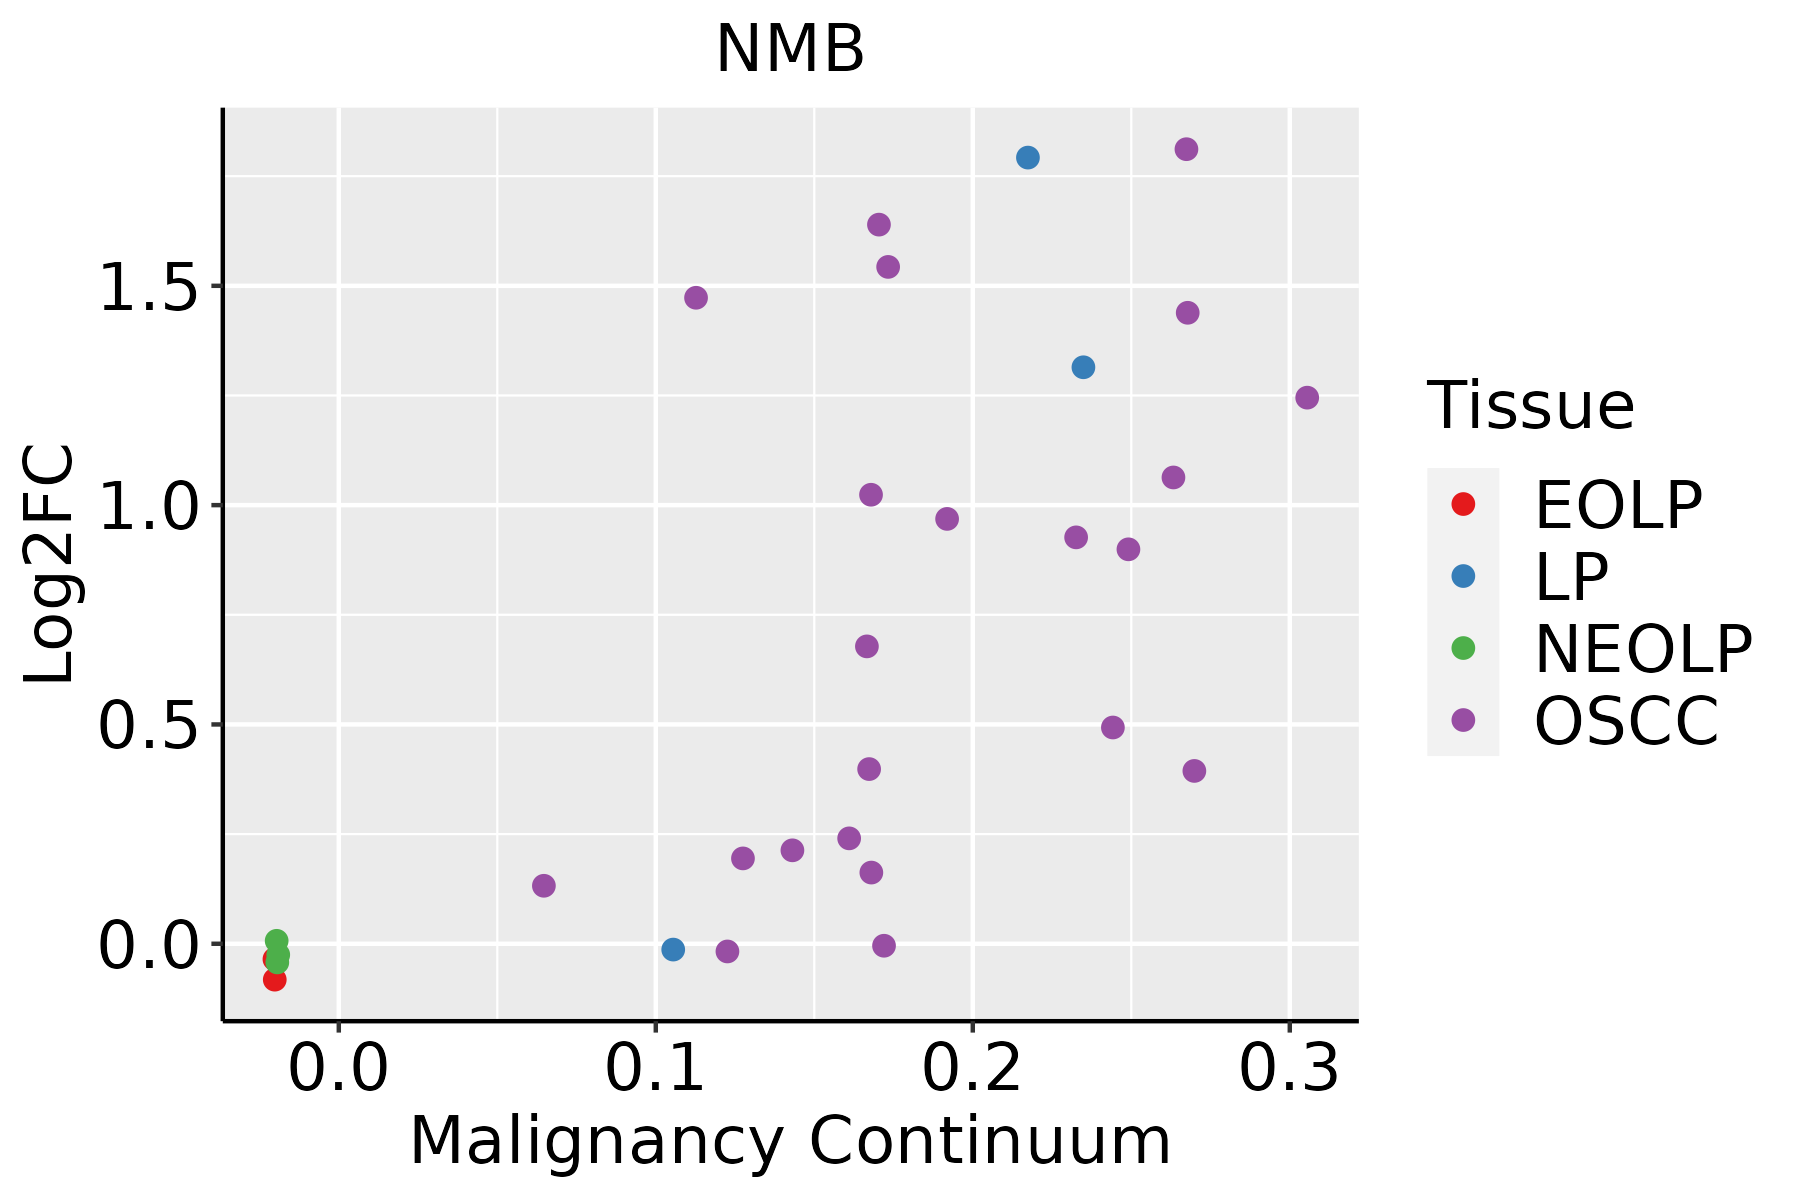
EOLP: Erosive Oral lichen planus
LP: leukoplakia
NEOLP: Non-erosive oral lichen planus
OSCC: Oral squamous cell carcinoma
SkinThe image shows the transcriptomic changes along malignancy continuum.log2FC in expression of this searched gene in stem-like cells from each diseased tissue sample relative to stem-like cells in normal samples in each tissue plotted against the malignancy continuum. Samples are colored based on if they are from different disease stage.
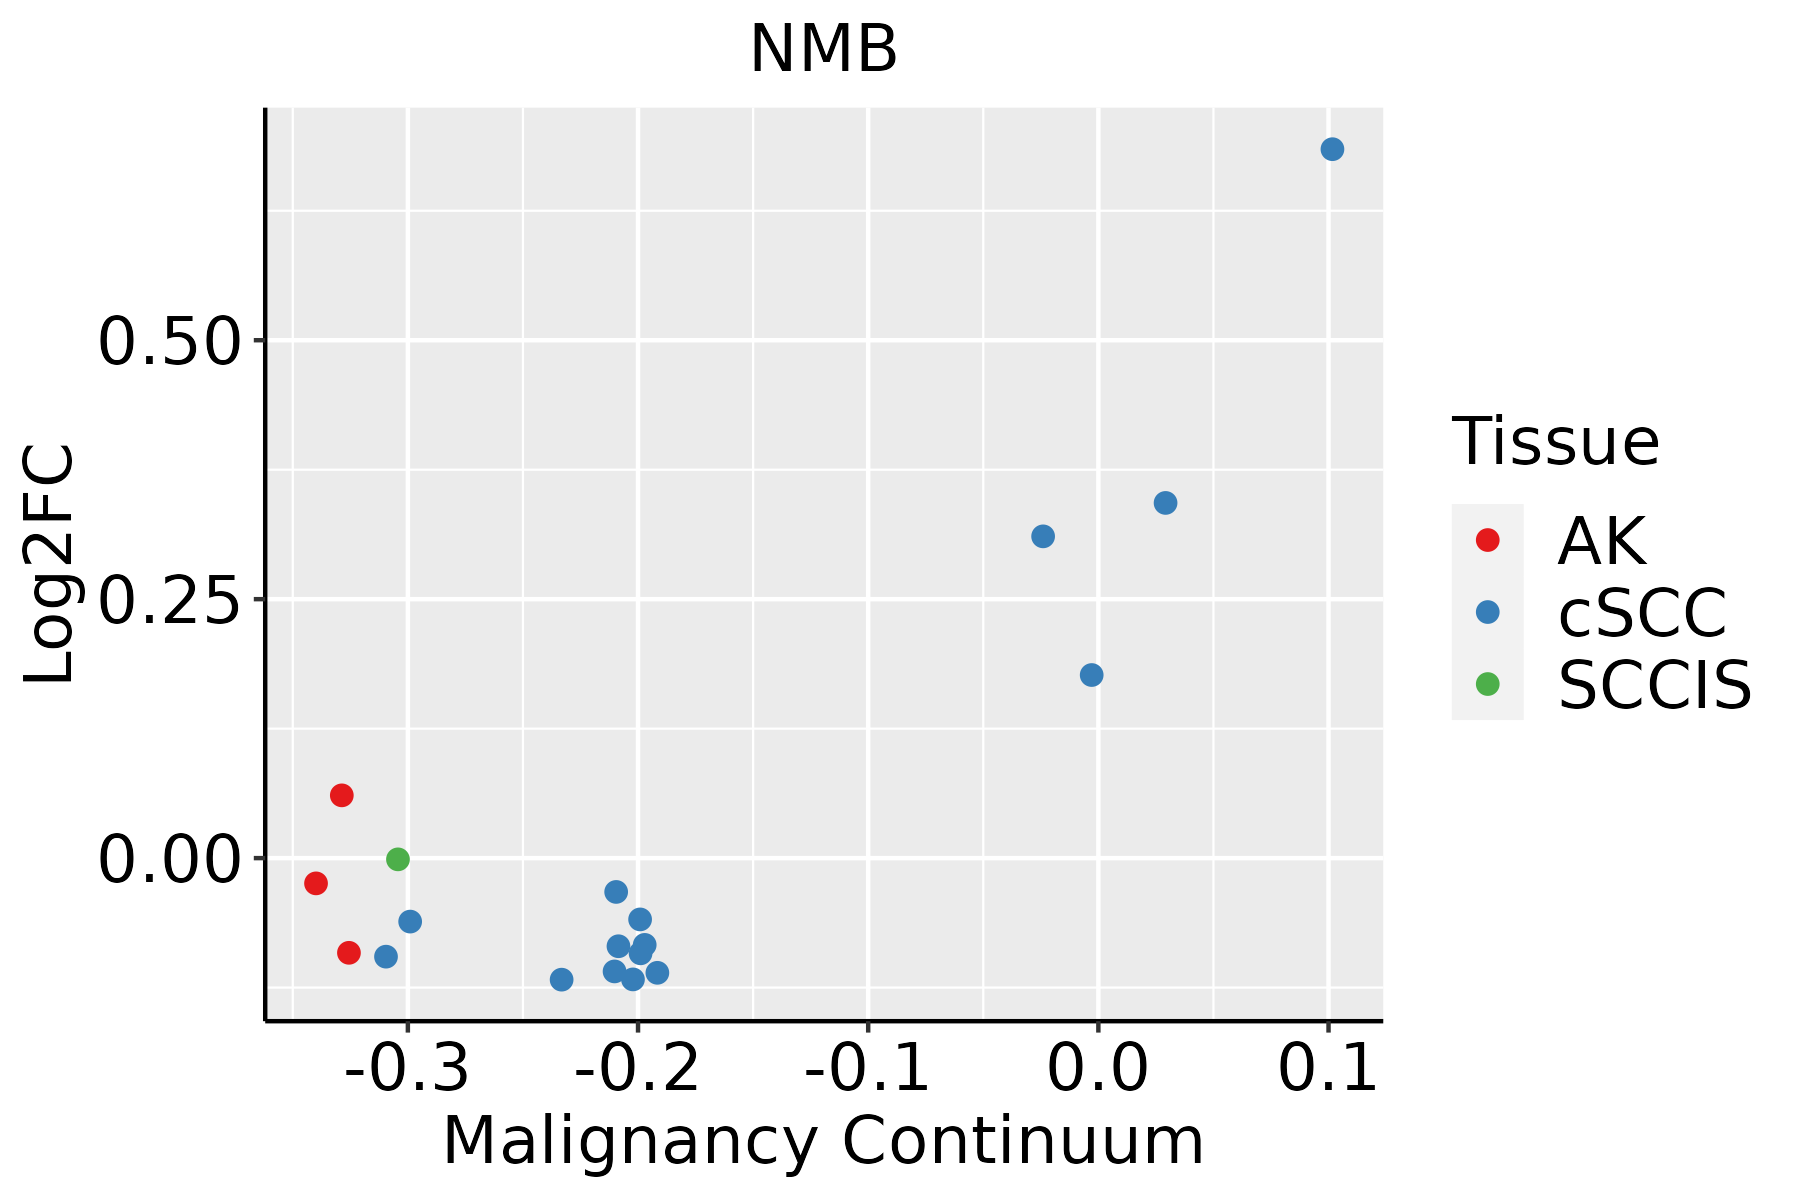
AK: Actinic keratosis
cSCC: Cutaneous squamous cell carcinoma
SCCIS:squamous cell carcinoma in situ
ThyroidThe image shows the transcriptomic changes along malignancy continuum.log2FC in expression of this searched gene in stem-like cells from each diseased tissue sample relative to stem-like cells in normal samples in each tissue plotted against the malignancy continuum. Samples are colored based on if they are from different disease stage.ATC: Anaplastic thyroid cancer
HT: Hashimoto's thyroiditis
PTC: Papillary thyroid cancer
∗log2FC in expression of this searched gene in stem-like cells from each diseased tissue sample relative to stem-like cells in normal samples in each tissue plotted against the malignancy continuum. Samples are colored based on if they are from different disease stage.

Top

Malignant transformation related pathway analysis

check buttonFind out the enriched GO biological processes and KEGG pathways involved in transition from healthy to precancer to cancer
check button Figure of enriched GO biological processes.
TissueDisease StageEnriched GO biological Processes
ColorectumADGO analysis - Figure of enriched GO biological processes: Top 15 enriched GO BP terms are showed in the bar plot of each disease state in each tissue. Each row represents a significant GO biological process which is colored according to the -log10(p.adjust).
ColorectumSERGO analysis - Figure of enriched GO biological processes: Top 15 enriched GO BP terms are showed in the bar plot of each disease state in each tissue. Each row represents a significant GO biological process which is colored according to the -log10(p.adjust).
ColorectumMSSGO analysis - Figure of enriched GO biological processes: Top 15 enriched GO BP terms are showed in the bar plot of each disease state in each tissue. Each row represents a significant GO biological process which is colored according to the -log10(p.adjust).
ColorectumMSI-HGO analysis - Figure of enriched GO biological processes: Top 15 enriched GO BP terms are showed in the bar plot of each disease state in each tissue. Each row represents a significant GO biological process which is colored according to the -log10(p.adjust).
ColorectumFAPGO analysis - Figure of enriched GO biological processes: Top 15 enriched GO BP terms are showed in the bar plot of each disease state in each tissue. Each row represents a significant GO biological process which is colored according to the -log10(p.adjust).
∗Top 15 enriched GO BP terms are showed in the bar plot of each disease state in each tissue. Each row represents a significant GO biological process which is colored according to the -log10(p.adjust).
Page: 1 2 3 4 5 6 7 8 9 

check button Enriched GO biological processes.
GO IDTissueDisease StageDescriptionGene RatioBg Ratiopvaluep.adjustCount
GO:007099714BreastIDCneuron death57/1434361/187231.31e-077.38e-0657
GO:190121414BreastIDCregulation of neuron death48/1434319/187235.01e-061.69e-0448
GO:004211012BreastIDCT cell activation64/1434487/187231.49e-053.77e-0464
GO:005086311BreastIDCregulation of T cell activation47/1434329/187232.49e-055.91e-0447
GO:000164912BreastIDCosteoblast differentiation35/1434229/187236.64e-051.35e-0335
GO:000715912BreastIDCleukocyte cell-cell adhesion49/1434371/187231.27e-042.33e-0349
GO:000268311BreastIDCnegative regulation of immune system process55/1434434/187231.53e-042.67e-0355
GO:190303711BreastIDCregulation of leukocyte cell-cell adhesion45/1434336/187231.72e-042.92e-0345
GO:00457651BreastIDCregulation of angiogenesis45/1434342/187232.57e-043.98e-0345
GO:002240712BreastIDCregulation of cell-cell adhesion55/1434448/187233.43e-045.07e-0355
GO:19013421BreastIDCregulation of vasculature development45/1434348/187233.78e-045.38e-0345
GO:00703713BreastIDCERK1 and ERK2 cascade43/1434330/187234.28e-045.84e-0343
GO:000150311BreastIDCossification50/1434408/187236.51e-048.04e-0350
GO:190121513BreastIDCnegative regulation of neuron death29/1434208/187231.23e-031.32e-0229
GO:004209812BreastIDCT cell proliferation28/1434199/187231.29e-031.35e-0228
GO:004212911BreastIDCregulation of T cell proliferation25/1434171/187231.32e-031.38e-0225
GO:003264011BreastIDCtumor necrosis factor production25/1434181/187232.92e-032.53e-0225
GO:003268011BreastIDCregulation of tumor necrosis factor production25/1434181/187232.92e-032.53e-0225
GO:00071625BreastIDCnegative regulation of cell adhesion37/1434303/187233.27e-032.75e-0237
GO:007170611BreastIDCtumor necrosis factor superfamily cytokine production25/1434186/187234.21e-033.31e-0225
Page: 1 2 3 4 5 6 7 8 9 10 11 12 13 14 15 16 17 18 

check button Enriched KEGG pathways.
Pathway IDTissueDisease StageDescriptionGene RatioBg Ratiopvaluep.adjustqvalueCount
Page: 1 

Top

Cell-cell communication analysis

check buttonIdentification of potential cell-cell interactions between two cell types and their ligand-receptor pairs for different disease states
LigandReceptorLRpairPathwayTissueDisease Stage
Page: 1 

Top

Single-cell gene regulatory network inference analysis

check buttonFind out the significant the regulons (TFs) and the target genes of each regulon across cell types for different disease states
TFCell TypeTissueDisease StageTarget GeneRSSRegulon Activity
∗The dot plots of a searched regulon are shown for all cell subpopulations in each disease state of each tissue based on the regulon specific score inferred using pySCENIC and by calculating the average expression.
Page: 1 

Top

Somatic mutation of malignant transformation related genes

check buttonAnnotation of somatic variants for genes involved in malignant transformation
Hugo SymbolVariant ClassVariant ClassificationdbSNP RSHGVScHGVSpHGVSp ShortSWISSPROTBIOTYPESIFTPolyPhenTumor Sample BarcodeTissueHistologySexAgeStageTherapy TypesDrugsOutcome
NMBinsertionFrame_Shift_Insnovelc.230_231insAGCATATAGTGTGTGCATTTTGAAGGGAp.Arg78AlafsTer19p.R78Afs*19P08949protein_codingTCGA-A2-A0CP-01Breastbreast invasive carcinomaFemale<65I/IIChemotherapycytoxanSD
NMBSNVMissense_Mutationc.365C>Ap.Pro122Glnp.P122QP08949protein_codingtolerated_low_confidence(0.25)benign(0.005)TCGA-G4-6309-01Colorectumcolon adenocarcinomaFemale<65III/IVChemotherapyxelodaPD
NMBSNVMissense_Mutationnovelc.384N>Cp.Gln128Hisp.Q128HP08949protein_codingtolerated_low_confidence(0.21)benign(0.138)TCGA-A5-A0G2-01Endometriumuterine corpus endometrioid carcinomaFemale<65III/IVUnknownUnknownSD
NMBSNVMissense_Mutationnovelc.418G>Tp.Val140Leup.V140LP08949protein_codingtolerated_low_confidence(0.59)benign(0.001)TCGA-AJ-A3BG-01Endometriumuterine corpus endometrioid carcinomaFemale>=65I/IIChemotherapycarboplatinPD
NMBSNVMissense_Mutationc.341N>Ap.Gly114Aspp.G114DP08949protein_codingtolerated_low_confidence(0.12)benign(0.058)TCGA-BS-A0U7-01Endometriumuterine corpus endometrioid carcinomaFemale<65I/IIUnknownUnknownSD
NMBSNVMissense_Mutationc.406N>Ap.His136Asnp.H136NP08949protein_codingtolerated_low_confidence(0.05)benign(0.015)TCGA-D1-A0ZS-01Endometriumuterine corpus endometrioid carcinomaFemale<65I/IIUnknownUnknownSD
NMBSNVMissense_Mutationc.388C>Tp.Arg130Cysp.R130CP08949protein_codingtolerated_low_confidence(0.05)benign(0.003)TCGA-D1-A103-01Endometriumuterine corpus endometrioid carcinomaFemale>=65I/IIUnknownUnknownSD
NMBSNVMissense_Mutationnovelc.455G>Ap.Cys152Tyrp.C152YP08949protein_codingdeleterious_low_confidence(0.02)benign(0.01)TCGA-22-1002-01Lunglung squamous cell carcinomaMale>=65I/IIUnknownUnknownSD
NMBSNVMissense_Mutationnovelc.83G>Ap.Ser28Asnp.S28NP08949protein_codingtolerated(0.13)benign(0.006)TCGA-CN-5373-01Oral cavityhead & neck squamous cell carcinomaFemale<65I/IIUnknownUnknownSD
NMBSNVMissense_Mutationnovelc.289G>Cp.Ala97Prop.A97PP08949protein_codingdeleterious(0.02)possibly_damaging(0.735)TCGA-CR-7364-01Oral cavityhead & neck squamous cell carcinomaMale>=65III/IVUnknownUnknownSD
Page: 1 2 

Top

Related drugs of malignant transformation related genes

check buttonIdentification of chemicals and drugs interact with genes involved in malignant transfromation
(DGIdb 4.0)
Entrez IDSymbolCategoryInteraction TypesDrug Claim NameDrug NamePMIDs
Page: 1