
|
|||||
|
 | |
| |
| |
| |
| |
| |
|
Gene: NIPA2 |
Gene summary for NIPA2 |
| Gene information | Species | Human | Gene symbol | NIPA2 | Gene ID | 81614 |
| Gene name | NIPA magnesium transporter 2 | |
| Gene Alias | SLC57A2 | |
| Cytomap | 15q11.2 | |
| Gene Type | protein-coding | GO ID | GO:0006810 | UniProtAcc | A0A024R372 |
Top |
Malignant transformation analysis |
| Identification of the aberrant gene expression in precancerous and cancerous lesions by comparing the gene expression of stem-like cells in diseased tissues with normal stem cells |
| Entrez ID | Symbol | Replicates | Species | Organ | Tissue | Adj P-value | Log2FC | Malignancy |
| 81614 | NIPA2 | C09 | Human | Oral cavity | OSCC | 1.75e-04 | 2.33e-01 | 0.1431 |
| 81614 | NIPA2 | LN22 | Human | Oral cavity | OSCC | 9.84e-12 | 1.05e+00 | 0.1733 |
| 81614 | NIPA2 | LN38 | Human | Oral cavity | OSCC | 6.97e-07 | 1.36e+00 | 0.168 |
| 81614 | NIPA2 | LN46 | Human | Oral cavity | OSCC | 9.65e-07 | 5.05e-01 | 0.1666 |
| 81614 | NIPA2 | LP15 | Human | Oral cavity | LP | 3.35e-03 | 9.41e-01 | 0.2174 |
| 81614 | NIPA2 | SYSMH1 | Human | Oral cavity | OSCC | 8.88e-07 | 2.59e-01 | 0.1127 |
| 81614 | NIPA2 | SYSMH2 | Human | Oral cavity | OSCC | 6.61e-13 | 5.05e-01 | 0.2326 |
| 81614 | NIPA2 | SYSMH3 | Human | Oral cavity | OSCC | 1.10e-19 | 5.86e-01 | 0.2442 |
| 81614 | NIPA2 | SYSMH6 | Human | Oral cavity | OSCC | 7.67e-03 | 3.39e-01 | 0.1275 |
| 81614 | NIPA2 | P4_S8_cSCC | Human | Skin | cSCC | 1.14e-03 | 8.41e-02 | -0.3095 |
| 81614 | NIPA2 | P5_S10_cSCC | Human | Skin | cSCC | 1.12e-03 | 1.02e-01 | -0.299 |
| 81614 | NIPA2 | P1_cSCC | Human | Skin | cSCC | 1.60e-16 | 5.47e-01 | 0.0292 |
| 81614 | NIPA2 | P2_cSCC | Human | Skin | cSCC | 3.29e-07 | 2.92e-01 | -0.024 |
| 81614 | NIPA2 | P4_cSCC | Human | Skin | cSCC | 1.56e-18 | 5.59e-01 | -0.00290000000000005 |
| 81614 | NIPA2 | P10_cSCC | Human | Skin | cSCC | 9.99e-39 | 1.16e+00 | 0.1017 |
| 81614 | NIPA2 | male-WTA | Human | Thyroid | PTC | 5.49e-16 | 9.88e-02 | 0.1037 |
| 81614 | NIPA2 | PTC01 | Human | Thyroid | PTC | 5.77e-12 | 1.42e-01 | 0.1899 |
| 81614 | NIPA2 | PTC04 | Human | Thyroid | PTC | 8.72e-10 | 9.19e-02 | 0.1927 |
| 81614 | NIPA2 | PTC05 | Human | Thyroid | PTC | 4.59e-08 | 2.98e-01 | 0.2065 |
| 81614 | NIPA2 | PTC06 | Human | Thyroid | PTC | 3.30e-28 | 4.44e-01 | 0.2057 |
| Page: 1 2 3 4 5 6 |
| Tissue | Expression Dynamics | Abbreviation |
| Esophagus |  | ESCC: Esophageal squamous cell carcinoma |
| HGIN: High-grade intraepithelial neoplasias | ||
| LGIN: Low-grade intraepithelial neoplasias | ||
| Liver | 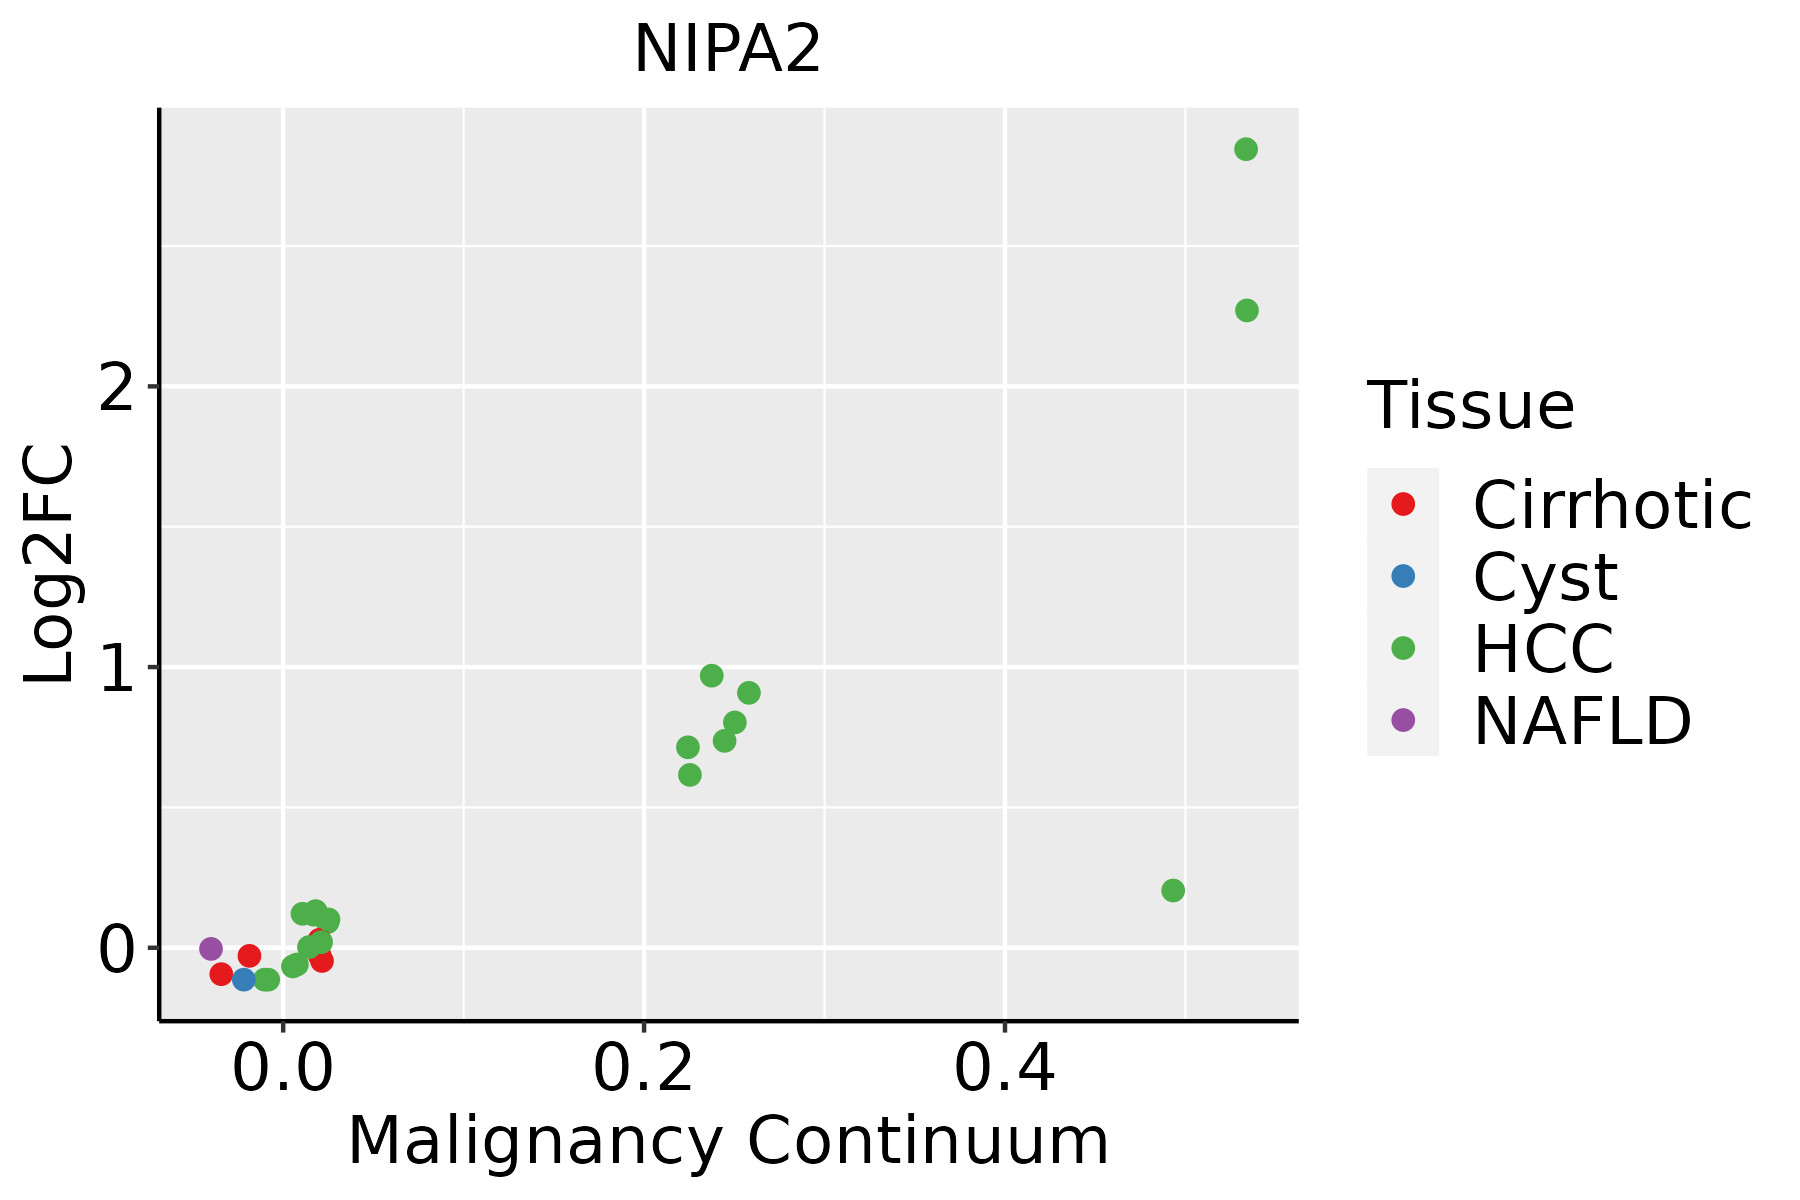 | HCC: Hepatocellular carcinoma |
| NAFLD: Non-alcoholic fatty liver disease | ||
| Oral Cavity |  | EOLP: Erosive Oral lichen planus |
| LP: leukoplakia | ||
| NEOLP: Non-erosive oral lichen planus | ||
| OSCC: Oral squamous cell carcinoma | ||
| Prostate |  | BPH: Benign Prostatic Hyperplasia |
| Skin |  | AK: Actinic keratosis |
| cSCC: Cutaneous squamous cell carcinoma | ||
| SCCIS:squamous cell carcinoma in situ | ||
| Thyroid | 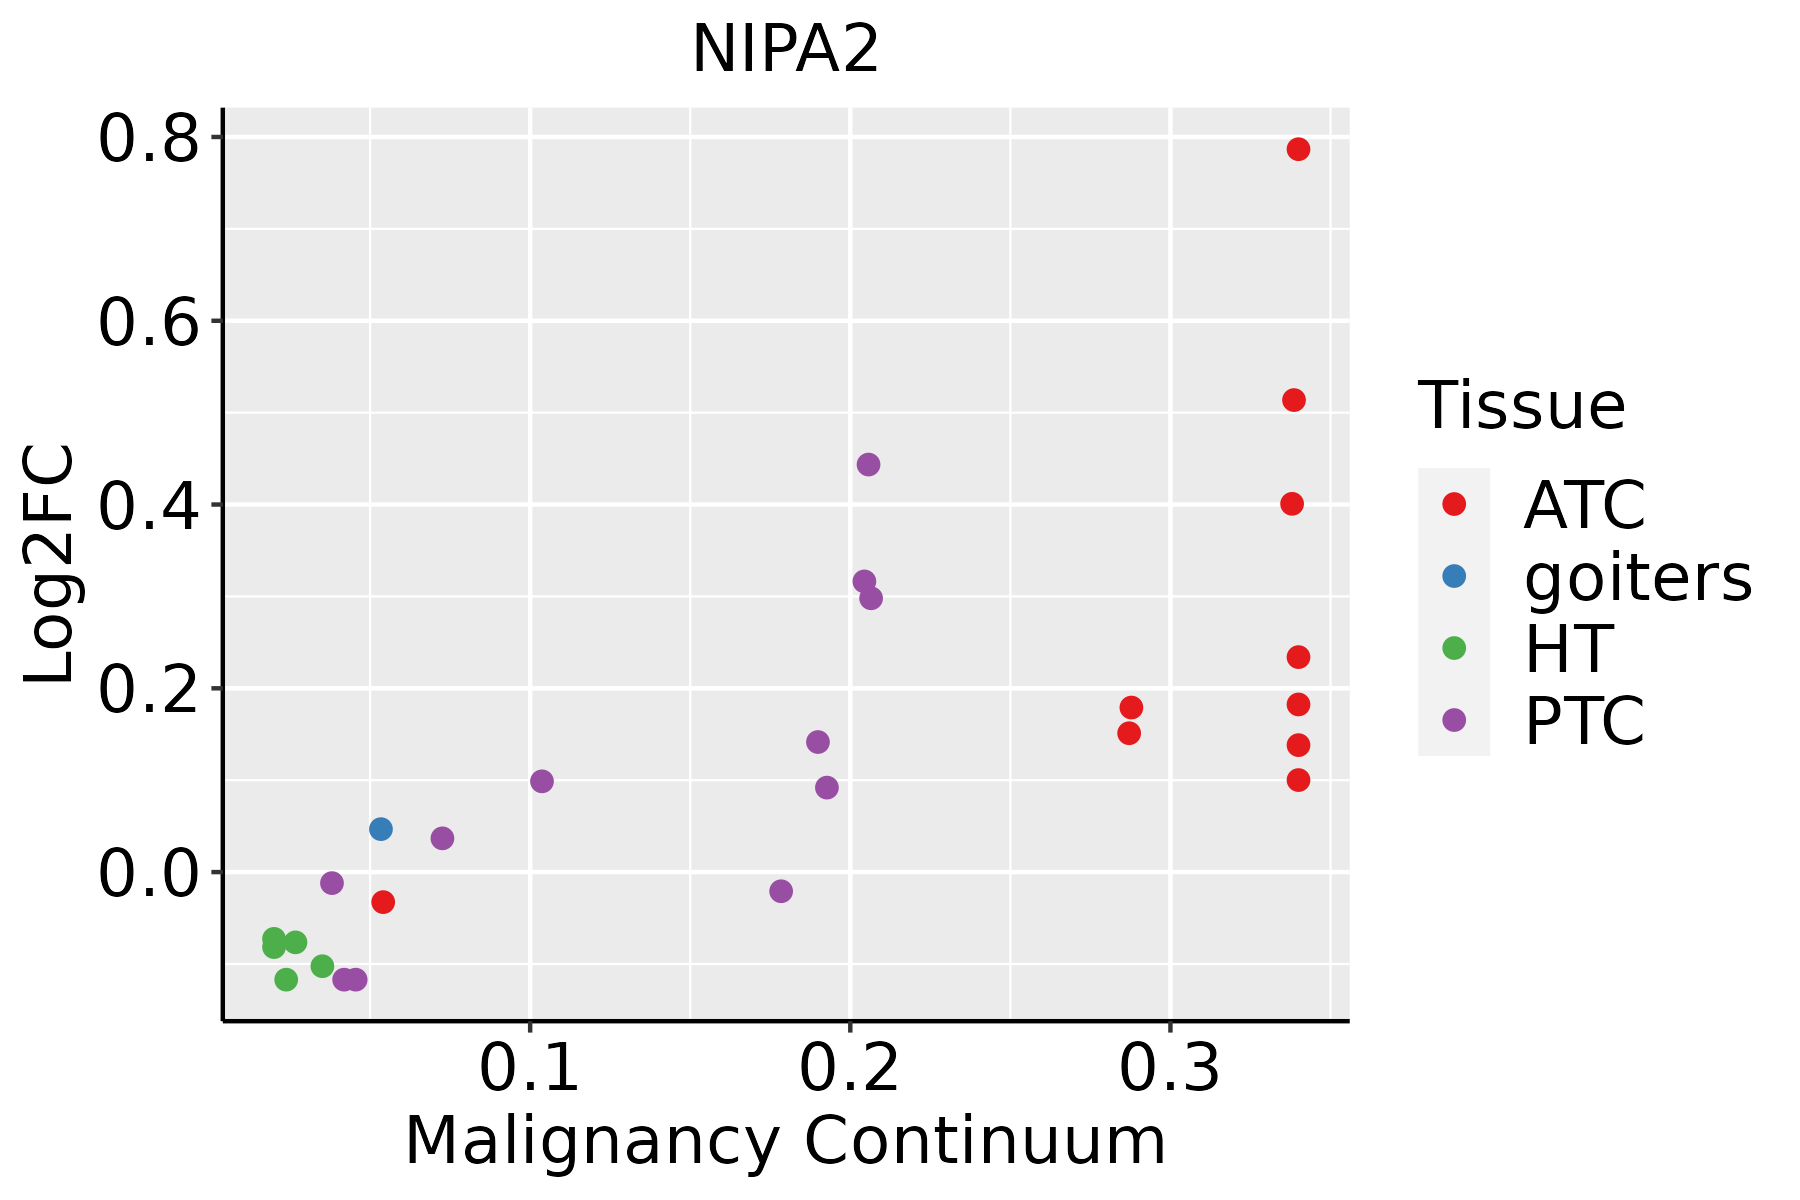 | ATC: Anaplastic thyroid cancer |
| HT: Hashimoto's thyroiditis | ||
| PTC: Papillary thyroid cancer |
| ∗log2FC in expression of this searched gene in stem-like cells from each diseased tissue sample relative to stem-like cells in normal samples in each tissue plotted against the malignancy continuum. Samples are colored based on if they are from different disease stage. |
Top |
Malignant transformation related pathway analysis |
| Find out the enriched GO biological processes and KEGG pathways involved in transition from healthy to precancer to cancer |
| Tissue | Disease Stage | Enriched GO biological Processes |
| Colorectum | AD |  |
| Colorectum | SER |  |
| Colorectum | MSS |  |
| Colorectum | MSI-H |  |
| Colorectum | FAP |  |
| ∗Top 15 enriched GO BP terms are showed in the bar plot of each disease state in each tissue. Each row represents a significant GO biological process which is colored according to the -log10(p.adjust). |
| Page: 1 2 3 4 5 6 7 8 9 |
| GO ID | Tissue | Disease Stage | Description | Gene Ratio | Bg Ratio | pvalue | p.adjust | Count |
| Page: 1 |
| Pathway ID | Tissue | Disease Stage | Description | Gene Ratio | Bg Ratio | pvalue | p.adjust | qvalue | Count |
| Page: 1 |
Top |
Cell-cell communication analysis |
| Identification of potential cell-cell interactions between two cell types and their ligand-receptor pairs for different disease states |
| Ligand | Receptor | LRpair | Pathway | Tissue | Disease Stage |
| Page: 1 |
Top |
Single-cell gene regulatory network inference analysis |
| Find out the significant the regulons (TFs) and the target genes of each regulon across cell types for different disease states |
| TF | Cell Type | Tissue | Disease Stage | Target Gene | RSS | Regulon Activity |
| ∗The dot plots of a searched regulon are shown for all cell subpopulations in each disease state of each tissue based on the regulon specific score inferred using pySCENIC and by calculating the average expression. |
| Page: 1 |
Top |
Somatic mutation of malignant transformation related genes |
| Annotation of somatic variants for genes involved in malignant transformation |
| Hugo Symbol | Variant Class | Variant Classification | dbSNP RS | HGVSc | HGVSp | HGVSp Short | SWISSPROT | BIOTYPE | SIFT | PolyPhen | Tumor Sample Barcode | Tissue | Histology | Sex | Age | Stage | Therapy Types | Drugs | Outcome |
| NIPA2 | SNV | Missense_Mutation | novel | c.257C>T | p.Thr86Ile | p.T86I | Q8N8Q9 | protein_coding | deleterious(0) | probably_damaging(0.956) | TCGA-A8-A09I-01 | Breast | breast invasive carcinoma | Female | >=65 | I/II | Hormone Therapy | anastrozole | SD |
| NIPA2 | SNV | Missense_Mutation | c.259C>G | p.Pro87Ala | p.P87A | Q8N8Q9 | protein_coding | deleterious(0) | probably_damaging(0.984) | TCGA-EK-A3GK-01 | Cervix | cervical & endocervical cancer | Female | <65 | I/II | Unknown | Unknown | SD | |
| NIPA2 | SNV | Missense_Mutation | c.998N>C | p.Asn333Thr | p.N333T | Q8N8Q9 | protein_coding | tolerated(0.13) | benign(0.024) | TCGA-AA-3710-01 | Colorectum | colon adenocarcinoma | Female | >=65 | I/II | Unknown | Unknown | SD | |
| NIPA2 | SNV | Missense_Mutation | rs776169350 | c.941N>A | p.Arg314Gln | p.R314Q | Q8N8Q9 | protein_coding | tolerated(0.3) | benign(0.017) | TCGA-AA-3715-01 | Colorectum | colon adenocarcinoma | Male | >=65 | I/II | Unknown | Unknown | PD |
| NIPA2 | SNV | Missense_Mutation | c.934T>C | p.Ser312Pro | p.S312P | Q8N8Q9 | protein_coding | tolerated(0.29) | benign(0.019) | TCGA-AA-3977-01 | Colorectum | colon adenocarcinoma | Male | >=65 | I/II | Unknown | Unknown | SD | |
| NIPA2 | SNV | Missense_Mutation | c.550N>G | p.Ile184Val | p.I184V | Q8N8Q9 | protein_coding | tolerated(0.18) | possibly_damaging(0.498) | TCGA-AG-3726-01 | Colorectum | rectum adenocarcinoma | Female | <65 | I/II | Unknown | Unknown | SD | |
| NIPA2 | SNV | Missense_Mutation | c.320G>T | p.Arg107Ile | p.R107I | Q8N8Q9 | protein_coding | deleterious(0.02) | possibly_damaging(0.493) | TCGA-EI-6917-01 | Colorectum | rectum adenocarcinoma | Male | <65 | III/IV | Chemotherapy | 5fluorouracil+oxaciplatina+l-folinian | SD | |
| NIPA2 | SNV | Missense_Mutation | rs776169350 | c.941G>A | p.Arg314Gln | p.R314Q | Q8N8Q9 | protein_coding | tolerated(0.3) | benign(0.017) | TCGA-EI-6917-01 | Colorectum | rectum adenocarcinoma | Male | <65 | III/IV | Chemotherapy | 5fluorouracil+oxaciplatina+l-folinian | SD |
| NIPA2 | insertion | Frame_Shift_Ins | novel | c.90_91insA | p.Leu35ProfsTer21 | p.L35Pfs*21 | Q8N8Q9 | protein_coding | TCGA-AA-3811-01 | Colorectum | colon adenocarcinoma | Female | >=65 | III/IV | Unknown | Unknown | PD | ||
| NIPA2 | insertion | Frame_Shift_Ins | novel | c.90_91insA | p.Leu35ProfsTer21 | p.L35Pfs*21 | Q8N8Q9 | protein_coding | TCGA-AD-5900-01 | Colorectum | colon adenocarcinoma | Male | >=65 | I/II | Unknown | Unknown | SD |
| Page: 1 2 3 4 5 |
Top |
Related drugs of malignant transformation related genes |
| Identification of chemicals and drugs interact with genes involved in malignant transfromation |
| (DGIdb 4.0) |
| Entrez ID | Symbol | Category | Interaction Types | Drug Claim Name | Drug Name | PMIDs |
| Page: 1 |

Copyright 2023-Present -The University of Texas Health Science Center at Houston |