Schematic overview of the cellular and molecular mechanisms involved in the cancer progression, including the proposed cellular and molecular mechanisms in cancer cells trajectory. AT1: alveolar type 1 cells; AT2: alveolar type 2 cells; AAH: atypical adenomatous hyperplasia; AIS: adenocarcinoma in situ; MIA: minimally invasive adenocarcinoma; IA: invasive adenocarcinoma; EMT: epithelial-mesenchymal transition

Home

Download

Statistics

Help

Contact

Center for Computational Systems Medicine
leaf

Gene summary

leaf

Malignant transformation analysis

leaf

Malignant transformation related pathway analysis

leaf

Cell-cell communication analysis

leaf

Single-cell gene regulatory network inference analysis

leaf

Somatic mutation of malignant transformation related genes

leaf

Related drugs of malignant transformation related genes

Gene: MYO19

Gene summary for MYO19

check button Gene summary.

Gene informationSpeciesHuman
Gene symbol

MYO19

Gene ID

80179

Gene namemyosin XIX
Gene AliasMYOHD1
Cytomap17q12
Gene Typeprotein-coding
GO ID

GO:0000266

UniProtAcc

A0A024R0S9


Top

Malignant transformation analysis

check button Identification of the aberrant gene expression in precancerous and cancerous lesions by comparing the gene expression of stem-like cells in diseased tissues with normal stem cells
check button Malignant transformation involving gene list.
Entrez IDSymbolReplicatesSpeciesOrganTissueAdj P-valueLog2FCMalignancy
80179MYO19C30HumanOral cavityOSCC3.51e-421.87e+000.3055
80179MYO19C38HumanOral cavityOSCC7.42e-066.49e-010.172
80179MYO19C43HumanOral cavityOSCC2.07e-175.04e-010.1704
80179MYO19C46HumanOral cavityOSCC5.77e-195.65e-010.1673
80179MYO19C51HumanOral cavityOSCC6.91e-149.22e-010.2674
80179MYO19C57HumanOral cavityOSCC4.79e-093.52e-010.1679
80179MYO19C08HumanOral cavityOSCC4.74e-154.87e-010.1919
80179MYO19C09HumanOral cavityOSCC9.87e-042.02e-010.1431
80179MYO19LN22HumanOral cavityOSCC1.08e-057.96e-010.1733
80179MYO19LN46HumanOral cavityOSCC1.34e-197.00e-010.1666
80179MYO19LP15HumanOral cavityLP2.29e-025.74e-010.2174
80179MYO19SYSMH1HumanOral cavityOSCC2.35e-225.44e-010.1127
80179MYO19SYSMH2HumanOral cavityOSCC3.45e-154.76e-010.2326
80179MYO19SYSMH3HumanOral cavityOSCC2.51e-308.65e-010.2442
80179MYO19SYSMH5HumanOral cavityOSCC8.89e-134.36e-010.0647
80179MYO19P1_S1_AKHumanSkinAK1.06e-082.94e-01-0.3399
80179MYO19P2_S3_AKHumanSkinAK1.31e-052.44e-01-0.3287
80179MYO19P4_S8_cSCCHumanSkincSCC1.07e-052.04e-01-0.3095
80179MYO19P5_S10_cSCCHumanSkincSCC1.83e-051.80e-01-0.299
80179MYO19P1_cSCCHumanSkincSCC8.41e-278.84e-010.0292
Page: 1 2 3 4 5 6 

check button Transcriptomic changes along malignancy continuum.
TissueExpression DynamicsAbbreviation
CervixThe image shows the transcriptomic changes along malignancy continuum.log2FC in expression of this searched gene in stem-like cells from each diseased tissue sample relative to stem-like cells in normal samples in each tissue plotted against the malignancy continuum. Samples are colored based on if they are from different disease stage.CC: Cervix cancer
HSIL_HPV: HPV-infected high-grade squamous intraepithelial lesions
N_HPV: HPV-infected normal cervix
EsophagusThe image shows the transcriptomic changes along malignancy continuum.log2FC in expression of this searched gene in stem-like cells from each diseased tissue sample relative to stem-like cells in normal samples in each tissue plotted against the malignancy continuum. Samples are colored based on if they are from different disease stage.ESCC: Esophageal squamous cell carcinoma
HGIN: High-grade intraepithelial neoplasias
LGIN: Low-grade intraepithelial neoplasias
LiverThe image shows the transcriptomic changes along malignancy continuum.log2FC in expression of this searched gene in stem-like cells from each diseased tissue sample relative to stem-like cells in normal samples in each tissue plotted against the malignancy continuum. Samples are colored based on if they are from different disease stage.
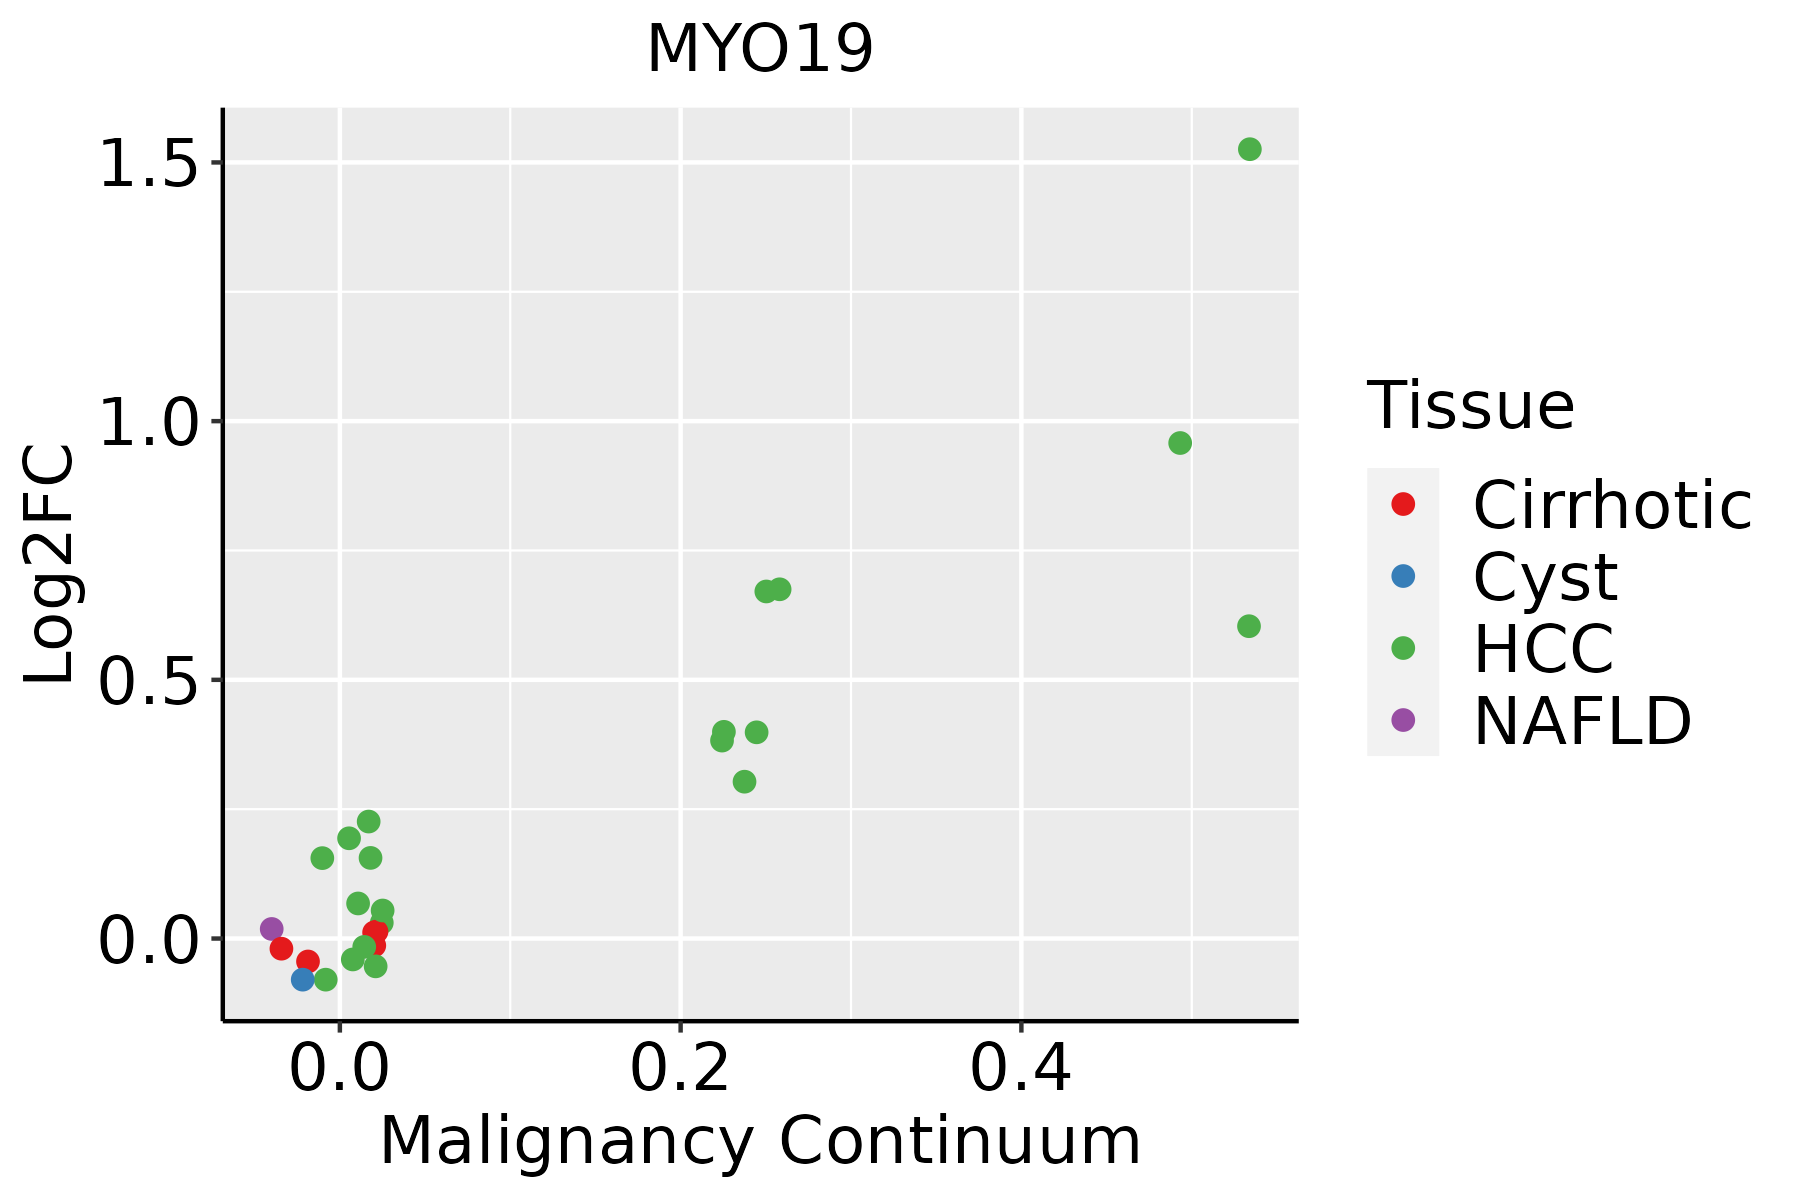
HCC: Hepatocellular carcinoma
NAFLD: Non-alcoholic fatty liver disease
Oral CavityThe image shows the transcriptomic changes along malignancy continuum.log2FC in expression of this searched gene in stem-like cells from each diseased tissue sample relative to stem-like cells in normal samples in each tissue plotted against the malignancy continuum. Samples are colored based on if they are from different disease stage.
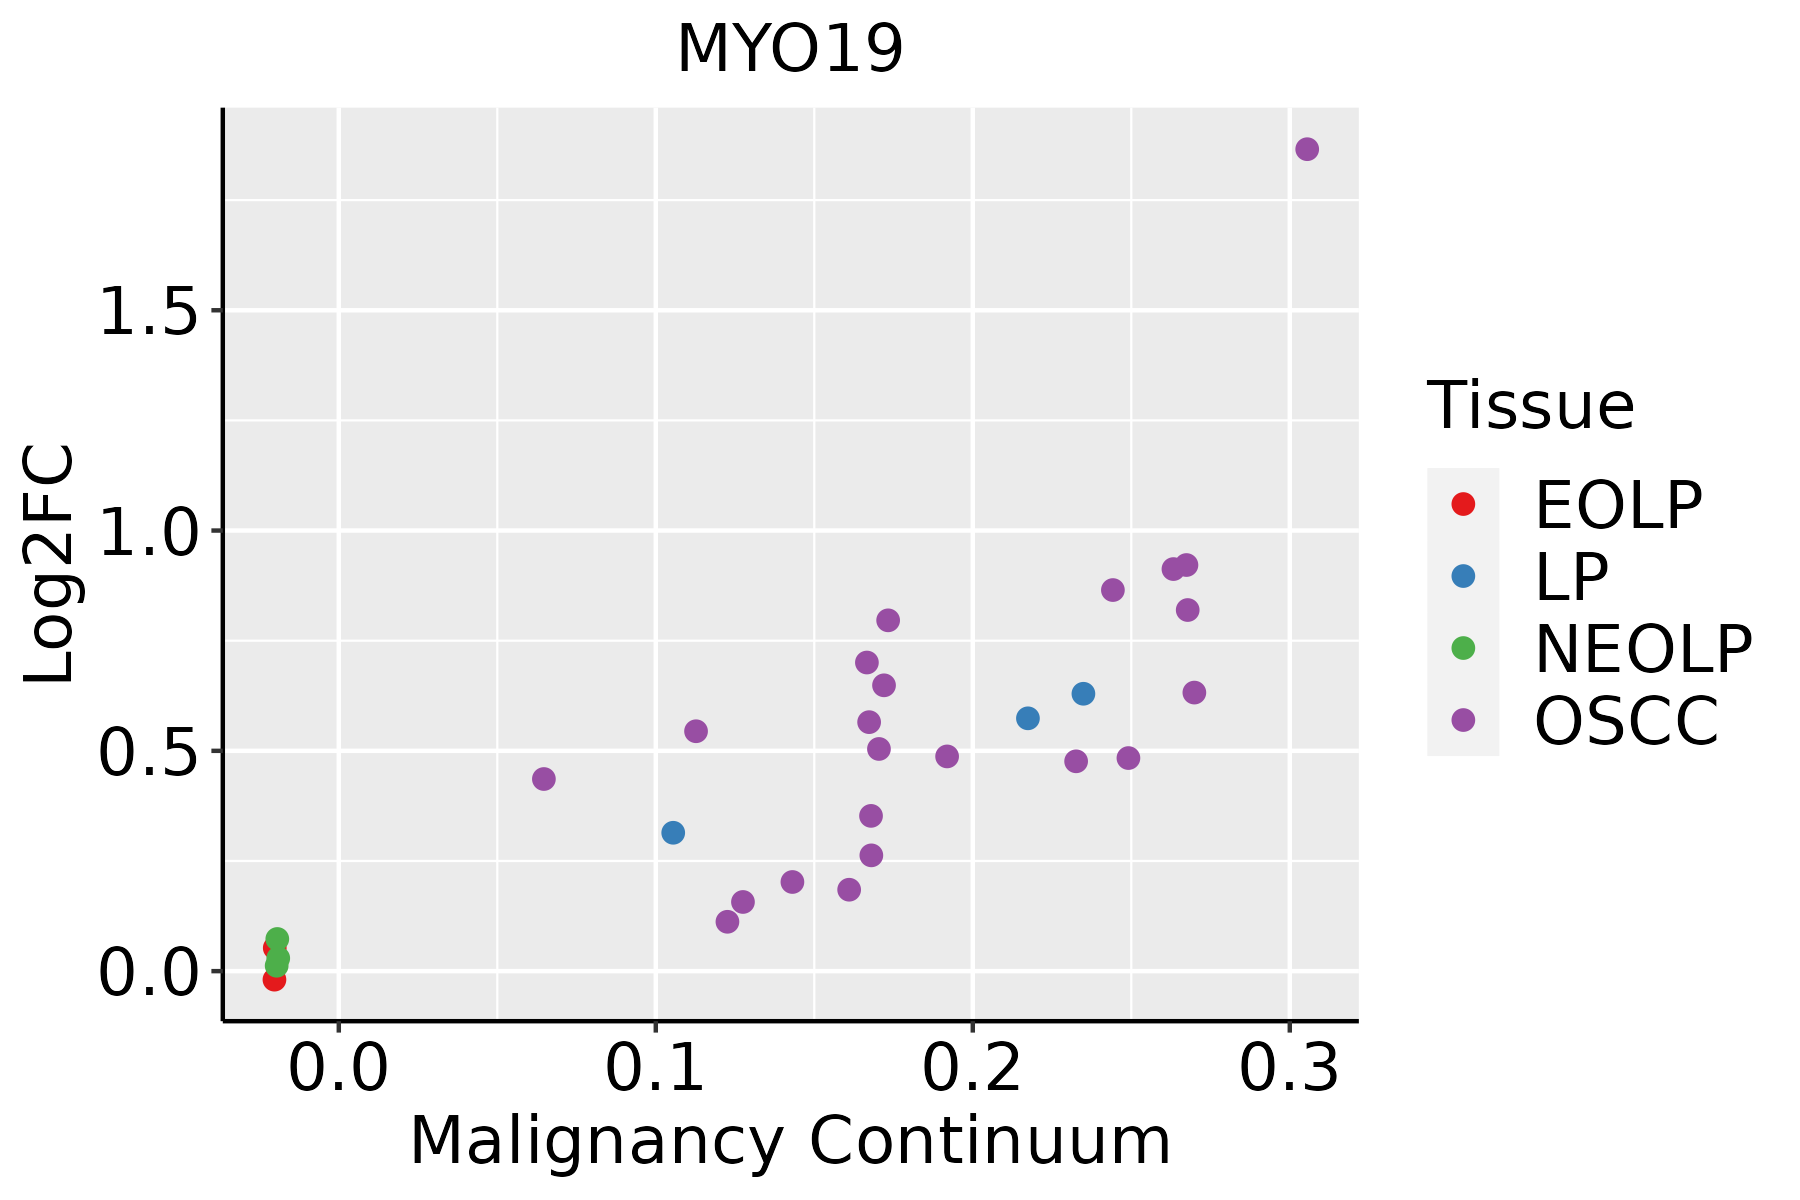
EOLP: Erosive Oral lichen planus
LP: leukoplakia
NEOLP: Non-erosive oral lichen planus
OSCC: Oral squamous cell carcinoma
SkinThe image shows the transcriptomic changes along malignancy continuum.log2FC in expression of this searched gene in stem-like cells from each diseased tissue sample relative to stem-like cells in normal samples in each tissue plotted against the malignancy continuum. Samples are colored based on if they are from different disease stage.AK: Actinic keratosis
cSCC: Cutaneous squamous cell carcinoma
SCCIS:squamous cell carcinoma in situ
ThyroidThe image shows the transcriptomic changes along malignancy continuum.log2FC in expression of this searched gene in stem-like cells from each diseased tissue sample relative to stem-like cells in normal samples in each tissue plotted against the malignancy continuum. Samples are colored based on if they are from different disease stage.ATC: Anaplastic thyroid cancer
HT: Hashimoto's thyroiditis
PTC: Papillary thyroid cancer
∗log2FC in expression of this searched gene in stem-like cells from each diseased tissue sample relative to stem-like cells in normal samples in each tissue plotted against the malignancy continuum. Samples are colored based on if they are from different disease stage.

Top

Malignant transformation related pathway analysis

check buttonFind out the enriched GO biological processes and KEGG pathways involved in transition from healthy to precancer to cancer
check button Figure of enriched GO biological processes.
TissueDisease StageEnriched GO biological Processes
ColorectumADGO analysis - Figure of enriched GO biological processes: Top 15 enriched GO BP terms are showed in the bar plot of each disease state in each tissue. Each row represents a significant GO biological process which is colored according to the -log10(p.adjust).
ColorectumSERGO analysis - Figure of enriched GO biological processes: Top 15 enriched GO BP terms are showed in the bar plot of each disease state in each tissue. Each row represents a significant GO biological process which is colored according to the -log10(p.adjust).
ColorectumMSSGO analysis - Figure of enriched GO biological processes: Top 15 enriched GO BP terms are showed in the bar plot of each disease state in each tissue. Each row represents a significant GO biological process which is colored according to the -log10(p.adjust).
ColorectumMSI-HGO analysis - Figure of enriched GO biological processes: Top 15 enriched GO BP terms are showed in the bar plot of each disease state in each tissue. Each row represents a significant GO biological process which is colored according to the -log10(p.adjust).
ColorectumFAPGO analysis - Figure of enriched GO biological processes: Top 15 enriched GO BP terms are showed in the bar plot of each disease state in each tissue. Each row represents a significant GO biological process which is colored according to the -log10(p.adjust).
∗Top 15 enriched GO BP terms are showed in the bar plot of each disease state in each tissue. Each row represents a significant GO biological process which is colored according to the -log10(p.adjust).
Page: 1 2 3 4 5 6 7 8 9 

check button Enriched GO biological processes.
GO IDTissueDisease StageDescriptionGene RatioBg Ratiopvaluep.adjustCount
GO:000701510CervixCCactin filament organization109/2311442/187234.92e-132.45e-10109
GO:00516567CervixCCestablishment of organelle localization76/2311390/187233.17e-055.21e-0476
GO:00108218CervixCCregulation of mitochondrion organization34/2311144/187231.27e-041.58e-0334
GO:00513021CervixCCregulation of cell division39/2311177/187232.05e-042.33e-0339
GO:00009107CervixCCcytokinesis37/2311173/187235.40e-045.23e-0337
GO:00300487CervixCCactin filament-based movement29/2311127/187236.91e-046.33e-0329
GO:00307057CervixCCcytoskeleton-dependent intracellular transport40/2311195/187237.92e-046.99e-0340
GO:0032465CervixCCregulation of cytokinesis22/231192/187231.55e-031.20e-0222
GO:00516541CervixCCestablishment of mitochondrion localization10/231129/187231.74e-031.31e-0210
GO:00995157CervixCCactin filament-based transport8/231121/187232.44e-031.71e-028
GO:00300507CervixCCvesicle transport along actin filament7/231119/187235.65e-033.25e-027
GO:00516461CervixCCmitochondrion localization13/231150/187236.42e-033.58e-0213
GO:00482851CervixCCorganelle fission78/2311488/187239.70e-034.79e-0278
GO:005165616EsophagusHGINestablishment of organelle localization90/2587390/187234.27e-071.94e-0590
GO:001082119EsophagusHGINregulation of mitochondrion organization42/2587144/187231.20e-064.68e-0542
GO:000091015EsophagusHGINcytokinesis44/2587173/187233.26e-058.32e-0444
GO:003070517EsophagusHGINcytoskeleton-dependent intracellular transport45/2587195/187233.07e-045.15e-0345
GO:005165010EsophagusHGINestablishment of vesicle localization35/2587161/187233.89e-033.54e-0235
GO:00516542EsophagusHGINestablishment of mitochondrion localization10/258729/187234.07e-033.65e-0210
GO:005164810EsophagusHGINvesicle localization37/2587177/187236.03e-034.87e-0237
Page: 1 2 3 4 5 6 7 

check button Enriched KEGG pathways.
Pathway IDTissueDisease StageDescriptionGene RatioBg Ratiopvaluep.adjustqvalueCount
Page: 1 

Top

Cell-cell communication analysis

check buttonIdentification of potential cell-cell interactions between two cell types and their ligand-receptor pairs for different disease states
LigandReceptorLRpairPathwayTissueDisease Stage
Page: 1 

Top

Single-cell gene regulatory network inference analysis

check buttonFind out the significant the regulons (TFs) and the target genes of each regulon across cell types for different disease states
TFCell TypeTissueDisease StageTarget GeneRSSRegulon Activity
∗The dot plots of a searched regulon are shown for all cell subpopulations in each disease state of each tissue based on the regulon specific score inferred using pySCENIC and by calculating the average expression.
Page: 1 

Top

Somatic mutation of malignant transformation related genes

check buttonAnnotation of somatic variants for genes involved in malignant transformation
Hugo SymbolVariant ClassVariant ClassificationdbSNP RSHGVScHGVSpHGVSp ShortSWISSPROTBIOTYPESIFTPolyPhenTumor Sample BarcodeTissueHistologySexAgeStageTherapy TypesDrugsOutcome
MYO19SNVMissense_Mutationrs532830674c.2585G>Ap.Arg862Hisp.R862HQ96H55protein_codingtolerated(0.17)benign(0.012)TCGA-A8-A096-01Breastbreast invasive carcinomaFemale>=65I/IIUnknownUnknownSD
MYO19SNVMissense_Mutationrs765344804c.2794N>Tp.Arg932Trpp.R932WQ96H55protein_codingdeleterious(0.03)benign(0.332)TCGA-D8-A1J8-01Breastbreast invasive carcinomaFemale>=65I/IIHormone TherapynolvadexSD
MYO19insertionFrame_Shift_Insnovelc.2809_2810insTGGTp.Cys937LeufsTer4p.C937Lfs*4Q96H55protein_codingTCGA-B6-A0RG-01Breastbreast invasive carcinomaFemale<65I/IIUnknownUnknownSD
MYO19insertionFrame_Shift_Insnovelc.2807_2808insTTCCGCATTAAATGCAGTAACAGATACCAGTTp.Cys937SerfsTer33p.C937Sfs*33Q96H55protein_codingTCGA-B6-A0RG-01Breastbreast invasive carcinomaFemale<65I/IIUnknownUnknownSD
MYO19SNVMissense_Mutationnovelc.2006N>Gp.Tyr669Cysp.Y669CQ96H55protein_codingdeleterious(0)probably_damaging(1)TCGA-2W-A8YY-01Cervixcervical & endocervical cancerFemale<65I/IIChemotherapycisplatinCR
MYO19SNVMissense_Mutationnovelc.1691N>Gp.Asp564Glyp.D564GQ96H55protein_codingtolerated(0.25)possibly_damaging(0.87)TCGA-2W-A8YY-01Cervixcervical & endocervical cancerFemale<65I/IIChemotherapycisplatinCR
MYO19SNVMissense_Mutationnovelc.1588N>Ap.Val530Metp.V530MQ96H55protein_codingtolerated(0.14)benign(0.022)TCGA-2W-A8YY-01Cervixcervical & endocervical cancerFemale<65I/IIChemotherapycisplatinCR
MYO19SNVMissense_Mutationrs369381777c.584N>Ap.Arg195Hisp.R195HQ96H55protein_codingdeleterious(0)probably_damaging(1)TCGA-2W-A8YY-01Cervixcervical & endocervical cancerFemale<65I/IIChemotherapycisplatinCR
MYO19SNVMissense_Mutationrs766865716c.670N>Gp.Arg224Glyp.R224GQ96H55protein_codingdeleterious(0)probably_damaging(1)TCGA-EA-A3HU-01Cervixcervical & endocervical cancerFemale<65I/IIUnknownUnknownSD
MYO19SNVMissense_Mutationrs776257543c.2270G>Ap.Arg757Hisp.R757HQ96H55protein_codingdeleterious(0)probably_damaging(0.915)TCGA-EK-A3GK-01Cervixcervical & endocervical cancerFemale<65I/IIUnknownUnknownSD
Page: 1 2 3 4 5 6 7 8 9 

Top

Related drugs of malignant transformation related genes

check buttonIdentification of chemicals and drugs interact with genes involved in malignant transfromation
(DGIdb 4.0)
Entrez IDSymbolCategoryInteraction TypesDrug Claim NameDrug NamePMIDs
Page: 1