| Tissue | Expression Dynamics | Abbreviation |
| Cervix | 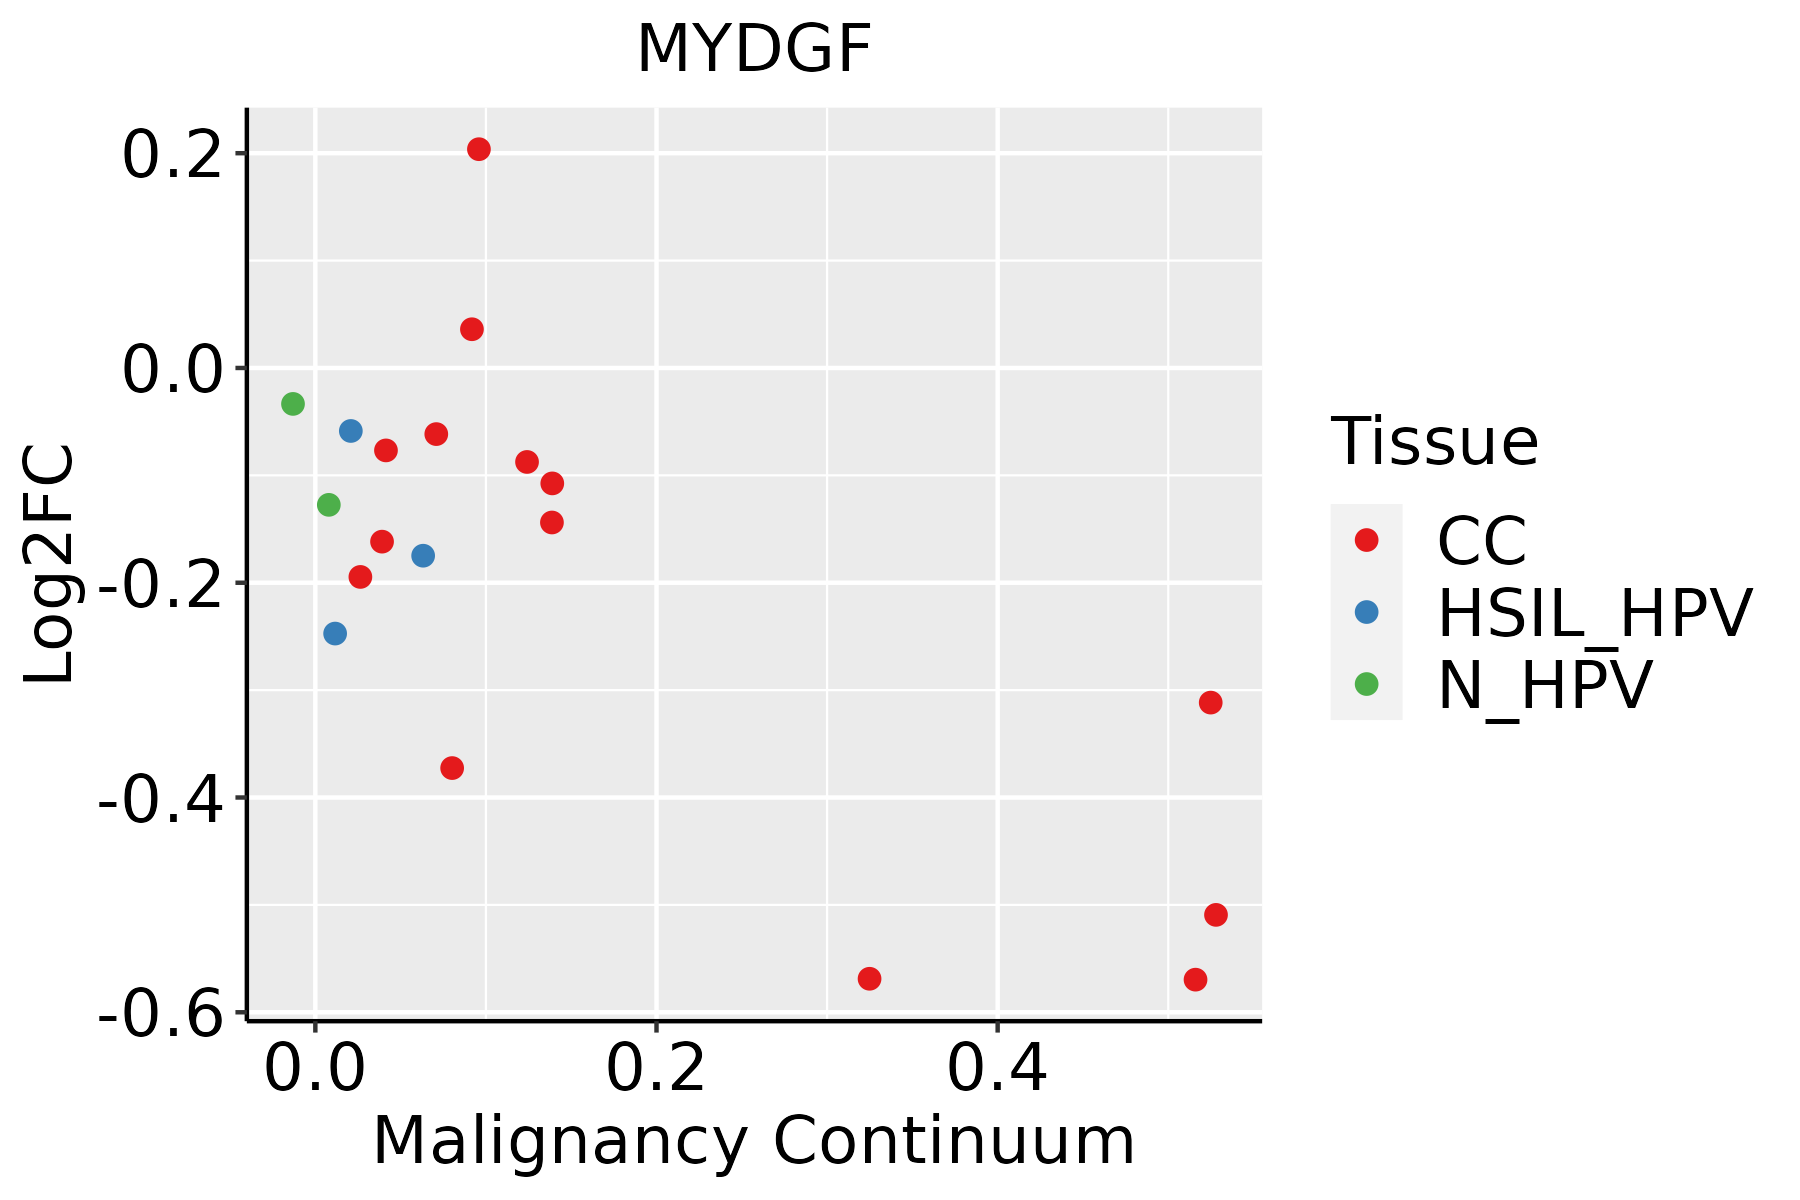 | CC: Cervix cancer |
| HSIL_HPV: HPV-infected high-grade squamous intraepithelial lesions |
| N_HPV: HPV-infected normal cervix |
| Colorectum (GSE201348) |  | FAP: Familial adenomatous polyposis |
| CRC: Colorectal cancer |
| Colorectum (HTA11) |  | AD: Adenomas |
| SER: Sessile serrated lesions |
| MSI-H: Microsatellite-high colorectal cancer |
| MSS: Microsatellite stable colorectal cancer |
| Endometrium | 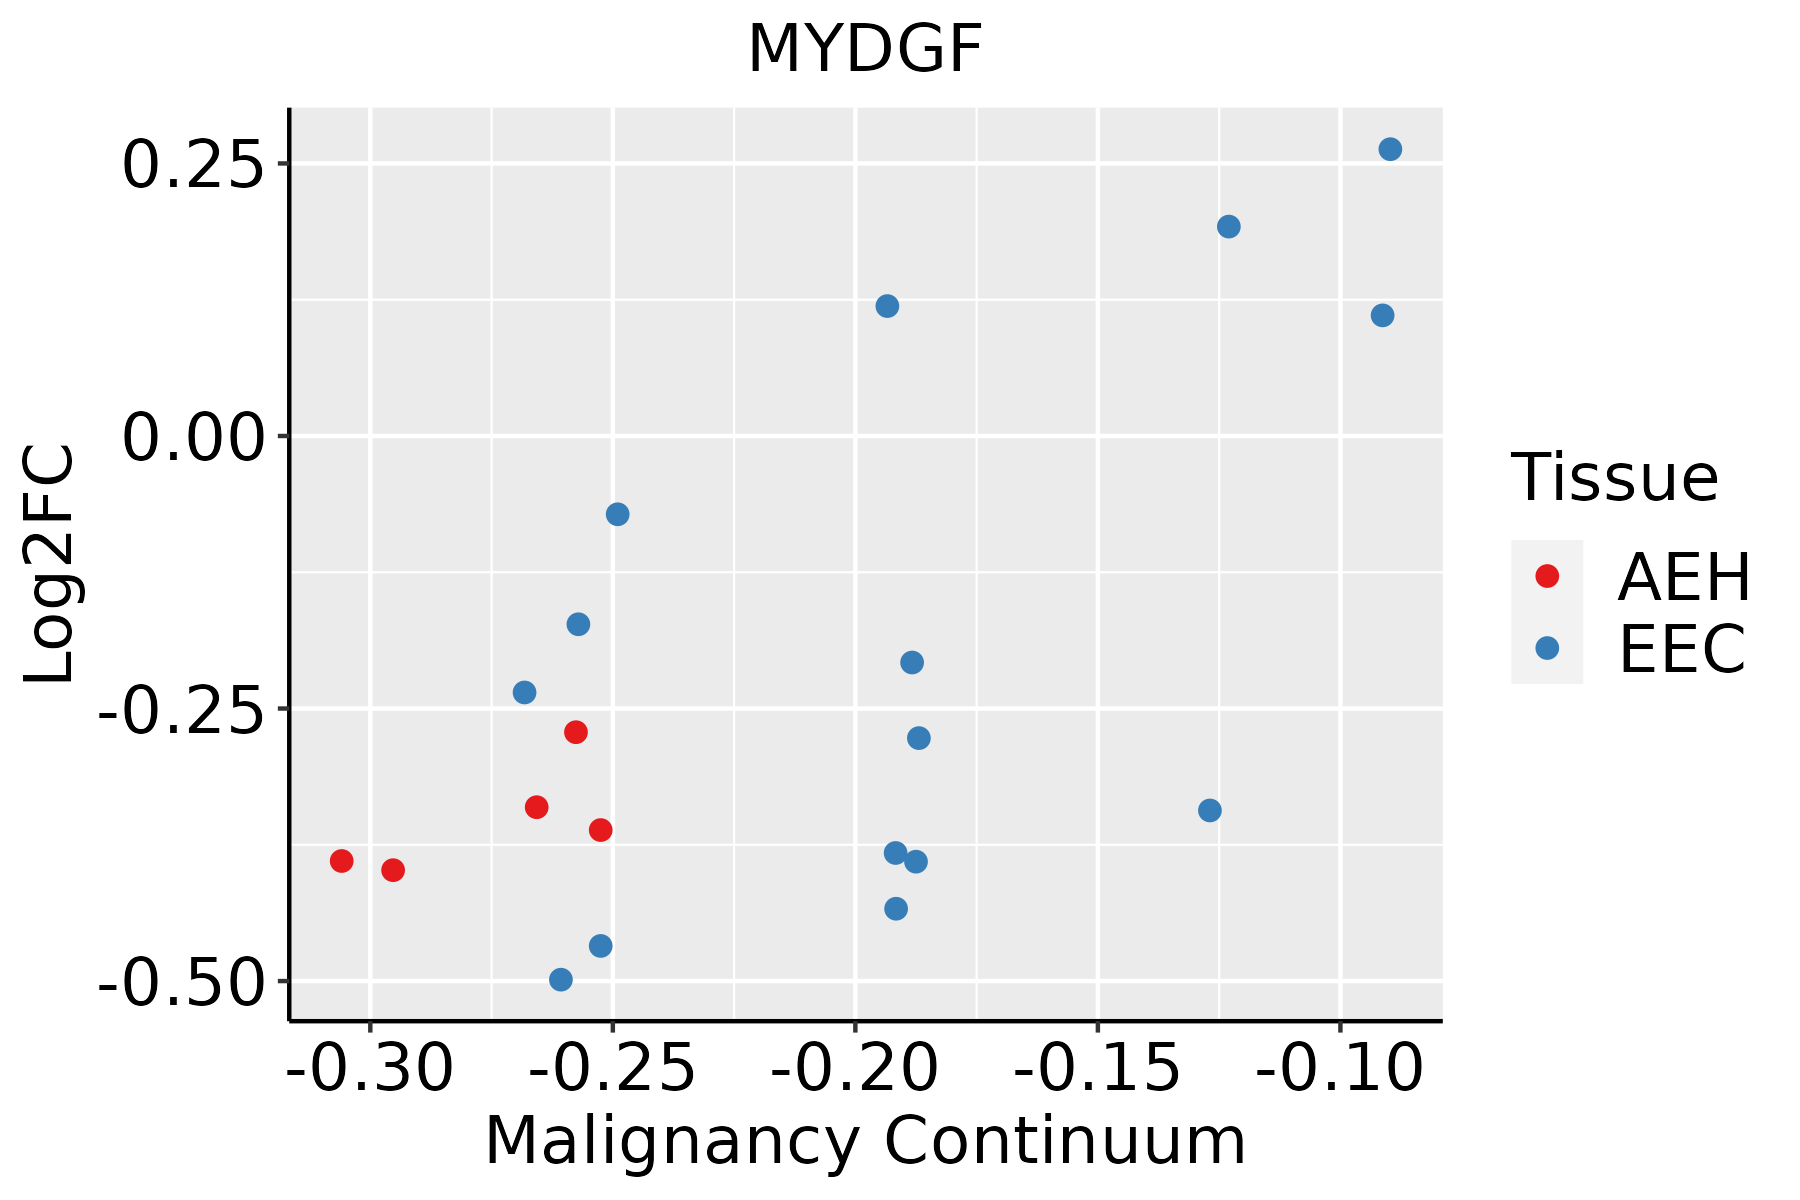 | AEH: Atypical endometrial hyperplasia |
| EEC: Endometrioid Cancer |
| Esophagus | 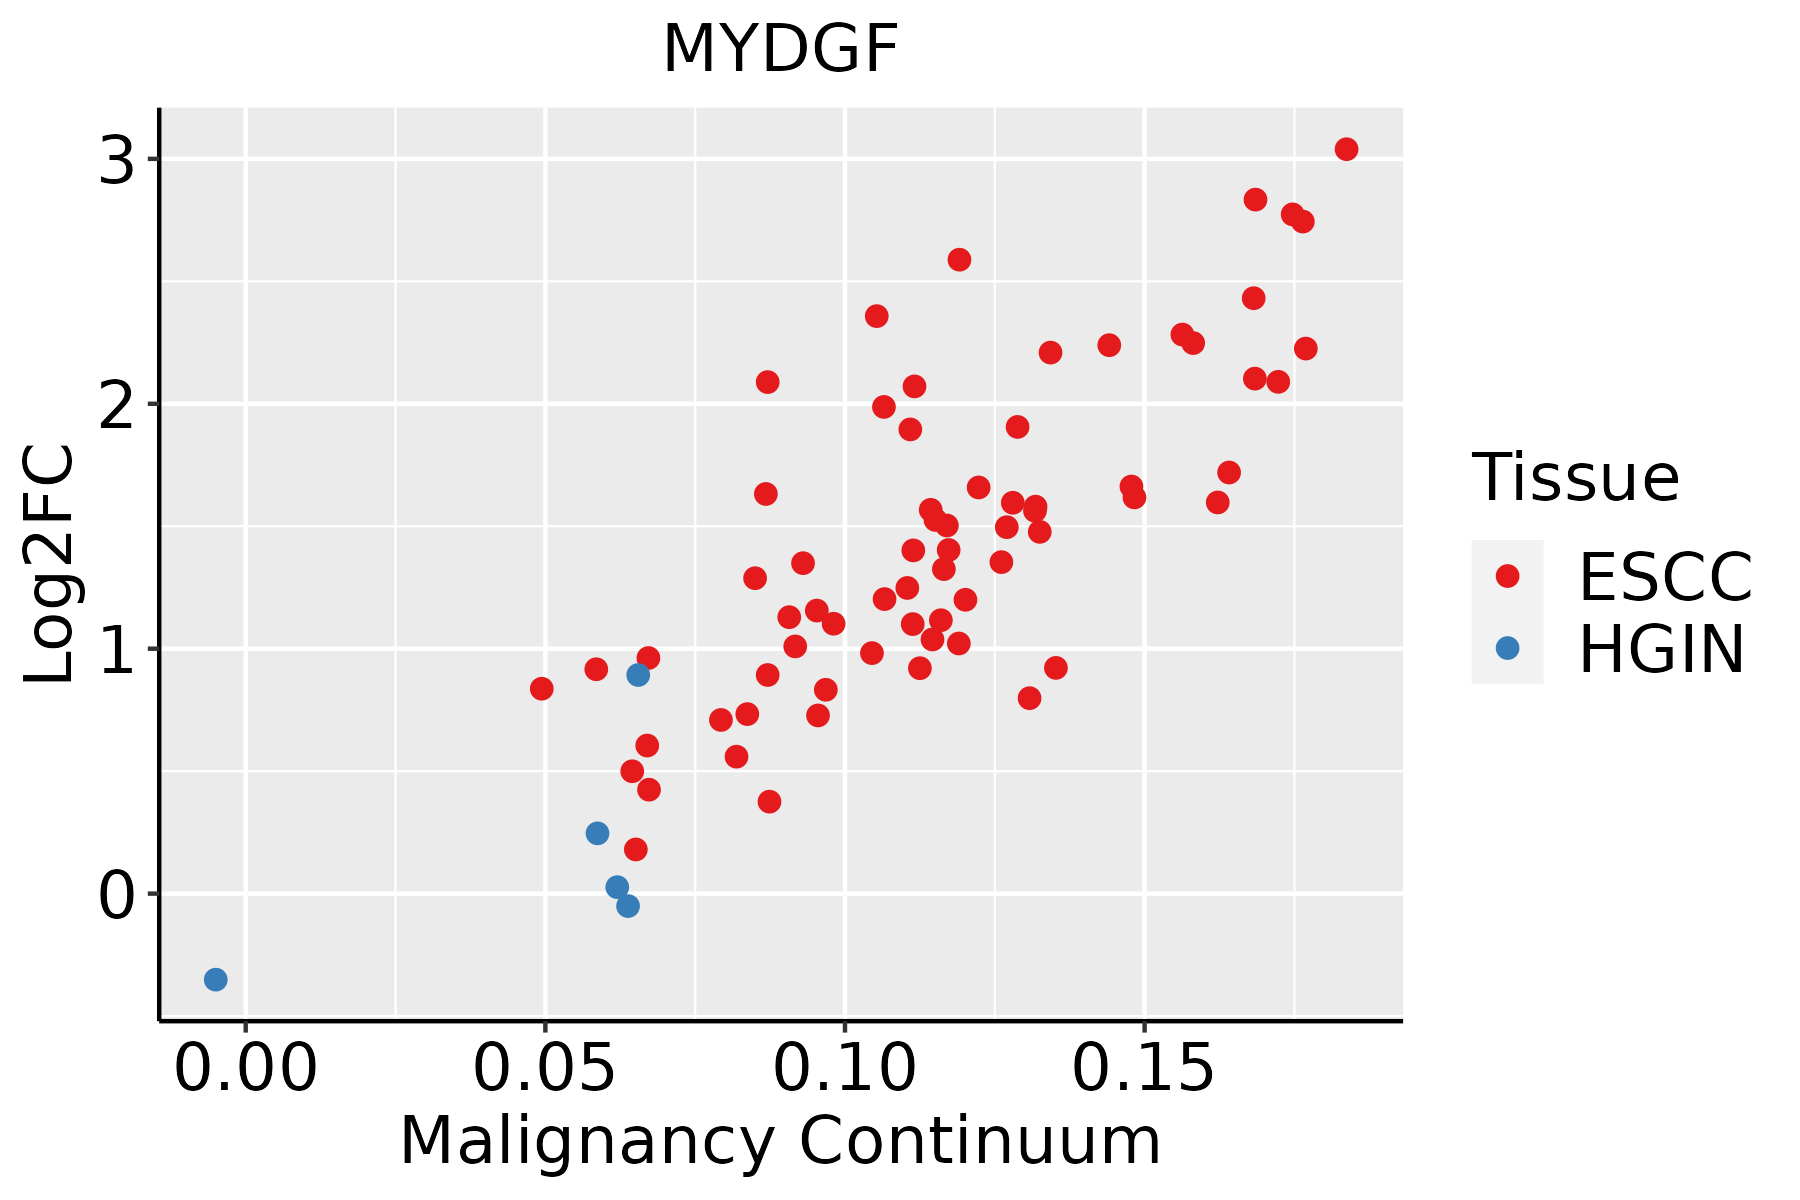 | ESCC: Esophageal squamous cell carcinoma |
| HGIN: High-grade intraepithelial neoplasias |
| LGIN: Low-grade intraepithelial neoplasias |
| GC |  | CAG: Chronic atrophic gastritis |
| CAG with IM: Chronic atrophic gastritis with intestinal metaplasia |
| CSG: Chronic superficial gastritis |
| GC: Gastric cancer |
| SIM: Severe intestinal metaplasia |
| WIM: Wild intestinal metaplasia |
| Liver |  | HCC: Hepatocellular carcinoma |
| NAFLD: Non-alcoholic fatty liver disease |
| Oral Cavity | 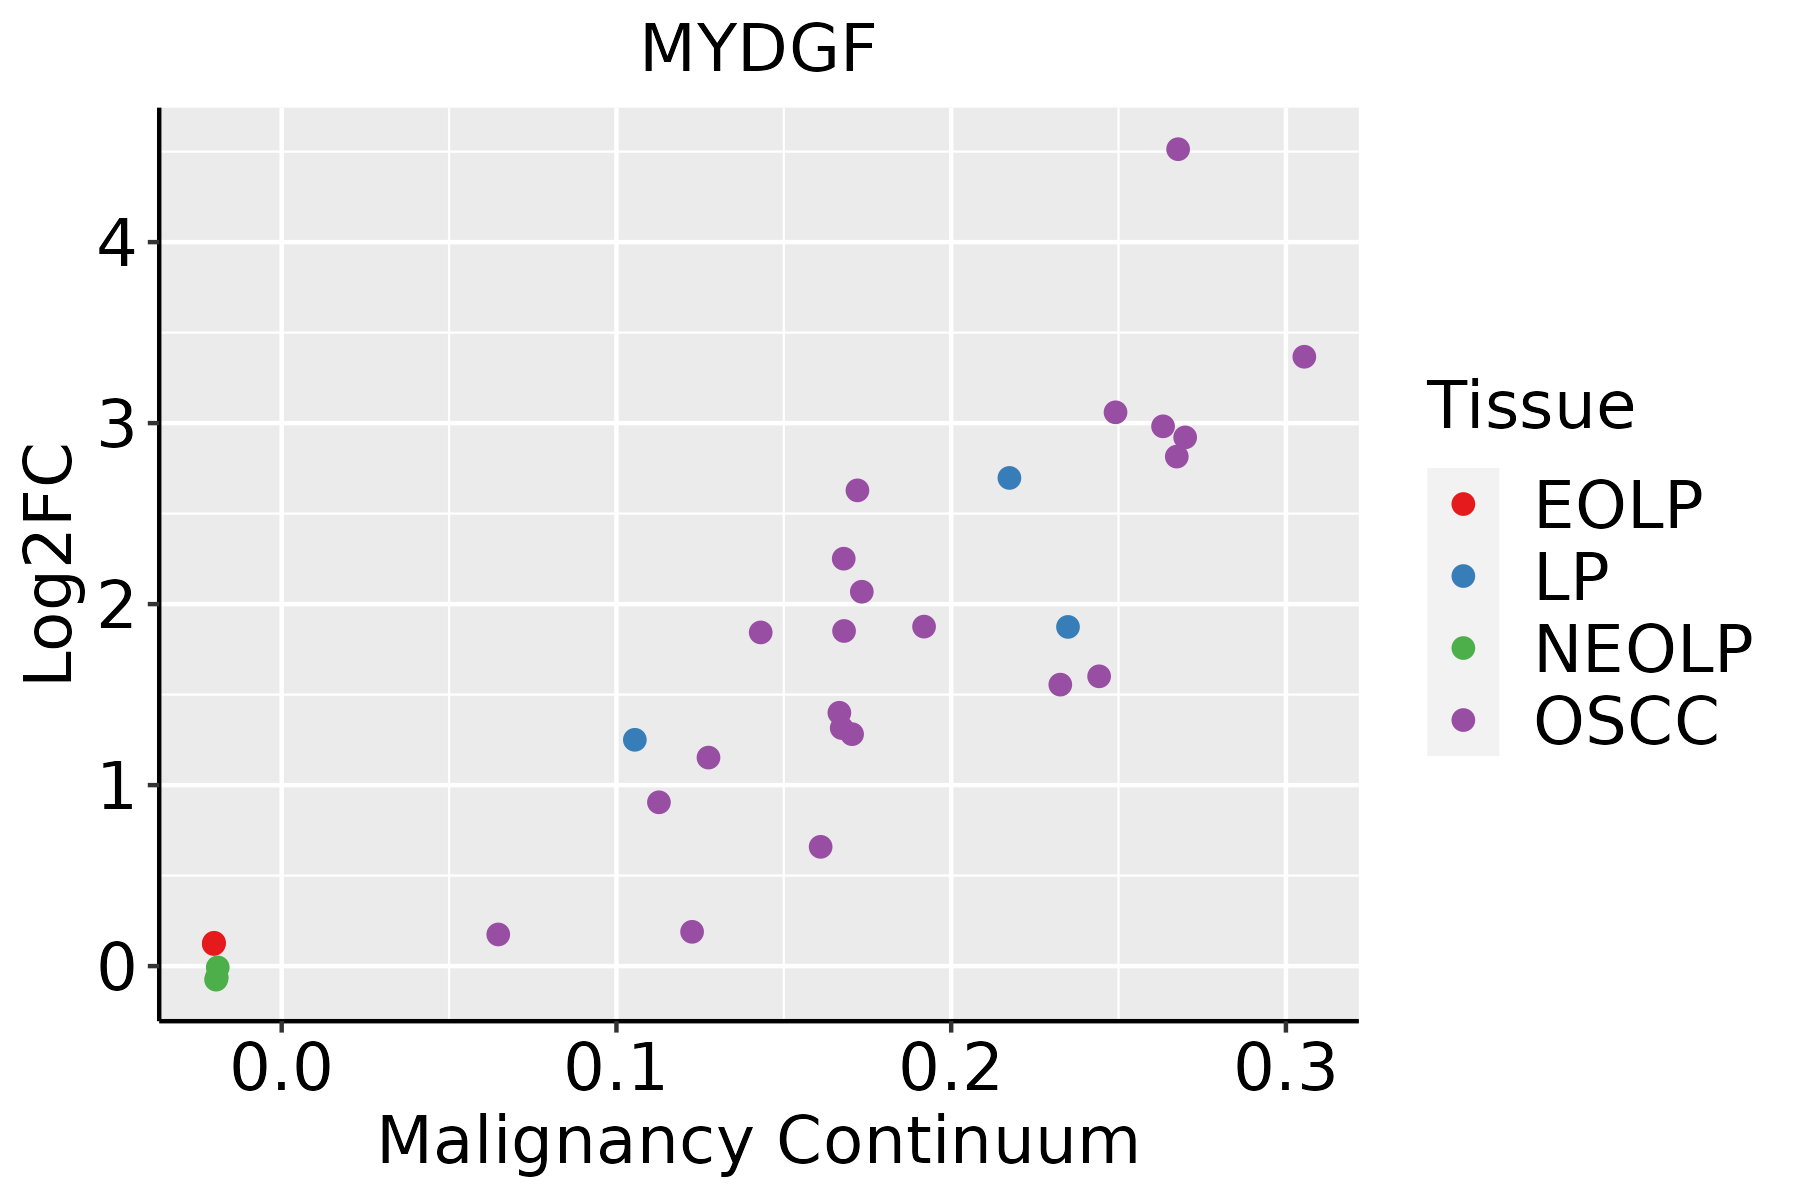 | EOLP: Erosive Oral lichen planus |
| LP: leukoplakia |
| NEOLP: Non-erosive oral lichen planus |
| OSCC: Oral squamous cell carcinoma |
| Prostate |  | BPH: Benign Prostatic Hyperplasia |
| Thyroid |  | ATC: Anaplastic thyroid cancer |
| HT: Hashimoto's thyroiditis |
| PTC: Papillary thyroid cancer |
| GO ID | Tissue | Disease Stage | Description | Gene Ratio | Bg Ratio | pvalue | p.adjust | Count |
| GO:00506737 | Cervix | CC | epithelial cell proliferation | 98/2311 | 437/18723 | 2.01e-09 | 2.15e-07 | 98 |
| GO:00506787 | Cervix | CC | regulation of epithelial cell proliferation | 83/2311 | 381/18723 | 1.31e-07 | 6.42e-06 | 83 |
| GO:00506794 | Cervix | CC | positive regulation of epithelial cell proliferation | 47/2311 | 207/18723 | 2.18e-05 | 3.90e-04 | 47 |
| GO:00434104 | Cervix | CC | positive regulation of MAPK cascade | 90/2311 | 480/18723 | 2.92e-05 | 4.83e-04 | 90 |
| GO:00518964 | Cervix | CC | regulation of protein kinase B signaling | 39/2311 | 185/18723 | 5.25e-04 | 5.10e-03 | 39 |
| GO:00518973 | Cervix | CC | positive regulation of protein kinase B signaling | 28/2311 | 120/18723 | 5.90e-04 | 5.59e-03 | 28 |
| GO:00434913 | Cervix | CC | protein kinase B signaling | 43/2311 | 211/18723 | 5.95e-04 | 5.60e-03 | 43 |
| GO:19013423 | Cervix | CC | regulation of vasculature development | 60/2311 | 348/18723 | 4.48e-03 | 2.72e-02 | 60 |
| GO:00457653 | Cervix | CC | regulation of angiogenesis | 59/2311 | 342/18723 | 4.73e-03 | 2.83e-02 | 59 |
| GO:0014065 | Cervix | CC | phosphatidylinositol 3-kinase signaling | 28/2311 | 144/18723 | 9.50e-03 | 4.72e-02 | 28 |
| GO:004576611 | Cervix | N_HPV | positive regulation of angiogenesis | 18/534 | 181/18723 | 4.51e-06 | 1.71e-04 | 18 |
| GO:190401811 | Cervix | N_HPV | positive regulation of vasculature development | 18/534 | 181/18723 | 4.51e-06 | 1.71e-04 | 18 |
| GO:004576521 | Cervix | N_HPV | regulation of angiogenesis | 25/534 | 342/18723 | 1.80e-05 | 5.30e-04 | 25 |
| GO:190134221 | Cervix | N_HPV | regulation of vasculature development | 25/534 | 348/18723 | 2.41e-05 | 6.66e-04 | 25 |
| GO:005189711 | Cervix | N_HPV | positive regulation of protein kinase B signaling | 10/534 | 120/18723 | 2.30e-03 | 2.13e-02 | 10 |
| GO:005189611 | Cervix | N_HPV | regulation of protein kinase B signaling | 12/534 | 185/18723 | 6.94e-03 | 4.59e-02 | 12 |
| GO:004349112 | Cervix | N_HPV | protein kinase B signaling | 13/534 | 211/18723 | 7.72e-03 | 4.97e-02 | 13 |
| GO:0050673 | Colorectum | AD | epithelial cell proliferation | 119/3918 | 437/18723 | 8.75e-04 | 8.51e-03 | 119 |
| GO:0048017 | Colorectum | AD | inositol lipid-mediated signaling | 53/3918 | 182/18723 | 5.35e-03 | 3.52e-02 | 53 |
| GO:0048015 | Colorectum | AD | phosphatidylinositol-mediated signaling | 52/3918 | 178/18723 | 5.37e-03 | 3.54e-02 | 52 |
| Hugo Symbol | Variant Class | Variant Classification | dbSNP RS | HGVSc | HGVSp | HGVSp Short | SWISSPROT | BIOTYPE | SIFT | PolyPhen | Tumor Sample Barcode | Tissue | Histology | Sex | Age | Stage | Therapy Types | Drugs | Outcome |
| MYDGF | SNV | Missense_Mutation | | c.218N>A | p.Thr73Asn | p.T73N | Q969H8 | protein_coding | deleterious(0) | probably_damaging(0.998) | TCGA-AO-A0JD-01 | Breast | breast invasive carcinoma | Female | <65 | III/IV | Chemotherapy | cyclophosphamide | SD |
| MYDGF | SNV | Missense_Mutation | | c.394N>C | p.Ser132Arg | p.S132R | Q969H8 | protein_coding | tolerated(0.09) | possibly_damaging(0.744) | TCGA-EW-A1OZ-01 | Breast | breast invasive carcinoma | Female | <65 | I/II | Targeted Molecular therapy | trastuzumab | SD |
| MYDGF | deletion | Frame_Shift_Del | | c.394delN | p.Ser132ValfsTer5 | p.S132Vfs*5 | Q969H8 | protein_coding | | | TCGA-D8-A27V-01 | Breast | breast invasive carcinoma | Female | <65 | I/II | Hormone Therapy | tamoxiphen | SD |
| MYDGF | SNV | Missense_Mutation | | c.353A>T | p.Glu118Val | p.E118V | Q969H8 | protein_coding | deleterious(0) | probably_damaging(0.998) | TCGA-AA-3864-01 | Colorectum | colon adenocarcinoma | Male | >=65 | I/II | Unknown | Unknown | SD |
| MYDGF | SNV | Missense_Mutation | novel | c.397G>T | p.Asp133Tyr | p.D133Y | Q969H8 | protein_coding | deleterious(0) | probably_damaging(0.999) | TCGA-A5-A2K5-01 | Endometrium | uterine corpus endometrioid carcinoma | Female | >=65 | I/II | Unknown | Unknown | SD |
| MYDGF | SNV | Missense_Mutation | | c.264N>T | p.Gln88His | p.Q88H | Q969H8 | protein_coding | tolerated(0.11) | possibly_damaging(0.855) | TCGA-AP-A059-01 | Endometrium | uterine corpus endometrioid carcinoma | Female | >=65 | I/II | Unknown | Unknown | SD |
| MYDGF | SNV | Missense_Mutation | rs200622596 | c.253N>A | p.Glu85Lys | p.E85K | Q969H8 | protein_coding | tolerated(0.05) | benign(0.015) | TCGA-AP-A1DV-01 | Endometrium | uterine corpus endometrioid carcinoma | Female | <65 | I/II | Unknown | Unknown | SD |
| MYDGF | SNV | Missense_Mutation | rs769735674 | c.358N>A | p.Ala120Thr | p.A120T | Q969H8 | protein_coding | deleterious(0.01) | benign(0.314) | TCGA-D1-A103-01 | Endometrium | uterine corpus endometrioid carcinoma | Female | >=65 | I/II | Unknown | Unknown | SD |
| MYDGF | SNV | Missense_Mutation | novel | c.268N>C | p.Phe90Leu | p.F90L | Q969H8 | protein_coding | tolerated(0.07) | benign(0.048) | TCGA-D1-A175-01 | Endometrium | uterine corpus endometrioid carcinoma | Female | <65 | I/II | Chemotherapy | paclitaxel | SD |
| MYDGF | SNV | Missense_Mutation | novel | c.182N>G | p.Tyr61Cys | p.Y61C | Q969H8 | protein_coding | deleterious(0) | possibly_damaging(0.807) | TCGA-EO-A22X-01 | Endometrium | uterine corpus endometrioid carcinoma | Female | <65 | III/IV | Unspecific | Carboplatin | Complete Response |


