
|
|||||
|
 | |
| |
| |
| |
| |
| |
|
Gene: MEAF6 |
Gene summary for MEAF6 |
| Gene information | Species | Human | Gene symbol | MEAF6 | Gene ID | 64769 |
| Gene name | MYST/Esa1 associated factor 6 | |
| Gene Alias | C1orf149 | |
| Cytomap | 1p34.3 | |
| Gene Type | protein-coding | GO ID | GO:0006464 | UniProtAcc | Q9HAF1 |
Top |
Malignant transformation analysis |
| Identification of the aberrant gene expression in precancerous and cancerous lesions by comparing the gene expression of stem-like cells in diseased tissues with normal stem cells |
| Entrez ID | Symbol | Replicates | Species | Organ | Tissue | Adj P-value | Log2FC | Malignancy |
| 64769 | MEAF6 | S014 | Human | Liver | HCC | 2.53e-10 | 8.33e-01 | 0.2254 |
| 64769 | MEAF6 | S015 | Human | Liver | HCC | 1.14e-09 | 9.50e-01 | 0.2375 |
| 64769 | MEAF6 | S016 | Human | Liver | HCC | 9.94e-11 | 8.58e-01 | 0.2243 |
| 64769 | MEAF6 | S027 | Human | Liver | HCC | 2.98e-04 | 8.95e-01 | 0.2446 |
| 64769 | MEAF6 | S028 | Human | Liver | HCC | 2.44e-12 | 1.07e+00 | 0.2503 |
| 64769 | MEAF6 | S029 | Human | Liver | HCC | 7.25e-15 | 1.35e+00 | 0.2581 |
| 64769 | MEAF6 | C04 | Human | Oral cavity | OSCC | 2.06e-29 | 1.58e+00 | 0.2633 |
| 64769 | MEAF6 | C21 | Human | Oral cavity | OSCC | 5.44e-66 | 1.94e+00 | 0.2678 |
| 64769 | MEAF6 | C30 | Human | Oral cavity | OSCC | 1.69e-44 | 1.99e+00 | 0.3055 |
| 64769 | MEAF6 | C38 | Human | Oral cavity | OSCC | 2.93e-11 | 1.16e+00 | 0.172 |
| 64769 | MEAF6 | C43 | Human | Oral cavity | OSCC | 4.93e-29 | 7.07e-01 | 0.1704 |
| 64769 | MEAF6 | C46 | Human | Oral cavity | OSCC | 9.04e-24 | 7.22e-01 | 0.1673 |
| 64769 | MEAF6 | C51 | Human | Oral cavity | OSCC | 3.80e-11 | 8.33e-01 | 0.2674 |
| 64769 | MEAF6 | C57 | Human | Oral cavity | OSCC | 3.85e-09 | 5.22e-01 | 0.1679 |
| 64769 | MEAF6 | C06 | Human | Oral cavity | OSCC | 1.90e-05 | 1.05e+00 | 0.2699 |
| 64769 | MEAF6 | C07 | Human | Oral cavity | OSCC | 2.93e-08 | 1.41e+00 | 0.2491 |
| 64769 | MEAF6 | C08 | Human | Oral cavity | OSCC | 1.27e-41 | 9.30e-01 | 0.1919 |
| 64769 | MEAF6 | C09 | Human | Oral cavity | OSCC | 5.11e-15 | 5.59e-01 | 0.1431 |
| 64769 | MEAF6 | LN22 | Human | Oral cavity | OSCC | 1.38e-09 | 1.00e+00 | 0.1733 |
| 64769 | MEAF6 | LN46 | Human | Oral cavity | OSCC | 2.31e-13 | 7.68e-01 | 0.1666 |
| Page: 1 2 3 4 5 6 7 |
| Tissue | Expression Dynamics | Abbreviation |
| Esophagus | 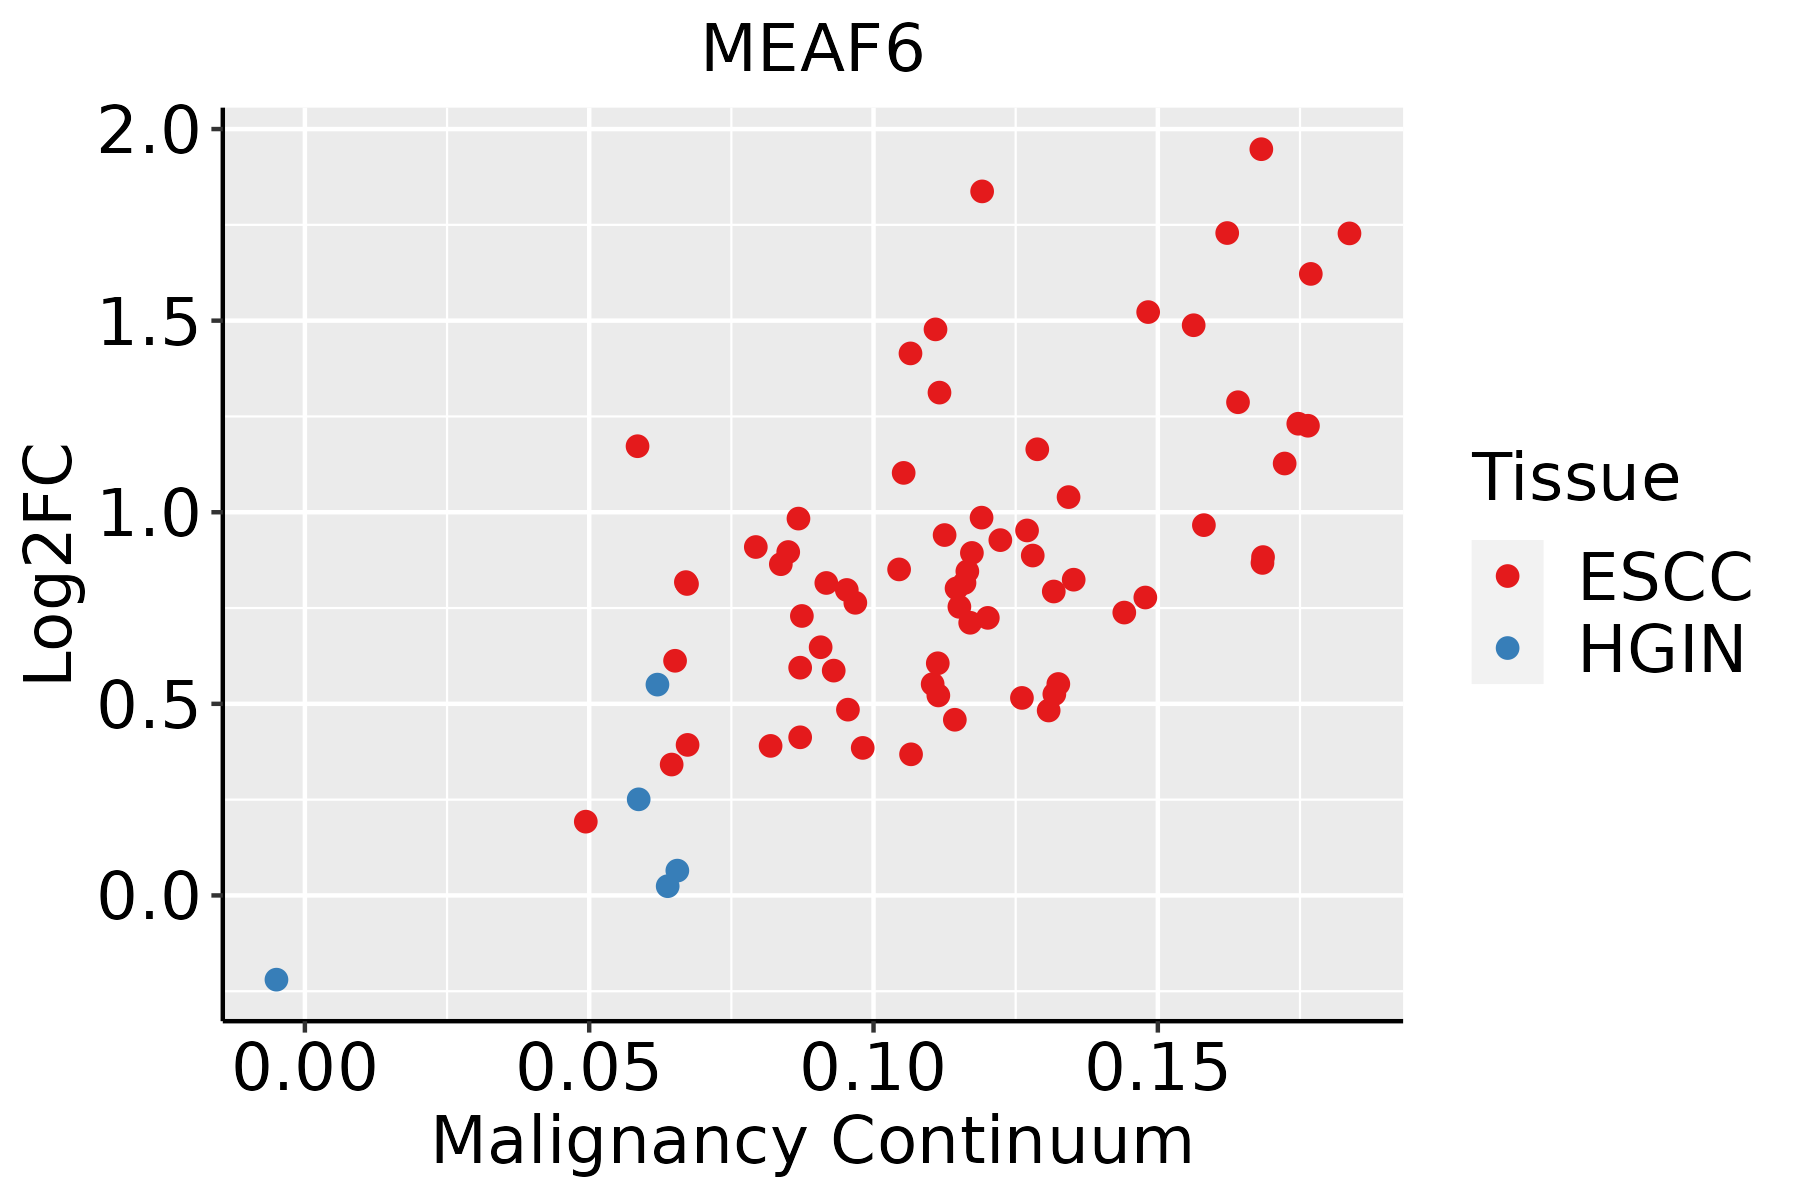 | ESCC: Esophageal squamous cell carcinoma |
| HGIN: High-grade intraepithelial neoplasias | ||
| LGIN: Low-grade intraepithelial neoplasias | ||
| Liver | 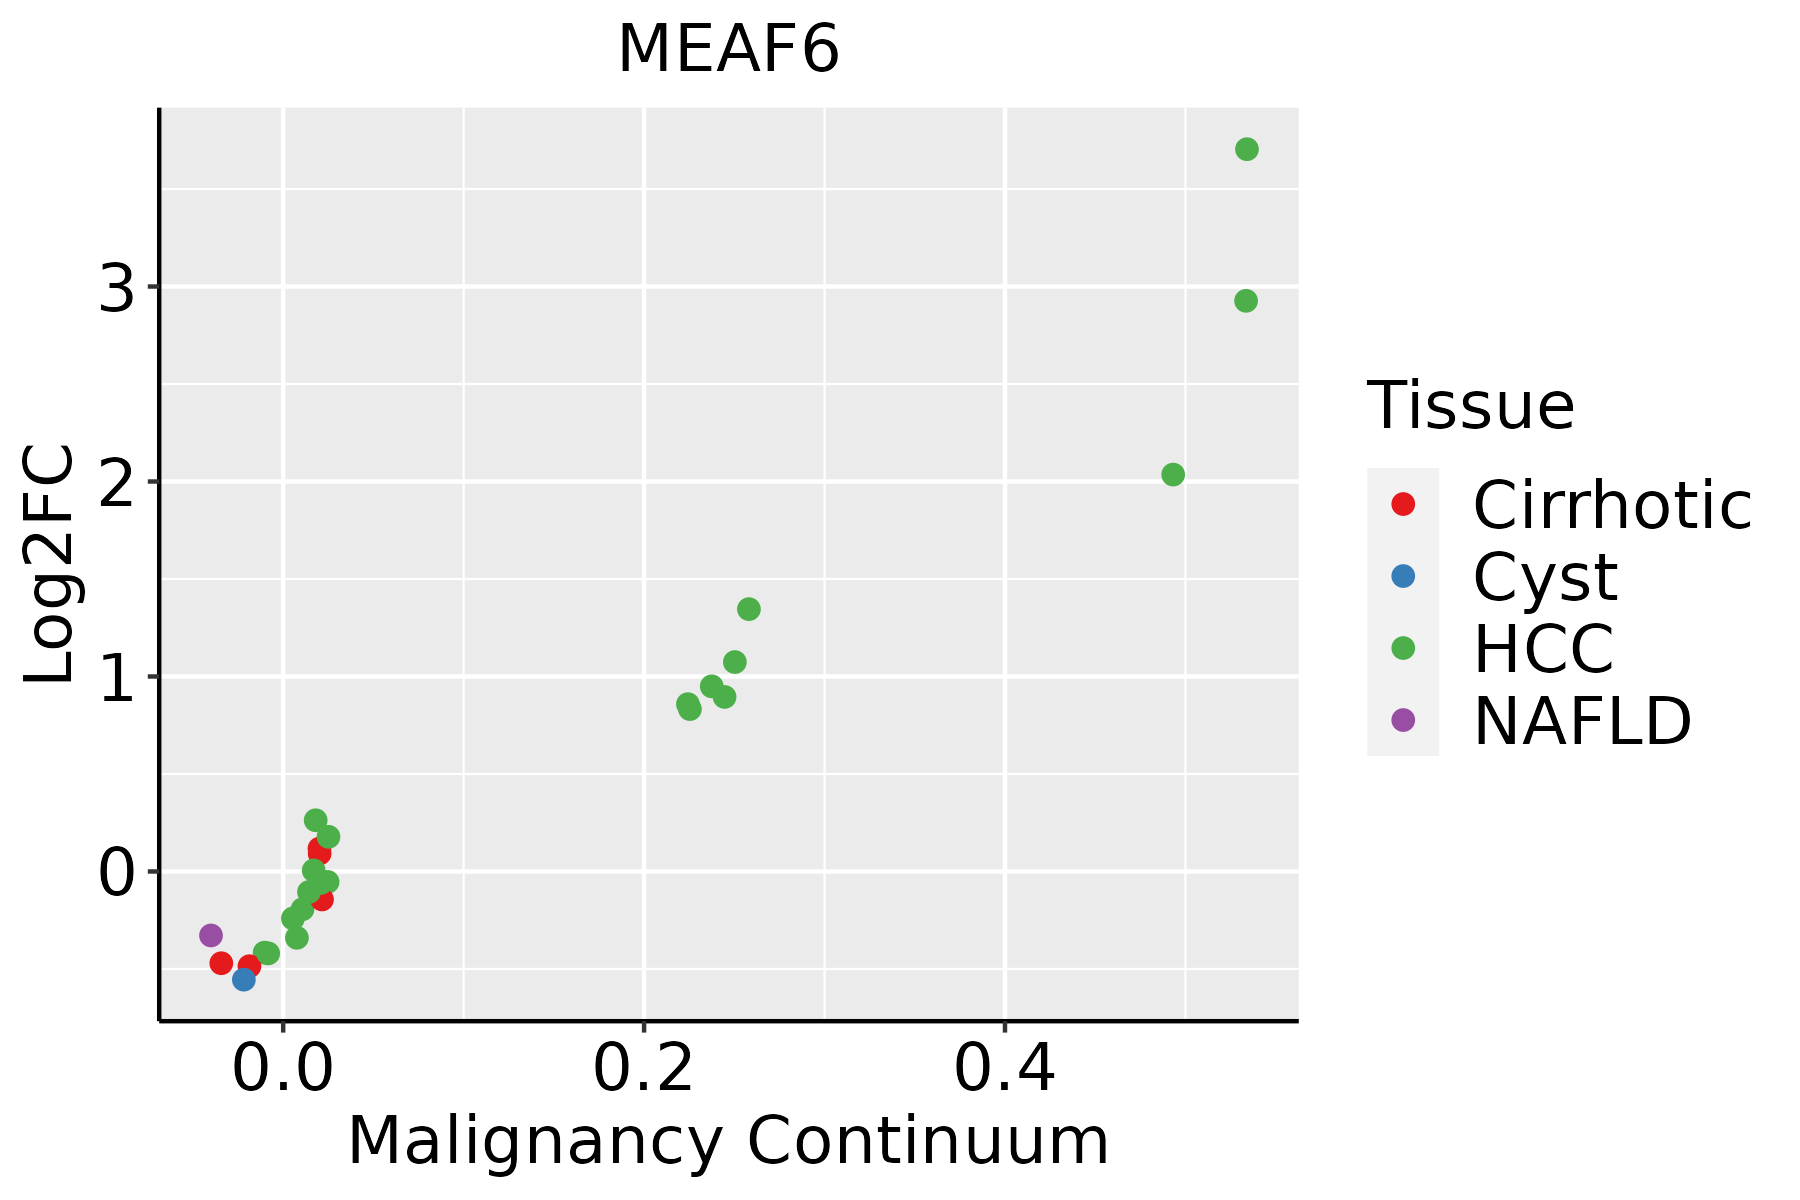 | HCC: Hepatocellular carcinoma |
| NAFLD: Non-alcoholic fatty liver disease | ||
| Oral Cavity | 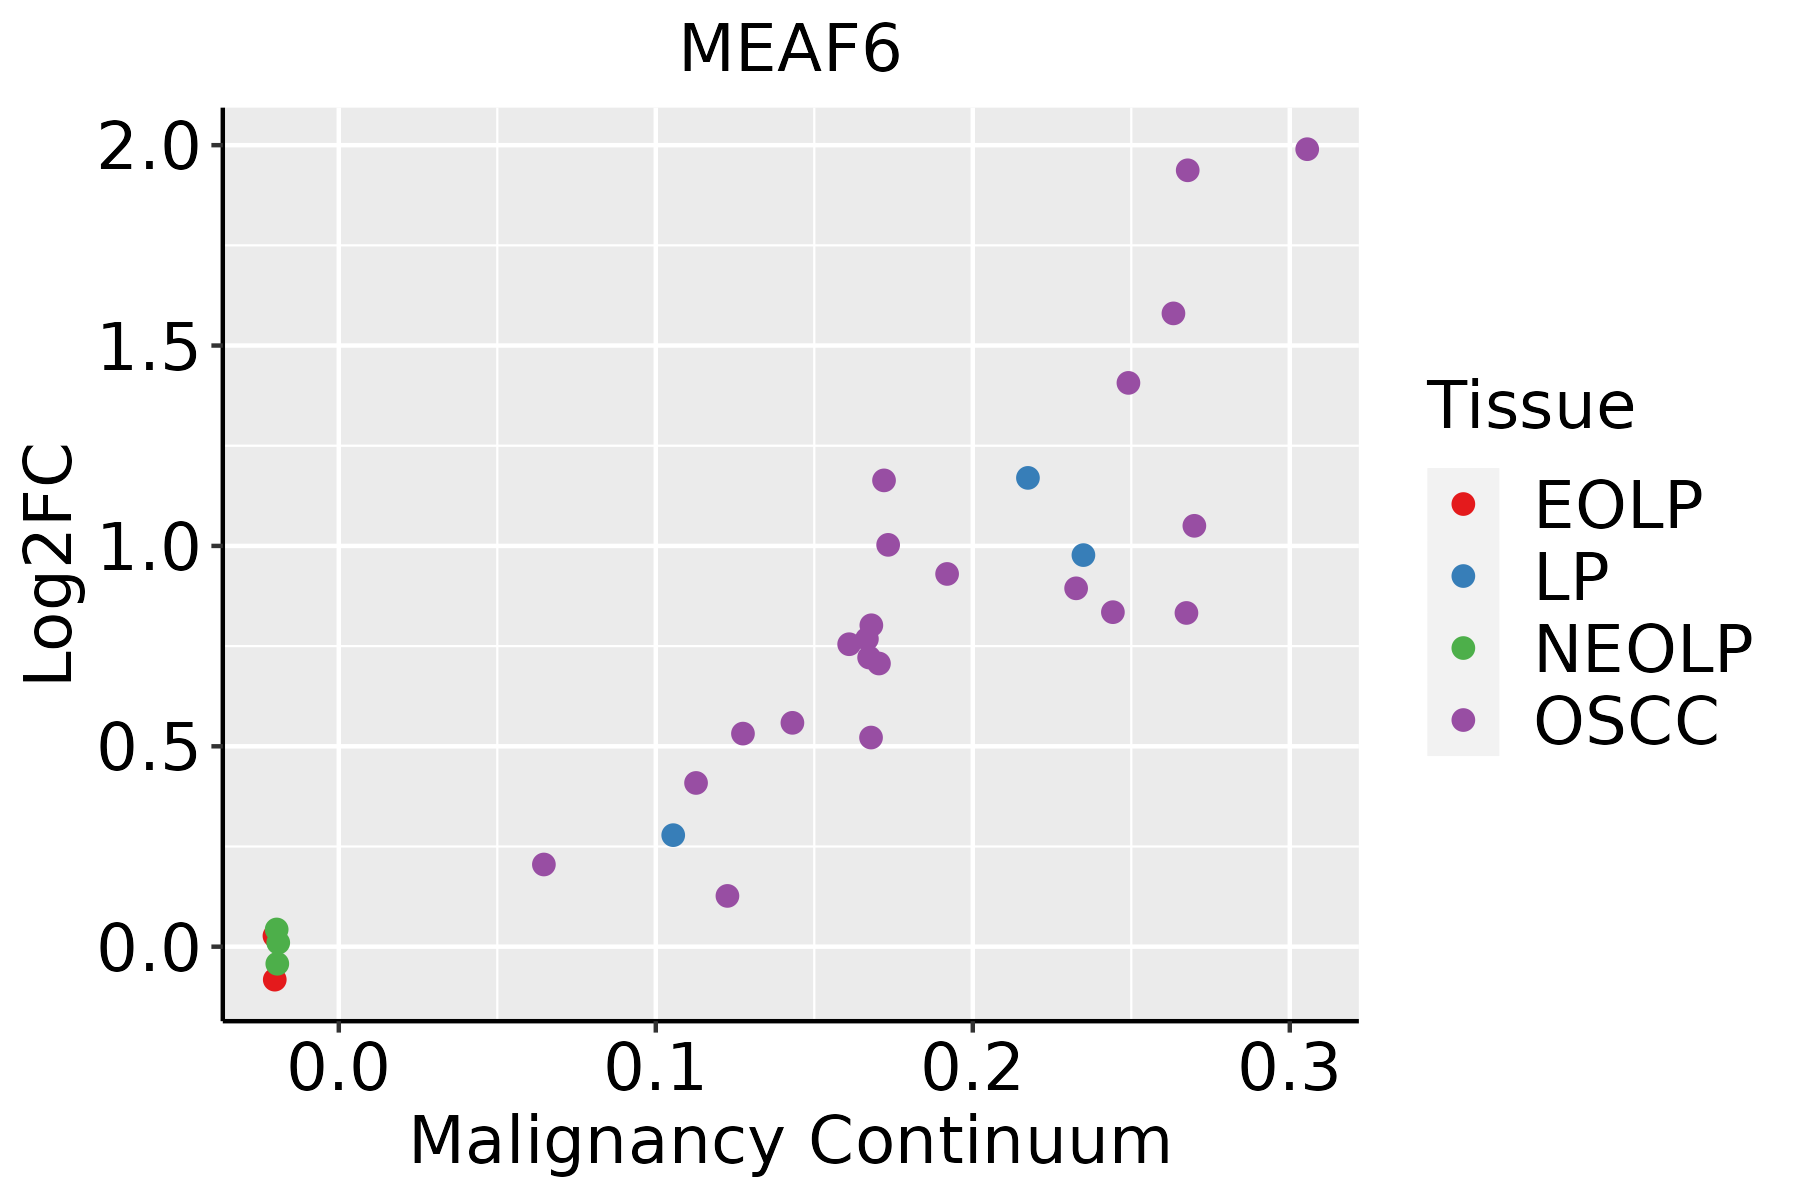 | EOLP: Erosive Oral lichen planus |
| LP: leukoplakia | ||
| NEOLP: Non-erosive oral lichen planus | ||
| OSCC: Oral squamous cell carcinoma | ||
| Prostate | 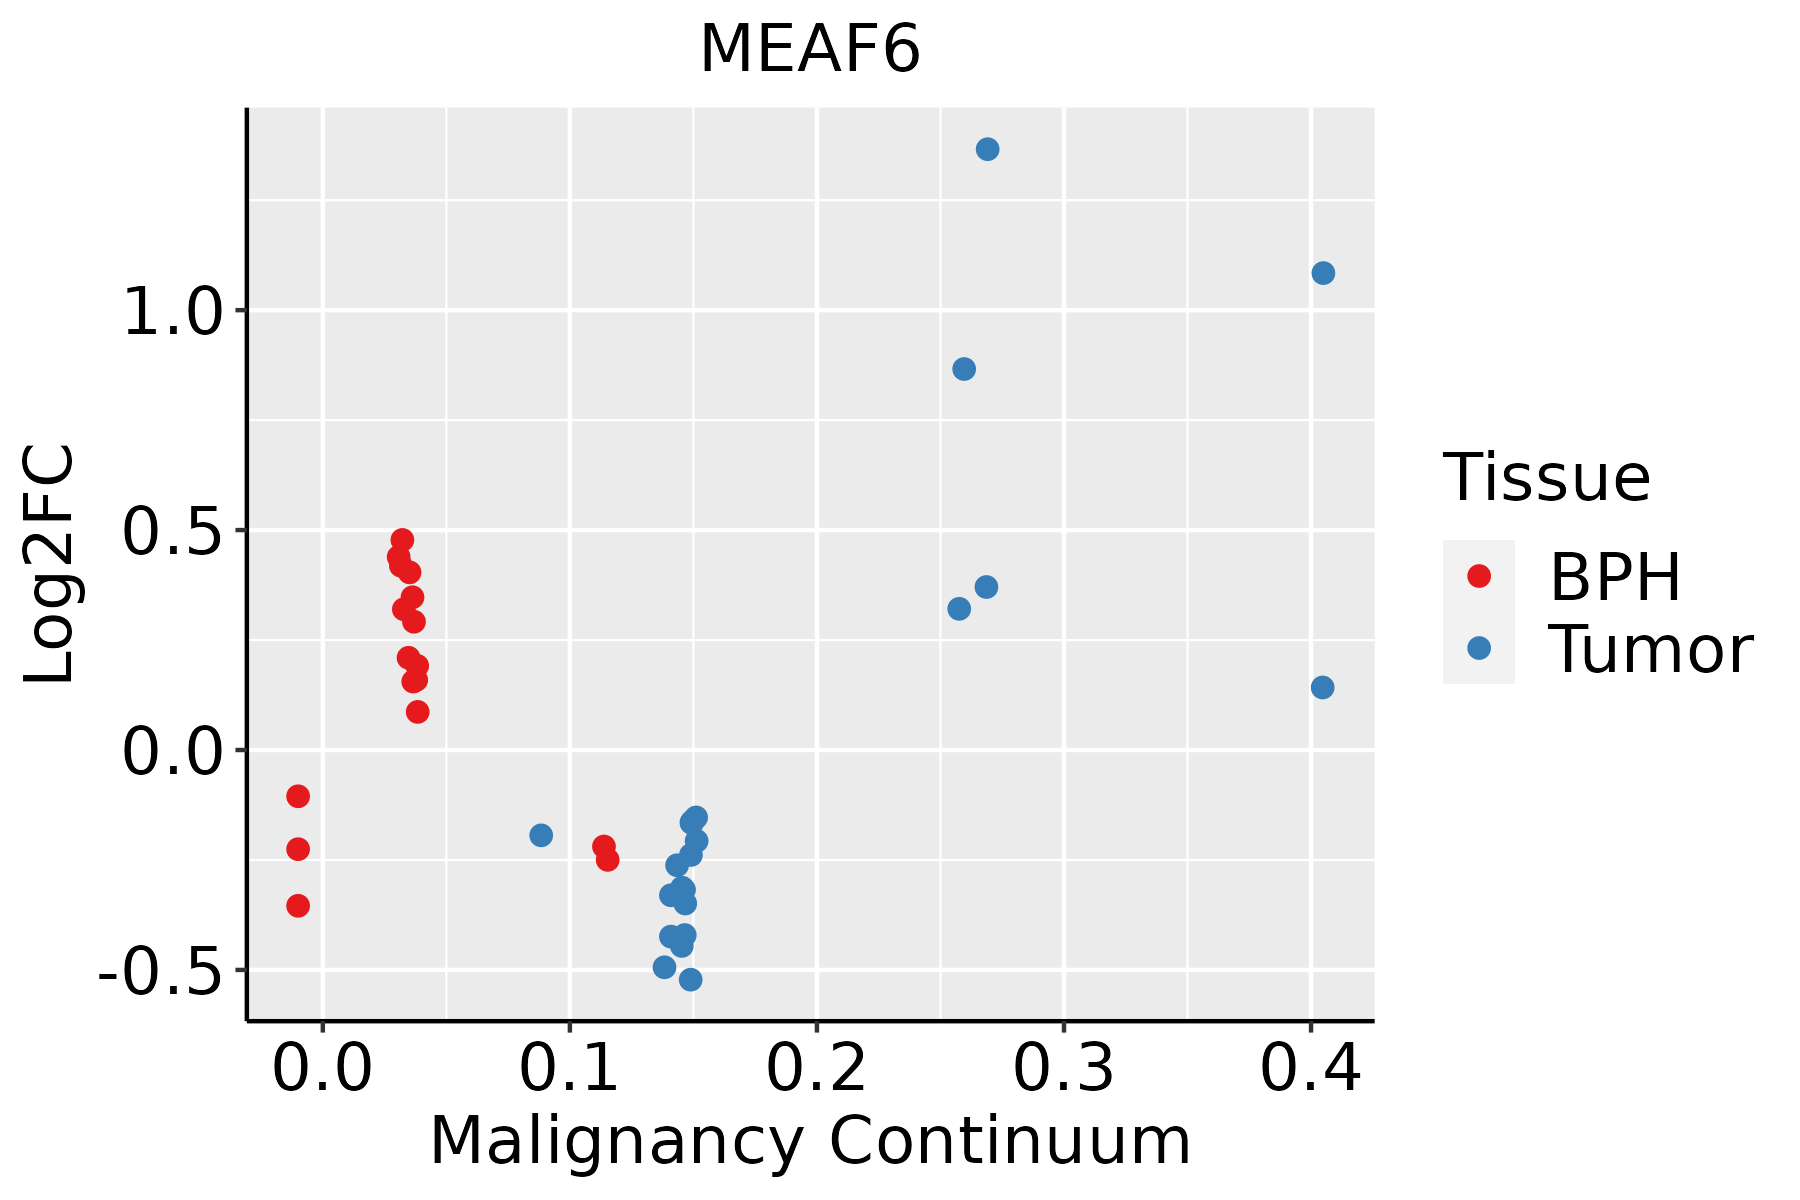 | BPH: Benign Prostatic Hyperplasia |
| Skin | 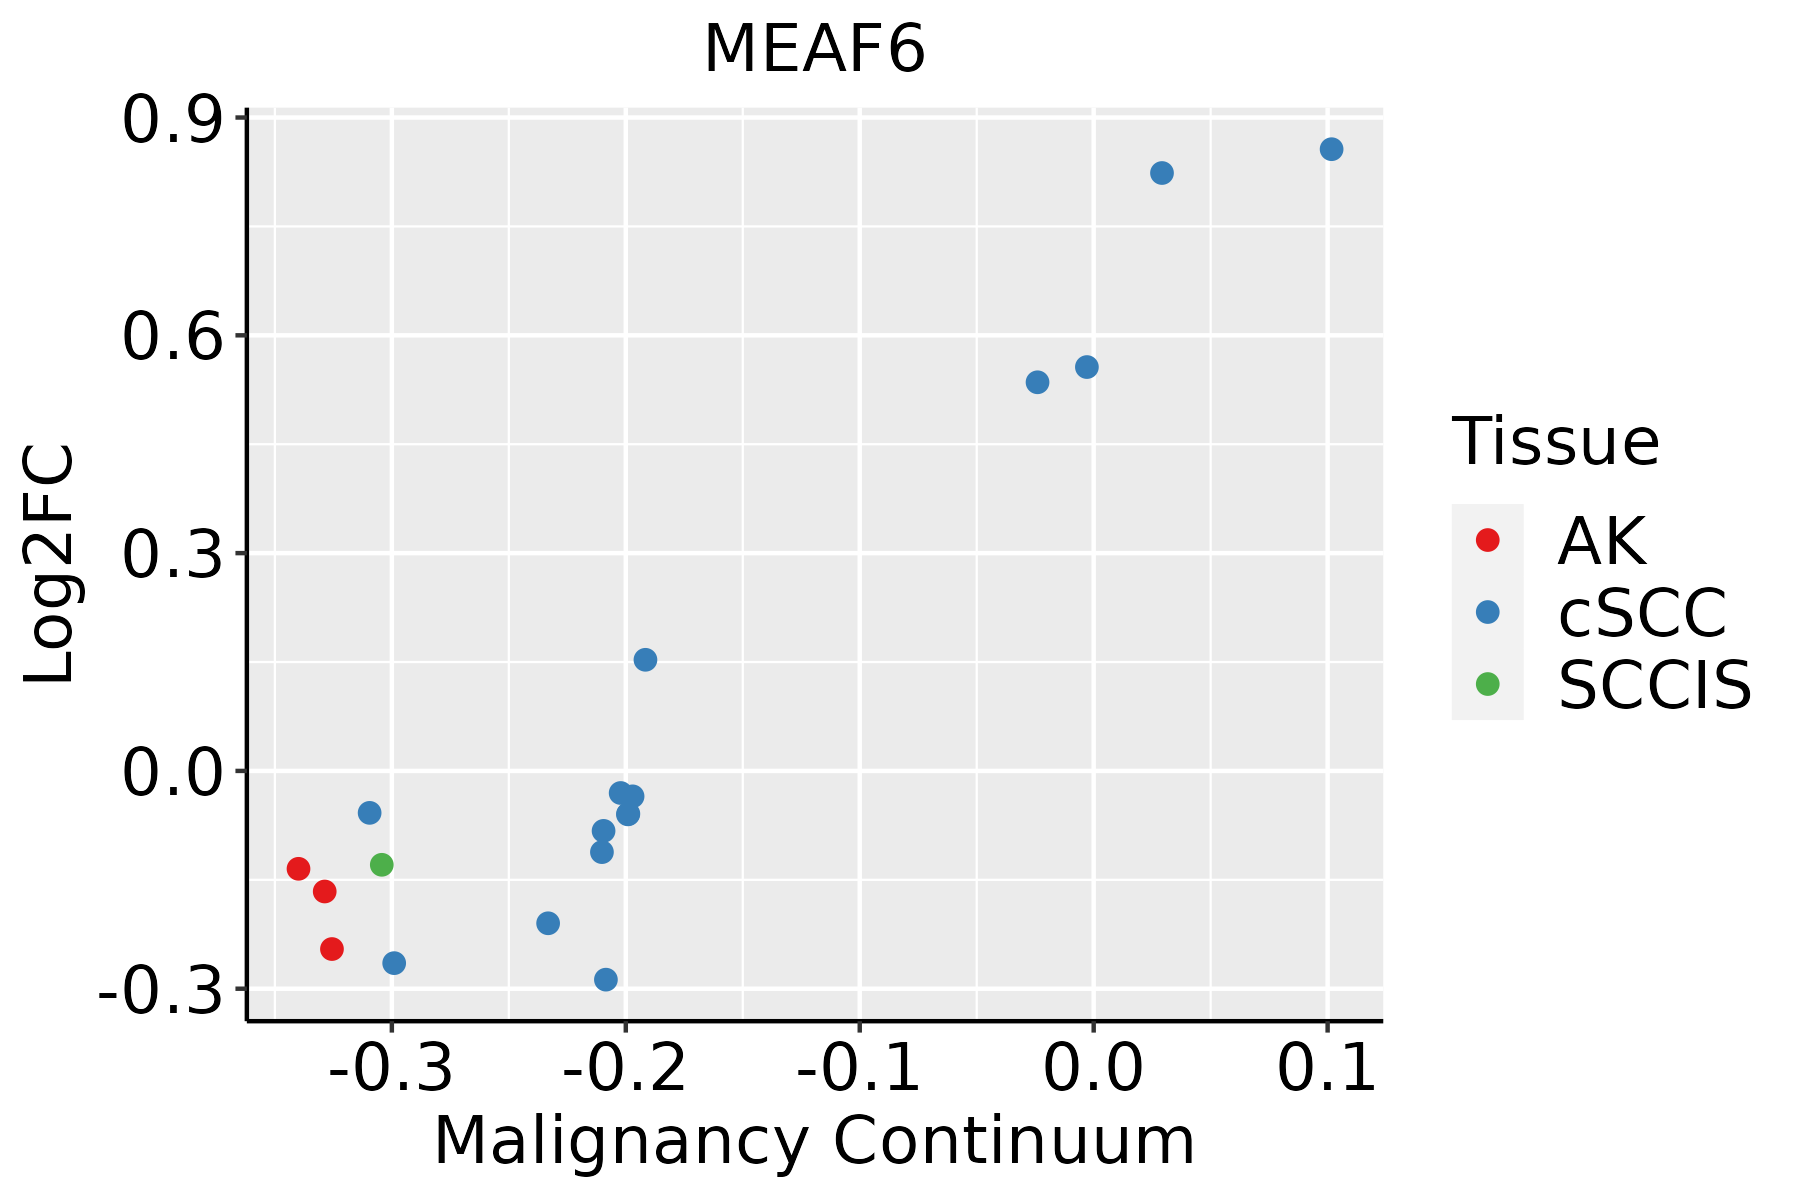 | AK: Actinic keratosis |
| cSCC: Cutaneous squamous cell carcinoma | ||
| SCCIS:squamous cell carcinoma in situ | ||
| Thyroid |  | ATC: Anaplastic thyroid cancer |
| HT: Hashimoto's thyroiditis | ||
| PTC: Papillary thyroid cancer |
| ∗log2FC in expression of this searched gene in stem-like cells from each diseased tissue sample relative to stem-like cells in normal samples in each tissue plotted against the malignancy continuum. Samples are colored based on if they are from different disease stage. |
Top |
Malignant transformation related pathway analysis |
| Find out the enriched GO biological processes and KEGG pathways involved in transition from healthy to precancer to cancer |
| Tissue | Disease Stage | Enriched GO biological Processes |
| Colorectum | AD |  |
| Colorectum | SER |  |
| Colorectum | MSS |  |
| Colorectum | MSI-H |  |
| Colorectum | FAP |  |
| ∗Top 15 enriched GO BP terms are showed in the bar plot of each disease state in each tissue. Each row represents a significant GO biological process which is colored according to the -log10(p.adjust). |
| Page: 1 2 3 4 5 6 7 8 9 |
| GO ID | Tissue | Disease Stage | Description | Gene Ratio | Bg Ratio | pvalue | p.adjust | Count |
| GO:00182057 | Esophagus | HGIN | peptidyl-lysine modification | 88/2587 | 376/18723 | 2.99e-07 | 1.39e-05 | 88 |
| GO:00165708 | Esophagus | HGIN | histone modification | 92/2587 | 463/18723 | 1.70e-04 | 3.30e-03 | 92 |
| GO:00064735 | Esophagus | HGIN | protein acetylation | 45/2587 | 201/18723 | 6.17e-04 | 8.58e-03 | 45 |
| GO:00183945 | Esophagus | HGIN | peptidyl-lysine acetylation | 39/2587 | 169/18723 | 7.46e-04 | 9.90e-03 | 39 |
| GO:00435435 | Esophagus | HGIN | protein acylation | 51/2587 | 243/18723 | 1.33e-03 | 1.57e-02 | 51 |
| GO:00439675 | Esophagus | HGIN | histone H4 acetylation | 19/2587 | 67/18723 | 1.39e-03 | 1.63e-02 | 19 |
| GO:00064755 | Esophagus | HGIN | internal protein amino acid acetylation | 36/2587 | 160/18723 | 1.87e-03 | 2.01e-02 | 36 |
| GO:00183935 | Esophagus | HGIN | internal peptidyl-lysine acetylation | 35/2587 | 158/18723 | 2.82e-03 | 2.75e-02 | 35 |
| GO:001657015 | Esophagus | ESCC | histone modification | 323/8552 | 463/18723 | 2.61e-26 | 7.88e-24 | 323 |
| GO:001820514 | Esophagus | ESCC | peptidyl-lysine modification | 259/8552 | 376/18723 | 3.90e-20 | 5.26e-18 | 259 |
| GO:001839413 | Esophagus | ESCC | peptidyl-lysine acetylation | 123/8552 | 169/18723 | 6.58e-13 | 2.94e-11 | 123 |
| GO:004354313 | Esophagus | ESCC | protein acylation | 165/8552 | 243/18723 | 1.69e-12 | 7.14e-11 | 165 |
| GO:000647313 | Esophagus | ESCC | protein acetylation | 140/8552 | 201/18723 | 4.37e-12 | 1.69e-10 | 140 |
| GO:001839313 | Esophagus | ESCC | internal peptidyl-lysine acetylation | 114/8552 | 158/18723 | 1.16e-11 | 4.24e-10 | 114 |
| GO:000647513 | Esophagus | ESCC | internal protein amino acid acetylation | 115/8552 | 160/18723 | 1.43e-11 | 5.08e-10 | 115 |
| GO:00165735 | Esophagus | ESCC | histone acetylation | 110/8552 | 152/18723 | 1.95e-11 | 6.81e-10 | 110 |
| GO:004396712 | Esophagus | ESCC | histone H4 acetylation | 53/8552 | 67/18723 | 2.11e-08 | 4.03e-07 | 53 |
| GO:00439662 | Esophagus | ESCC | histone H3 acetylation | 43/8552 | 61/18723 | 7.57e-05 | 5.67e-04 | 43 |
| GO:00439682 | Esophagus | ESCC | histone H2A acetylation | 15/8552 | 17/18723 | 3.48e-04 | 2.03e-03 | 15 |
| GO:00439811 | Esophagus | ESCC | histone H4-K5 acetylation | 13/8552 | 15/18723 | 1.31e-03 | 6.26e-03 | 13 |
| Page: 1 2 3 4 5 6 7 |
| Pathway ID | Tissue | Disease Stage | Description | Gene Ratio | Bg Ratio | pvalue | p.adjust | qvalue | Count |
| Page: 1 |
Top |
Cell-cell communication analysis |
| Identification of potential cell-cell interactions between two cell types and their ligand-receptor pairs for different disease states |
| Ligand | Receptor | LRpair | Pathway | Tissue | Disease Stage |
| Page: 1 |
Top |
Single-cell gene regulatory network inference analysis |
| Find out the significant the regulons (TFs) and the target genes of each regulon across cell types for different disease states |
| TF | Cell Type | Tissue | Disease Stage | Target Gene | RSS | Regulon Activity |
| ∗The dot plots of a searched regulon are shown for all cell subpopulations in each disease state of each tissue based on the regulon specific score inferred using pySCENIC and by calculating the average expression. |
| Page: 1 |
Top |
Somatic mutation of malignant transformation related genes |
| Annotation of somatic variants for genes involved in malignant transformation |
| Hugo Symbol | Variant Class | Variant Classification | dbSNP RS | HGVSc | HGVSp | HGVSp Short | SWISSPROT | BIOTYPE | SIFT | PolyPhen | Tumor Sample Barcode | Tissue | Histology | Sex | Age | Stage | Therapy Types | Drugs | Outcome |
| MEAF6 | SNV | Missense_Mutation | c.120C>G | p.Ile40Met | p.I40M | Q9HAF1 | protein_coding | deleterious(0.03) | probably_damaging(0.999) | TCGA-C8-A12K-01 | Breast | breast invasive carcinoma | Female | >=65 | I/II | Unknown | Unknown | SD | |
| MEAF6 | SNV | Missense_Mutation | c.275C>T | p.Ser92Phe | p.S92F | Q9HAF1 | protein_coding | deleterious(0) | possibly_damaging(0.804) | TCGA-D8-A27V-01 | Breast | breast invasive carcinoma | Female | <65 | I/II | Hormone Therapy | tamoxiphen | SD | |
| MEAF6 | SNV | Missense_Mutation | novel | c.130N>C | p.Glu44Gln | p.E44Q | Q9HAF1 | protein_coding | deleterious(0) | probably_damaging(0.999) | TCGA-HM-A4S6-01 | Cervix | cervical & endocervical cancer | Female | <65 | III/IV | Chemotherapy | cisplatin | CR |
| MEAF6 | SNV | Missense_Mutation | c.289G>A | p.Ala97Thr | p.A97T | Q9HAF1 | protein_coding | tolerated(0.36) | benign(0.036) | TCGA-AA-3710-01 | Colorectum | colon adenocarcinoma | Female | >=65 | I/II | Unknown | Unknown | SD | |
| MEAF6 | SNV | Missense_Mutation | c.516N>T | p.Lys172Asn | p.K172N | Q9HAF1 | protein_coding | deleterious_low_confidence(0) | probably_damaging(0.985) | TCGA-AA-A010-01 | Colorectum | colon adenocarcinoma | Female | <65 | I/II | Chemotherapy | folinic | CR | |
| MEAF6 | SNV | Missense_Mutation | c.332N>C | p.Ile111Thr | p.I111T | Q9HAF1 | protein_coding | tolerated(0.59) | benign(0.014) | TCGA-G4-6588-01 | Colorectum | colon adenocarcinoma | Female | <65 | I/II | Unknown | Unknown | SD | |
| MEAF6 | SNV | Missense_Mutation | novel | c.415N>A | p.Asp139Asn | p.D139N | Q9HAF1 | protein_coding | deleterious(0.03) | benign(0.443) | TCGA-A5-A0G1-01 | Endometrium | uterine corpus endometrioid carcinoma | Female | >=65 | I/II | Unknown | Unknown | SD |
| MEAF6 | SNV | Missense_Mutation | rs868263057 | c.230N>A | p.Arg77Gln | p.R77Q | Q9HAF1 | protein_coding | tolerated(0.05) | benign(0.024) | TCGA-A5-A0G1-01 | Endometrium | uterine corpus endometrioid carcinoma | Female | >=65 | I/II | Unknown | Unknown | SD |
| MEAF6 | SNV | Missense_Mutation | rs868263057 | c.230N>A | p.Arg77Gln | p.R77Q | Q9HAF1 | protein_coding | tolerated(0.05) | benign(0.024) | TCGA-A5-A0GG-01 | Endometrium | uterine corpus endometrioid carcinoma | Female | >=65 | I/II | Unknown | Unknown | SD |
| MEAF6 | SNV | Missense_Mutation | c.239G>A | p.Arg80Gln | p.R80Q | Q9HAF1 | protein_coding | deleterious(0.01) | possibly_damaging(0.732) | TCGA-AJ-A3EK-01 | Endometrium | uterine corpus endometrioid carcinoma | Female | <65 | I/II | Chemotherapy | carboplatin | CR |
| Page: 1 2 3 |
Top |
Related drugs of malignant transformation related genes |
| Identification of chemicals and drugs interact with genes involved in malignant transfromation |
| (DGIdb 4.0) |
| Entrez ID | Symbol | Category | Interaction Types | Drug Claim Name | Drug Name | PMIDs |
| Page: 1 |

Copyright 2023-Present -The University of Texas Health Science Center at Houston |